. 2022 Aug 10;2(1):ltac019.
doi: 10.1093/immadv/ltac019. eCollection 2022.

Characterization of sabatolimab, a novel immunotherapy with immuno-myeloid activity directed against TIM-3 receptor

Affiliations

Characterization of sabatolimab, a novel immunotherapy with immuno-myeloid activity directed against TIM-3 receptor

Stephanie Schwartz et al. Immunother Adv. .

Erratum in

Abstract

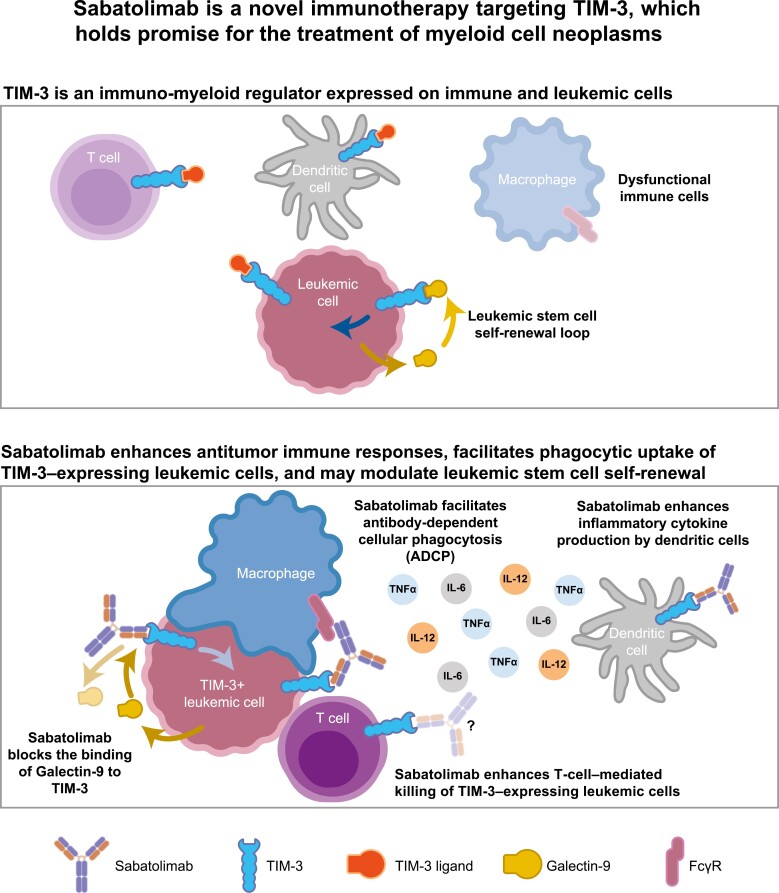
Objectives: Sabatolimab is a humanized monoclonal antibody (hIgG4, S228P) directed against human T-cell immunoglobulin domain and mucin domain-3 (TIM-3). Herein, we describe the development and characterization of sabatolimab.

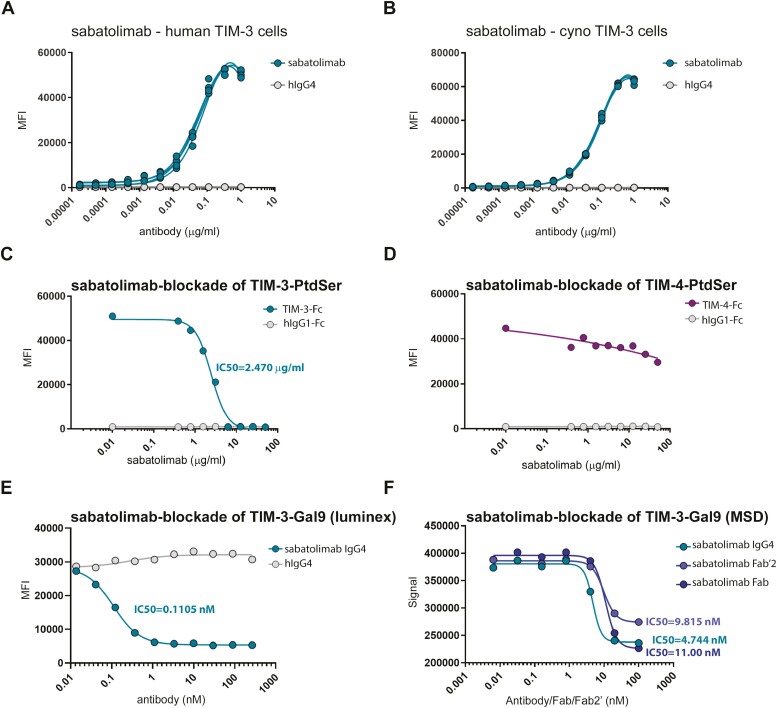
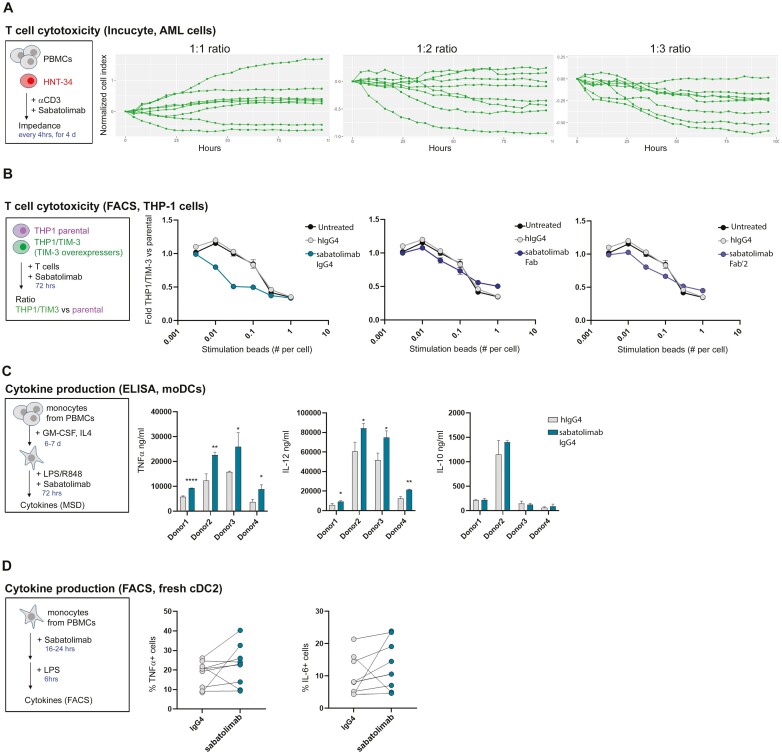
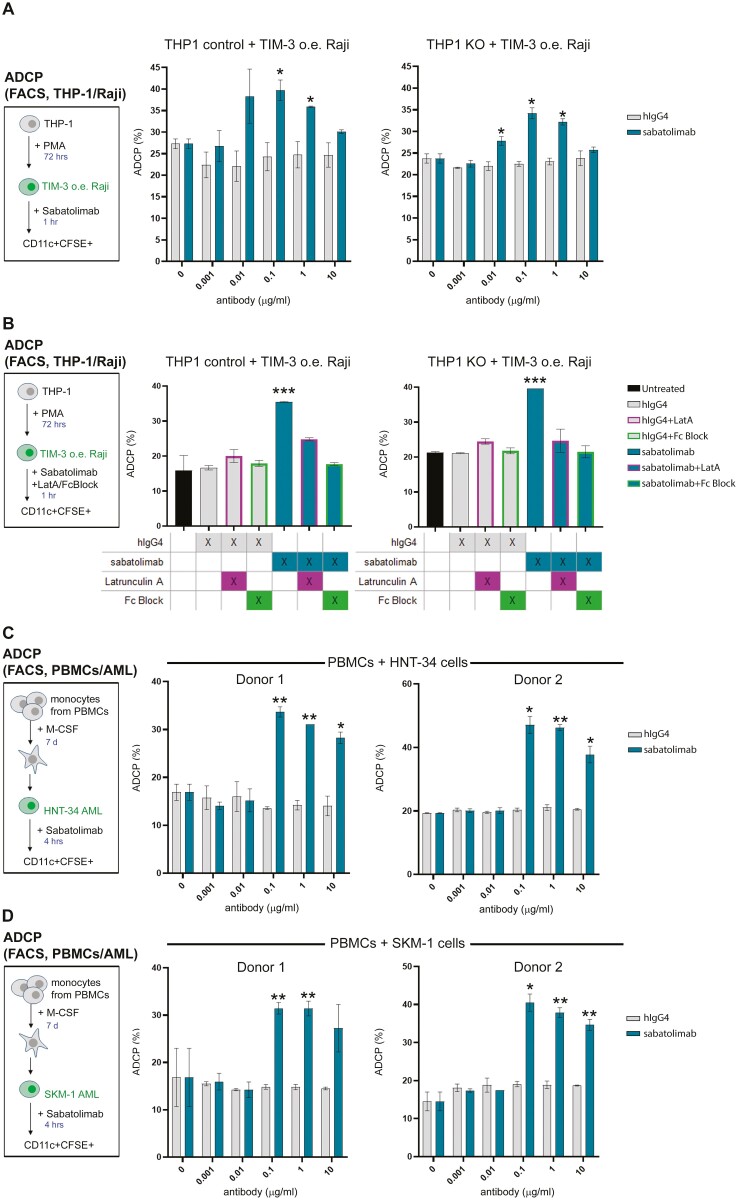
Methods: Sabatolimab was tested for binding to its target TIM-3 and blocking properties. The functional effects of sabatolimab were tested in T-cell killing and myeloid cell cytokine assays. Antibody-mediated cell phagocytosis (ADCP) by sabatolimab was also assessed.

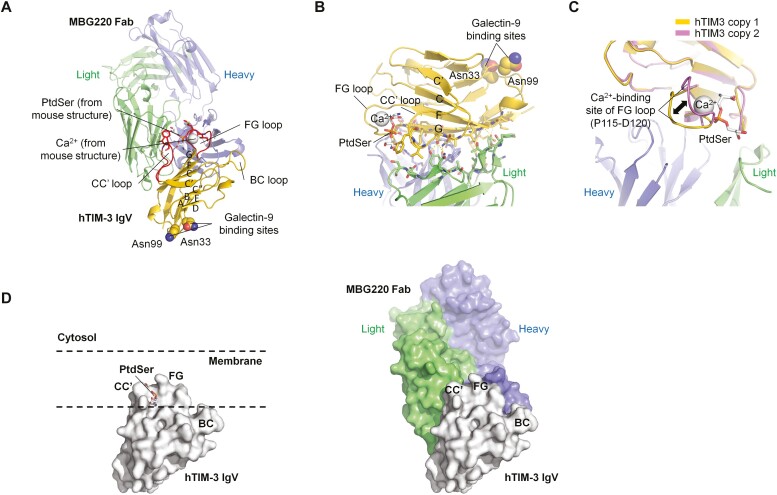
Results: Sabatolimab was shown to (i) enhance T-cell killing and inflammatory cytokine production by dendritic cells (DCs); (ii) facilitate the phagocytic uptake of TIM-3-expressing target cells; and (iii) block the interaction between TIM-3 and its ligands PtdSer/galectin-9.

Conclusion: Taken together, our results support both direct anti-leukemic effects and immune-mediated modulation by sabatolimab, reinforcing the notion that sabatolimab represents a novel immunotherapy with immuno-myeloid activity, holding promise for the treatment of myeloid cell neoplasms.


Figures

Graphical Abstract
Graphical Abstract
Figure 1.
Figure 1.
Blockade of TIM-3 ligand binding by sabatolimab. (A,B) Binding of sabatolimab to human and cyno TIM-3, as assessed by flow cytometric analysis on 300.19 cells engineered to express human or cyno TIM-3. (C) PtdSer exposure in the outer cell membrane leaflet was induced by staurosporine-mediated induction of apoptosis in human U937 monocytes and the ability of sabatolimab to block TIM-3 interaction with PtdSer was measured using flow cytometric analysis. Sabatolimab blocked the TIM-3-PtdSer interactions in a dose dependent manner. (D) In the same assay, sabatolimab did not block TIM-4:PtdSer interactions. (E,F) Sabatolimab showed a dose-dependent inhibition of TIM-3-galectin-9 interactions, as measured by luminex assay (E) or MSD (F).
Figure 2.
Figure 2.
Structure of MBG220 Fab binding to TIM-3. (A) Overall structure of MBG220 Fab binding to TIM-3. MBG220 binds to the GFCC’ side of TIM-3 IgV domain, close to the CC’ and FG loop responsible for ligand binding. PtdSer and Ca2+ ion are modeled from the mouse TIM-3 structure to indicate ligand binding pocket. The residues corresponding to the proposed galectin-9 binding in mouse TIM-3 (Asn33 and Asn99) are also labeled. (B) Close-up view of the MBG220-TIM-3 interface. The paratope and epitope residues are shown as sticks. (C) Close-up view of the Ca2+ binding loop of TIM-3. (D) Comparison of PtdSer-mediated membrane penetration of mouse TIM-3 (left panel) and binding of MBG220 to human TIM-3 (right panel). The two TIM-3 structures are oriented the same way.
Figure 3.
Figure 3.
Immunomodulatory properties of sabatolimab in vitro. (A) HNT-34 AML cells were cultured with anti-CD3-activated PBMCs and cell viability was determined using Incucyte technology as change in cell impedance over the course of 4 days. Lines represent changes in the normalized cell index over time between sabatolimab- and hIgG4 isotype-treated samples at the highlighted ratios of HNT-34 target cells and PBMCs. Each line represents a sample from eight different donors (average from two replicates per sample per time point). (B) THP-1/TIM-3-Flag and THP-1 parental cells were labeled with two different dyes and cultured together with activated T cells (stimulated by the indicated amount of anti-CD3/CD28 beads as shown on the x-axis) in the presence of the indicated antibodies/antibody fragments. Graphs represent the ratio between the number of THP-1/TIM-3-Flag and THP-1 parental cells after co-culture. One representative of more than three experiments is shown. (C) Induction of IL-12, TNFα, and IL-10 by sabatolimab treatment in DCs generated from four independent donors as measured by ELISA. (D) Induction of TNFα and IL-6 by freshly isolated peripheral blood-derived DCs stimulated with LPS, as measured by flow cytometric analysis. Graph represents the percentage of cells positive for the analyzed cytokine in each treatment conditions. Each dot represents one donor; lines connect data in different conditions from the same donor; eight donors were analyzed. TNFα, P = 0.2939; IL-6, P = 0.3281.
Figure 4.
Figure 4.
ADCP activity of sabatolimab in vitro. (A) THP-1 cells (TIM-3 sufficient, control, or TIM-3 deficient, KO) were cultured for 1 hour with Raji TIM-3 o.e. cells and treated with different concentrations of sabatolimab or hIgG4 isotype control in duplicates. ADCP was determined by flow cytometric analysis as % of CFSE+CD11c+ cells. Plots depict means ± SD for each condition. (B) THP-1 cells (TIM-3 sufficient, control, or TIM-3 deficient, KO) cultured as in A with with Raji hTIM-3 o.e. cells were treated with sabatolimab or hIgG4 isotype control, with Latrunculin A or Fc-blocking antibody added to some of the wells in duplicates. ADCP was determined by flow cytometric analysis as % of CFSE+CD11c+ cells. Plots depict means ± SD for each condition. (C,D) Macrophages differentiated from PBMC-isolated monocytes were cultured for 4 hours with CFSE-labeled leukemia cells (HNT-34, in C or SKM-1, in D) and treated with different concentrations of sabatolimab or hIgG4 isotype control in duplicates. ADCP was determined by flow cytometric analysis as % of CFSE+CD11c+ cells. Plots depict means ± SD for each condition. Two separate donors are shown for each cell line. Asterisks mark statistically significant P values between sabatolimab- and isotype control-treated samples (T test *P < 0.05, **P < 0.005, ***P < 0.001).

Similar articles

Cited by

References

    1. Acharya N, Sabatos-Peyton C, Anderson AC. Tim-3 finds its place in the cancer immunotherapy landscape. J Immunother Cancer 2020; 8(1):e000911. 10.1136/jitc-2020-000911 - DOI - PMC - PubMed
    1. Chiba S, Baghdadi M, Hisaya H, et al. . Tumor-infiltrating DCs suppress nucleic acid-mediated innate immune responses through interactions between the receptor TIM-3 and the alarmin HMGB1. Nat Immunol 2012; 13(9):832–42. 10.1038/ni.2376 - DOI - PMC - PubMed
    1. DeKruyff RH, Bu X, Ballesteros A, et al. . T cell/transmembrane, Ig, and mucin-3 allelic variants differentially recognize phosphatidylserine and mediate phagocytosis of apoptotic cells. J Immunol 2010; 184(4):1918–30. 10.4049/jimmunol.0903059 - DOI - PMC - PubMed
    1. Huang YH, Zhu C, Kondo Y, et al. . CEACAM1 regulates TIM-3-mediated tolerance and exhaustion. Nature, 2015; 517(7534):386–90. 10.1038/nature13848 - DOI - PMC - PubMed
    1. Zhu C, Anderson AC, Schubart A, et al. . The Tim-3 ligand galectin-9 negatively regulates T helper type 1 immunity. Nat Immunol 2005; 6(12):1245–52. 10.1038/ni1271 - DOI - PubMed

LinkOut - more resources