. 2022 Nov 1;149(21):dev200920.
doi: 10.1242/dev.200920. Epub 2022 Nov 7.

Specialized germline P-bodies are required to specify germ cell fate in Caenorhabditis elegans embryos

Affiliations

Specialized germline P-bodies are required to specify germ cell fate in Caenorhabditis elegans embryos

Madeline Cassani et al. Development. .

Abstract

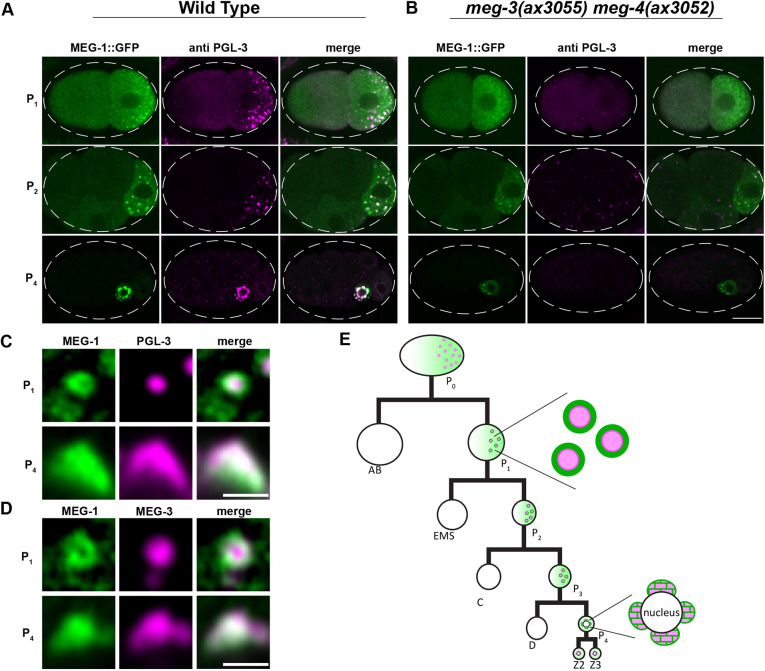
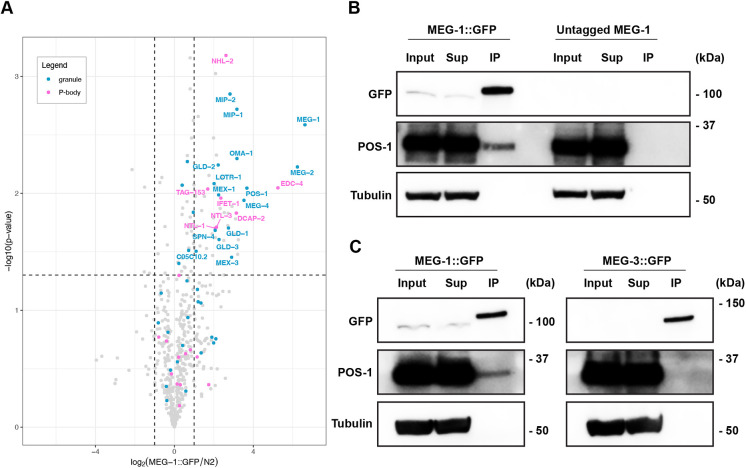
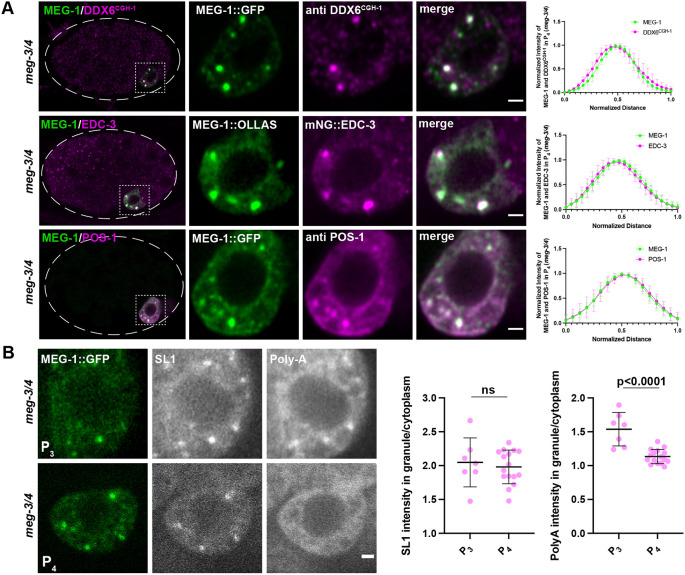
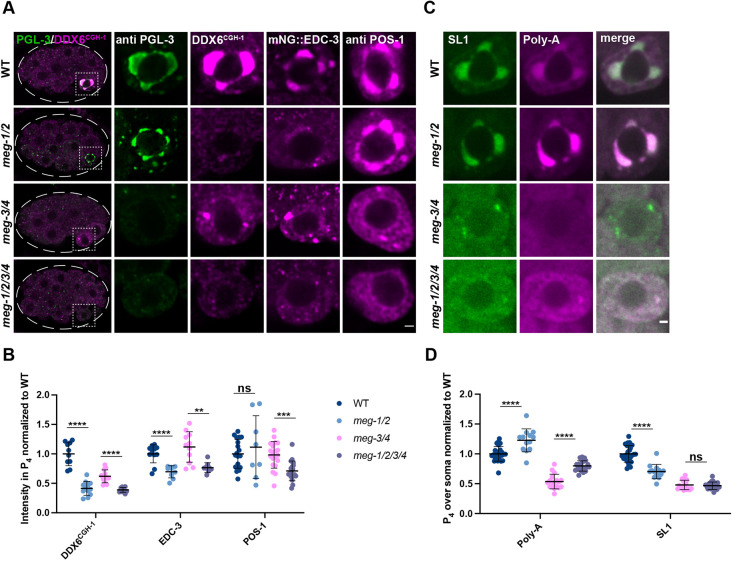
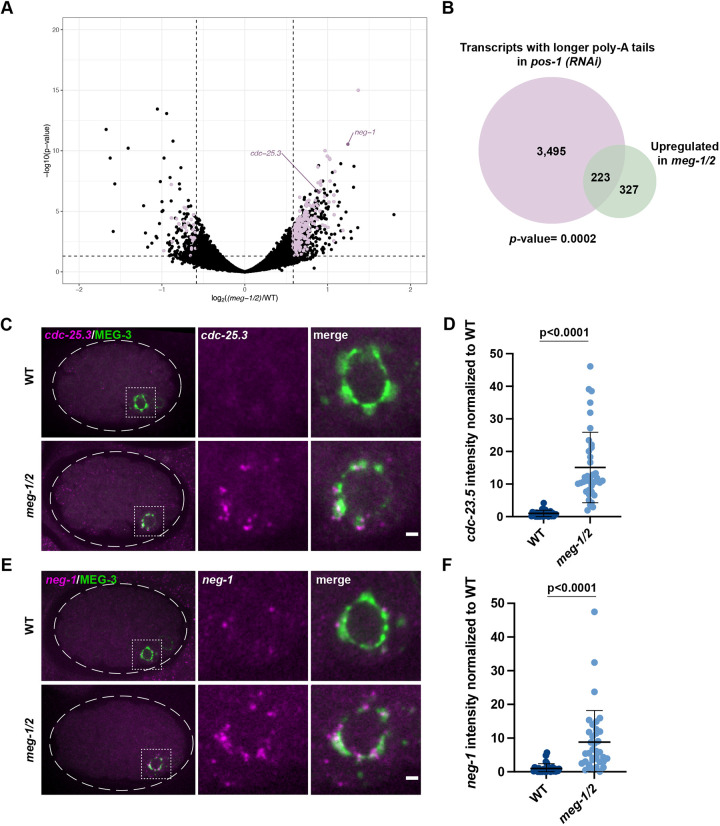
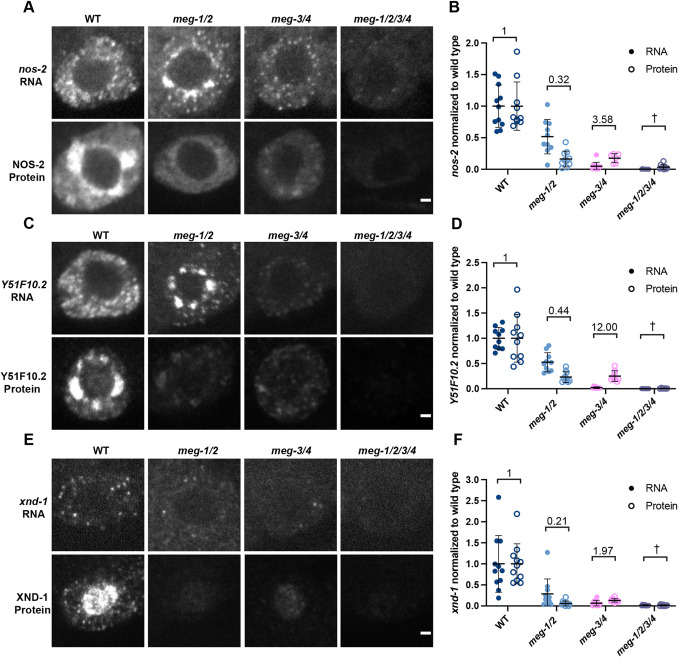
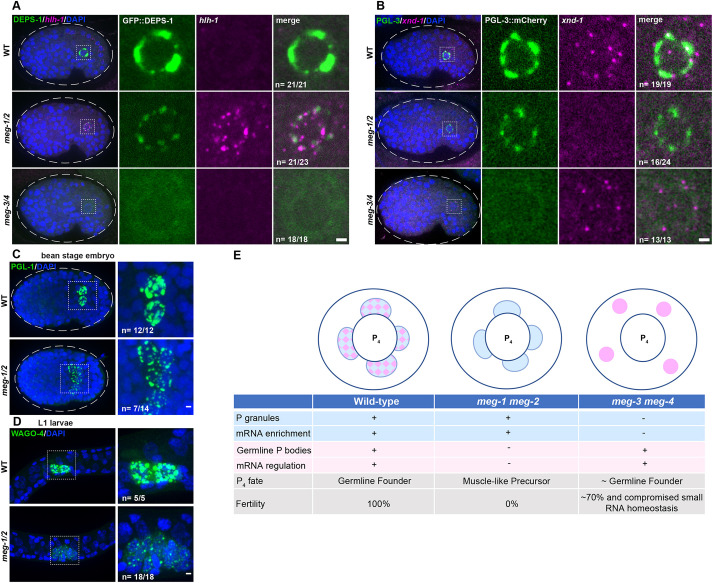
In animals with germ plasm, specification of the germline involves 'germ granules', cytoplasmic condensates that enrich maternal transcripts in the germline founder cells. In Caenorhabditis elegans embryos, P granules enrich maternal transcripts, but surprisingly P granules are not essential for germ cell fate specification. Here, we describe a second condensate in the C. elegans germ plasm. Like canonical P-bodies found in somatic cells, 'germline P-bodies' contain regulators of mRNA decapping and deadenylation and, in addition, the intrinsically-disordered proteins MEG-1 and MEG-2 and the TIS11-family RNA-binding protein POS-1. Embryos lacking meg-1 and meg-2 do not stabilize P-body components, misregulate POS-1 targets, mis-specify the germline founder cell and do not develop a germline. Our findings suggest that specification of the germ line involves at least two distinct condensates that independently enrich and regulate maternal mRNAs in the germline founder cells. This article has an associated 'The people behind the papers' interview.

Keywords: C. elegans; Germ plasm; Germline; P-bodies; Primordial germ cells; RNP granules.


Conflict of interest statement

Competing interests G.S. serves on the Scientific Advisory Board of Dewpoint Therapeutics. The remaining authors declare no competing interests.

Figures

Fig. 1.
Fig. 1.
MEG-1 puncta are distinct from P granules. (A,B) Representative Airyscan photomicrographs of wild-type (A) and meg-3 meg-4 mutant (B) embryos expressing endogenous MEG-1::GFP and co-stained for GFP and PGL-3. MEG-1, but not PGL-3, enriches in P blastomeres in meg-3 meg-4 embryos. Dashed white line indicates embryo boundary. (C,D) Higher resolution images of MEG-1::GFP and PGL-3 (C) and MEG-1::GFP and MEG-3::OLLAS (D) in P1 and P4. In P1, MEG-1 enriches at the periphery of PGL-3 and MEG-3. In P4, P granules become perinuclear and MEG-1 and PGL-3/MEG-3 overlap. See Fig. S1A for quantification. (E) Abbreviated cartoon lineage summarizing the distribution of MEG-1 (green) and P granules (pink) in the germline (P) blastomeres. In the zygote P0, MEG-1 is present in a cytoplasmic gradient as well as small granules that are difficult to visualize at this stage. MEG-1 enriches at the periphery of P granules in the P1-3 blastomeres, and merges with P granules in P4. In the primordial germ cells Z2 and Z3, MEG-1 becomes cytoplasmic and is degraded, while P granules remain. Scale bars: 10 µm (A,B); 1 µm (C,D).
Fig. 2.
Fig. 2.
MEG-1 immunoprecipitates with P-body and RNA-binding proteins, including POS-1. (A) Volcano plot showing on the x-axis the log2 fold enrichment of proteins (dots) in MEG-1::GFP immunoprecipitates over ‘N2’ (wild-type lysates containing untagged MEG-1) as a function of the log10 P-value calculated from two independent immunoprecipitation experiments (y-axis). Of the 54 proteins enriched in MEG-1::GFP immunoprecipitates (top right quadrant), 13% correspond to P-body proteins (labeled in pink) and 28% correspond to proteins previously reported to localize to granules in P blastomeres (blue). (B) Representative western blots from two independent experiments confirm that GFP immunoprecipitates pull down MEG-1::GFP and POS-1, but not tubulin. (C) Western blots from MEG-1::GFP and MEG-3::GFP immunoprecipitates. Unlike MEG-1::GFP, MEG-3::GFP does not pull down POS-1. Full western blot images are shown in Fig. S2.
Fig. 3.
Fig. 3.
MEG-1 puncta in P4 correspond to germline P-bodies. (A) Airyscan photomicrographs of meg-3 meg-4 embryos expressing MEG-1::GFP and co-stained for GFP and CGH-1 (DDX6CGH-1), expressing MEG-1::OLLAS and mNG::3×FLAG::EDC-3 and co-stained for OLLAS and FLAG, and expressing MEG-1::GFP and co-stained for GFP and POS-1. Dashed white line indicates embryo boundary. Dashed square indicates P4. Inset shows P4 blastomere. Graphs plotting the mean intensities through the center of a granule indicate colocalization. For MEG-1 and CGH-1 n=7 granules from two embryos; for MEG-1 and EDC-3 n=9 granules from two embryos; for MEG-1 and POS-1 n=10 granules from two embryos. (B) Photomicrographs of meg-3 meg-4 embryos expressing MEG-1::GFP and probed for SL1 and poly-A. MEG-1 foci enrich SL1 to similar levels in P3 and P4, but show higher enrichment of poly-A in P3 compared with P4. The ratio of SL1 or poly-A intensity in MEG-1 granules over cytoplasm in P3 (n=7) was compared with P4 (n=16). Significance calculated by unpaired two-tailed t-test. ns, not significant. Quantification for each genotype is from one experiment in which several mutant and control animals were processed in parallel. Data are mean±s.d. Scale bars: 1 µm.
Fig. 4.
Fig. 4.
MEG-1/2 are required for maintenance of germline P-bodies in P4. (A) Airyscan photomicrographs of embryos of the indicated meg genotypes co-stained for PGL-3 and CGH-1 (DDX6CGH-1) (whole embryo and P4 inset), or expressing mNG::3×FLAG::EDC-3 and stained for FLAG, or stained for POS-1. meg-1 meg-2 are not essential for localization of PGL-3 or POS-1 to P4 but are required for maintenance of CGH-1 and EDC-3. Dashed white line indicates embryo boundary. Dashed square indicates P4. (B) Intensity of CGH-1, EDC-3 and POS-1 in P4 relative to wild type. Quantification of CGH-1 for each genotype is from one experiment in which mutant and control animals were processed in parallel. Wild type n=10; meg-1/2 n=12; meg-3/4 n=12; meg-1/2/3/4 n=10. Quantification of EDC-3 for each genotype is from one experiment in which mutant and control animals were processed in parallel. Wild type n=12; meg-1/2 n=9; meg-3/4 n=11; meg-1/2/3/4 n=9. Quantification of POS-1 for meg-1 meg-2 embryos is from one experiment and for meg-3 meg-4 and meg-1 meg-2 meg-3 meg-4 from two experiments in which mutant and control animals were processed in parallel. Wild type n=19; meg-1/2 n=8; meg-3/4 n=20; meg-1/2/3/4 n=19. (C) Photomicrographs of P4 in the indicated genotypes probed for SL1 and poly-A. Poly-A levels are increased in meg-1 meg-2 mutants, despite SL1 levels decreasing or not changing. (D) Quantification of poly-A and SL1 in P4 over soma normalized to wild type. Quantification for meg-1 meg-2 embryos is from two experiments and for meg-3 meg-4 and meg-1 meg-2 meg-3 meg-4 from three experiments in which mutant and control animals were processed in parallel. Wild type n=26; meg-1/2 n=13; meg-3/4 n=17; meg-1/2/3/4 n=20. Data are mean±s.d. ****P≤0.0001; ***P≤0.001; **P≤0.01; ns, not significant (unpaired two-tailed t-test). Scale bars: 1 µm.
Fig. 5.
Fig. 5.
meg-1/2 are required for the turnover of a subset of POS-1 targets. (A) RNA-seq from two independent experiments comparing meg-1 meg-2 (RNAi) and wild-type embryos identified 230 downregulated and 550 upregulated genes (±1.5 fold change). Purple dots correspond to genes significantly down/upregulated in meg-1 meg-2 embryos that also exhibited longer poly-A tails in pos-1(RNAi) embryos (Elewa et al., 2015). (B) A total of 223 genes upregulated in meg-1 meg-2 embryos overlap with genes with poly-A tails extended in pos-1(RNAi) embryos. P=0.0002 (Fisher's exact test; Materials and Methods). (C,E) Photomicrographs of cdc-25.3 and neg-1 smFISH in embryos expressing the P granule marker MEG-3::GFP. Inset shows P4. cdc-25.3 and neg-1 are turned over less efficiently in meg-1 meg-2 P4 blastomeres. Dashed white line indicates embryo boundary. Dashed square indicates P4. (D,F) Intensity of cdc-25.3 and neg-1 in P4 normalized to wild type. In situs for cdc-25.3 and neg-1 were done in the same embryos in two independent experiments in which mutant and control animals were processed in parallel. Wild type n=29; meg-1/2 n=38. Data are mean±s.d. Unpaired two-tailed t-test was used to make comparisons between genotypes. Scale bars: 1 µm.
Fig. 6.
Fig. 6.
meg-1/2 are required for efficient translation of maternal mRNAs coding for germ cell fate determinants. (A,C,E) Photomicrographs of P4 in embryos of the indicated genotypes comparing nos-2, Y51F10.2 and xnd-1 RNA and protein levels. In all cases, the RNA is partially reduced in meg-1 meg-2 mutants, and significantly reduced in meg-3 meg-4 and meg-1 meg-2 meg-3 meg-4. In contrast, the protein levels of meg-1 meg-2 and meg-3 meg-4 are similar. In A and C, nos-2 and Y51F10.2 RNAs enrich in bright perinuclear puncta in meg-1 meg-2 mutants; however, the total RNA levels in P4 were lower. (B,D,F) Intensity of RNA and protein, normalized to wild type. The ratio of protein to RNA levels in each genotype is indicated. In meg-1 meg-2, the ratio is decreased, while in meg-3 meg-4 it is increased. Due to the very low levels of RNA present in meg-1 meg-2 meg-3 meg-4 embryos we were unable to calculate the protein/RNA ratio (†). Quantification for each genotype is from one experiment in which mutant and control animals were processed in parallel. For nos-2 RNA: wild type n=11, meg-1/2 n=10, meg-3/4 n=12, meg-1/2/3/4 n=12. For NOS-2 protein: wild type n=10, meg-1/2 n=10, meg-3/4 n=6, meg-1/2/3/4 n=9. For Y51F10.2 RNA: wild type n=10, meg-1/2 n=10, meg-3/4 n=10, meg-1/2/3/4 n=9. For Y51F10.2 protein: wild type n=10, meg-1/2 n=10, meg-3/4 n=9, meg-1/2/3/4 n=6. For xnd-1 RNA: wild type n=11, meg-1/2 n=11, meg-3/4 n=10, meg-1/2/3/4 n=10. For XND-1 protein: wild type n=11, meg-1/2 n=11, meg-3/4 n=10, meg-1/2/3/4 n=11. Data are mean±s.d. Scale bars: 1 µm.
Fig. 7.
Fig. 7.
Primordial germ cells exhibit somatic-like characteristics in meg-1 meg-2 mutants. (A) Photomicrographs of bean-stage embryos of the indicated genotypes expressing DEPS-1::GFP and probed for hlh-1 RNA. Inset depicts a primordial germ cell. Embryos were scored from one independent experiment in which mutant and control animals were processed in parallel. All wild-type (21/21) and meg-3 meg-4 (18/18) bean-to-comma-stage embryos did not express hlh-1, while 21/23 meg-1 meg-2 did express hlh-1. (B) Photomicrographs of bean-stage embryos of the indicated genotypes expressing PGL-3::mCherry and probed for xnd-1 RNA (which is transcribed in PGCs at this stage). Inset depicts a primordial germ cell. Embryos were scored from two independent experiments for meg-1 meg-2 and one experiment for meg-3 meg-4 in which mutant and control animals were processed in parallel. All wild-type (19/19) and meg-3 meg-4 (13/13) bean-stage embryos expressed xnd-1, while 16/24 meg-1 meg-2 embryos did not express xnd-1. (C) Maximum projections of bean-stage embryos of the indicated genotypes stained for PGL-1. Inset shows the primordial germ cells. Embryos were scored from one experiment in which mutant and control animals were processed in parallel. All wild-type embryos (12/12) had two PGL-1-positive cells and 7/14 meg-1 meg-2 embryos had more than two PGL-1-positive cells. Dashed white line indicates embryo boundary. Dashed square indicates P4 descendants. (D) Maximum projections of germ cells from unfed L1 larvae expressing the germ granule marker 3×FLAG::GFP::WAGO-4. Embryos were scored from one experiment in which mutant and control animals were processed in parallel. All wild-type embryos (5/5) had two WAGO-4-positive cells and all meg-1 meg-2 embryos (18/18) had more than two WAGO-4-positive cells. (E) Working model: schematic and table summarizing P4 phenotypes based on this study and on Wang et al. (2014) and Ouyang et al. (2019). P granules are depicted in blue, germline P-body in pink and their merge in a checkered pattern. Note that P granule and germline P-body proteins also exist in a more dilute state in the cytoplasm. See text for additional details. Scale bars: 1 µm.

References

    1. Alessi, A. F., Khivansara, V., Han, T., Freeberg, M. A., Moresco, J. J., Tu, P. G., Montoye, E., Yates, J. R., III, Karp, X. and Kim, J. K. (2015). Casein kinase II promotes target silencing by miRISC through direct phosphorylation of the DEAD-box RNA helicase CGH-1. Proc. Natl. Acad. Sci. USA 112, E7213-E7222. 10.1073/pnas.1509499112 - DOI - PMC - PubMed
    1. Anders, S., Pyl, P. T. and Huber, W. (2015). HTSeq–a Python framework to work with high-throughput sequencing data. Bioinformatics 31, 166-169. 10.1093/bioinformatics/btu638 - DOI - PMC - PubMed
    1. Aravin, A. A., Van Der Heijden, G. W., Castañeda, J., Vagin, V. V., Hannon, G. J. and Bortvin, A. (2009). Cytoplasmic compartmentalization of the fetal piRNA pathway in mice. PLoS Genet. 5, e1000764. 10.1371/journal.pgen.1000764 - DOI - PMC - PubMed
    1. Arkov, A. L. and Ramos, A. (2010). Building RNA-protein granules: insight from the germline. Trends Cell Biol. 20, 482-490. 10.1016/j.tcb.2010.05.004 - DOI - PMC - PubMed
    1. Barbee, S. A. and Evans, T. C. (2006). The Sm proteins regulate germ cell specification during early C. elegans embryogenesis. Dev. Biol. 291, 132-143. 10.1016/j.ydbio.2005.12.011 - DOI - PubMed

Publication types

MeSH terms

Substances