

Machine learning classification reveals robust morphometric biomarker of glial and neuronal arbors
- PMID: 36196621
- PMCID: PMC9828050
- DOI: 10.1002/jnr.25131
Machine learning classification reveals robust morphometric biomarker of glial and neuronal arbors
Abstract
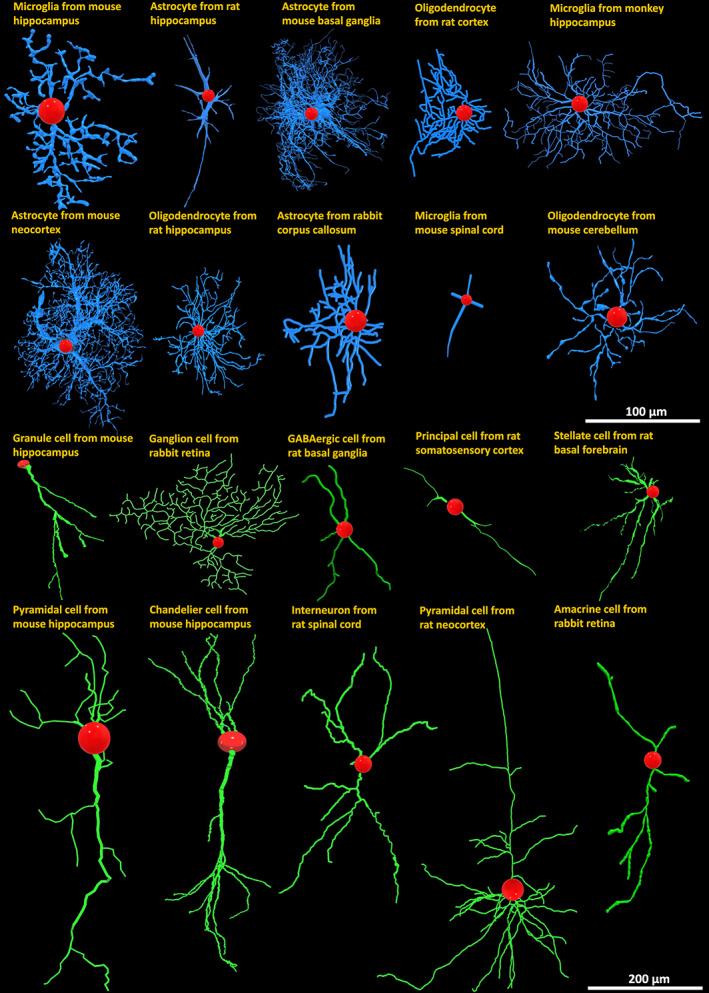
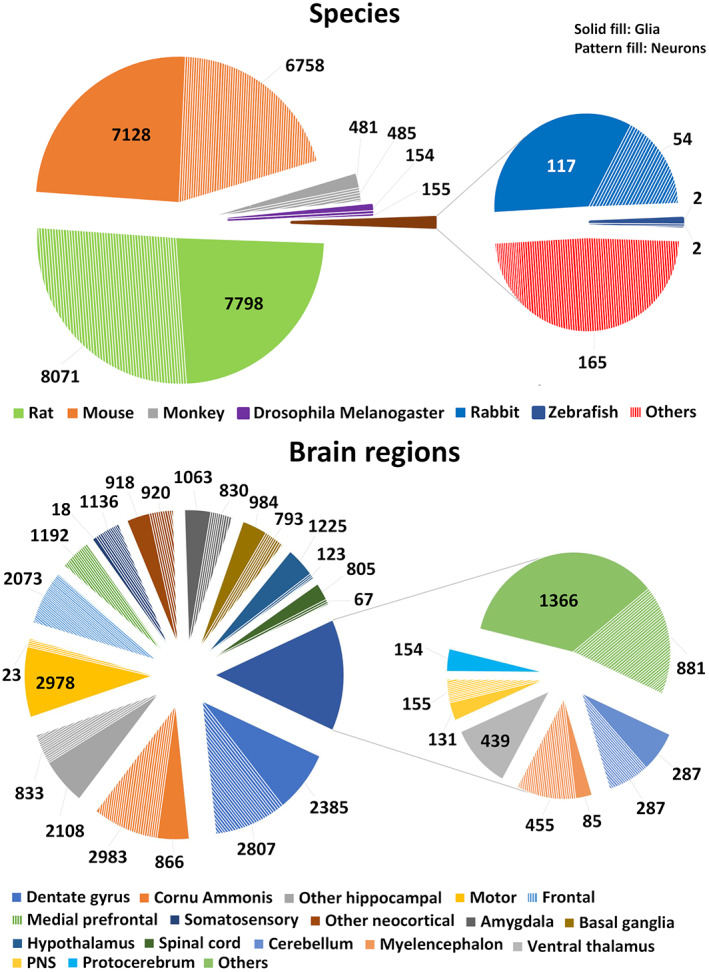
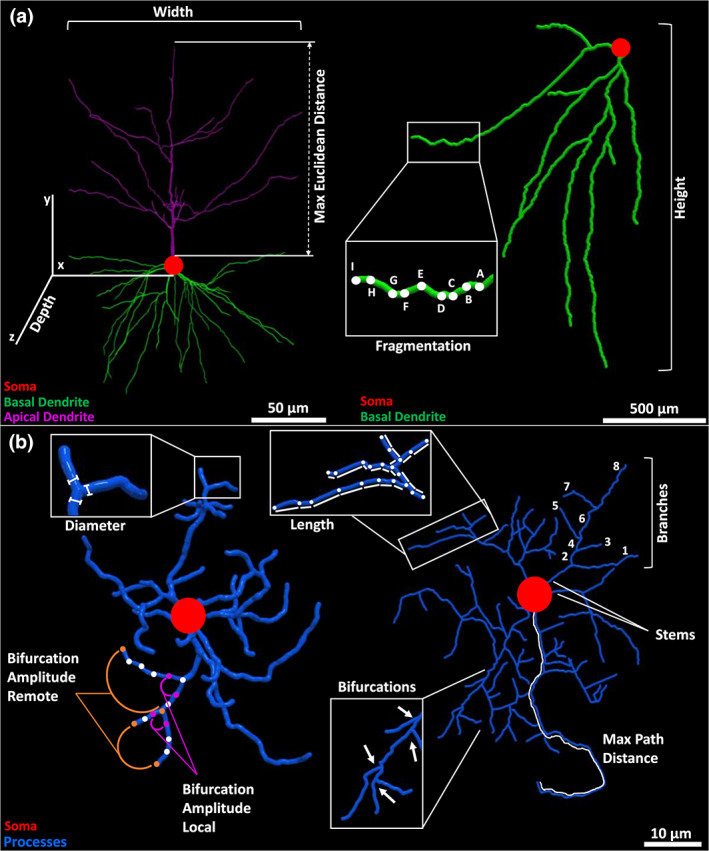
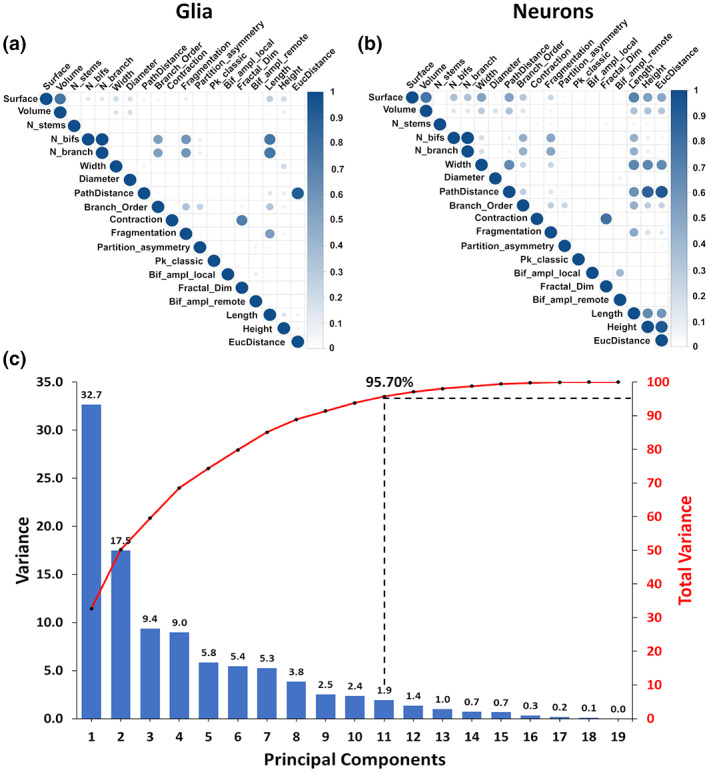
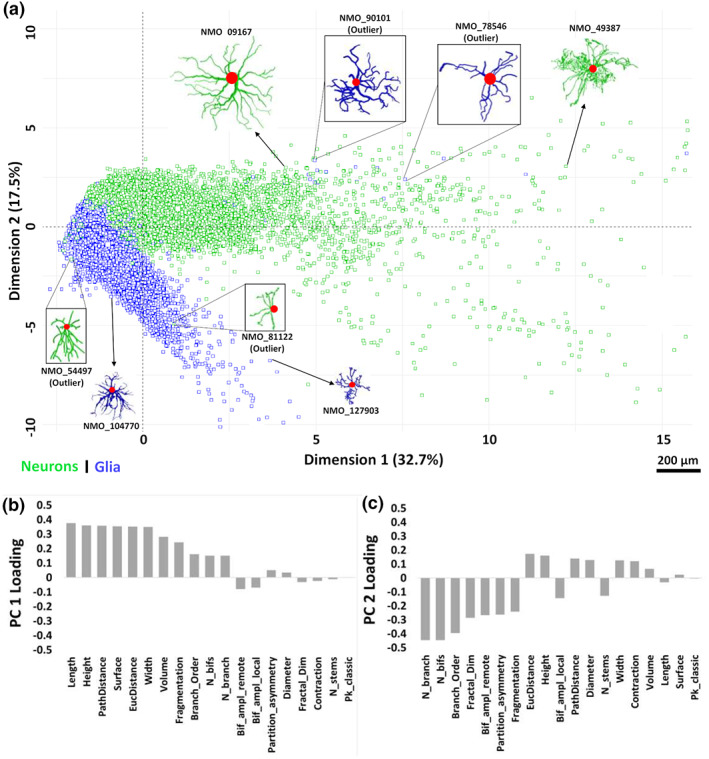
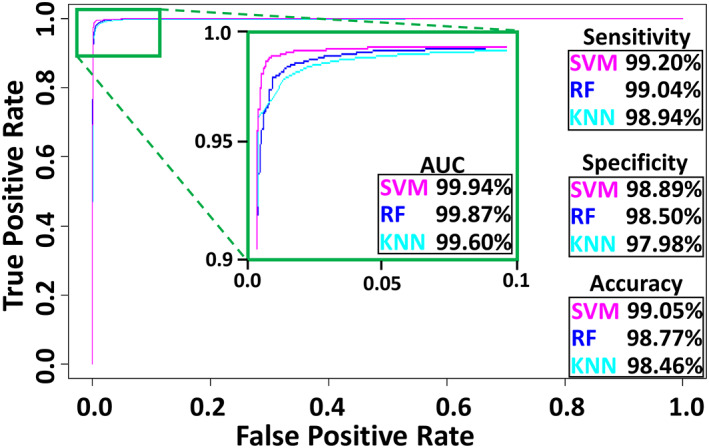
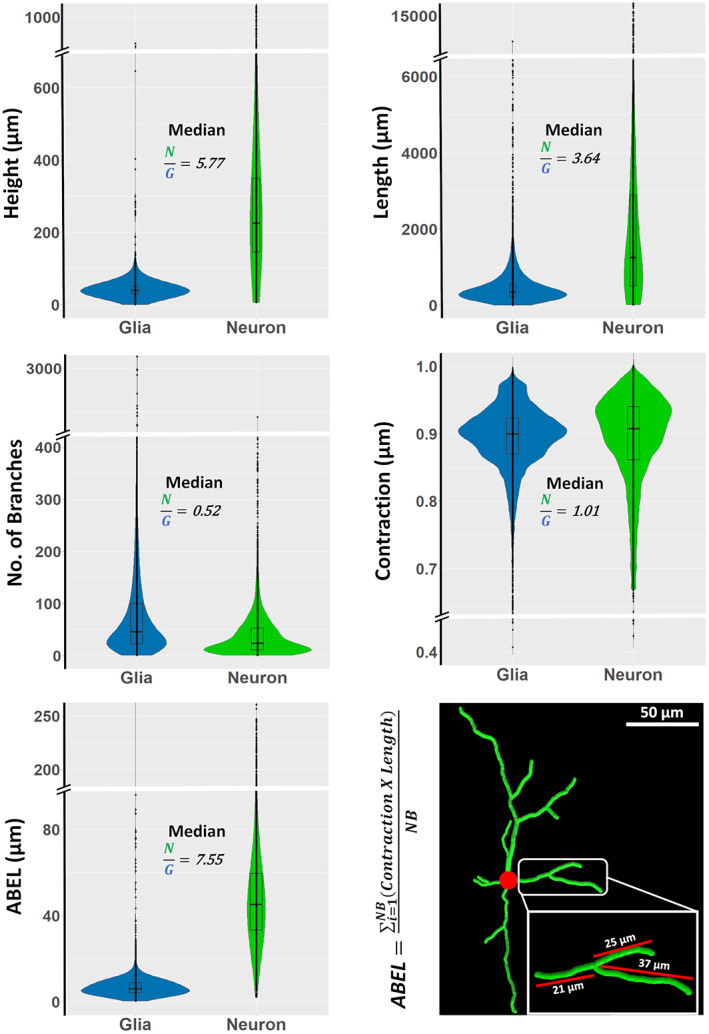
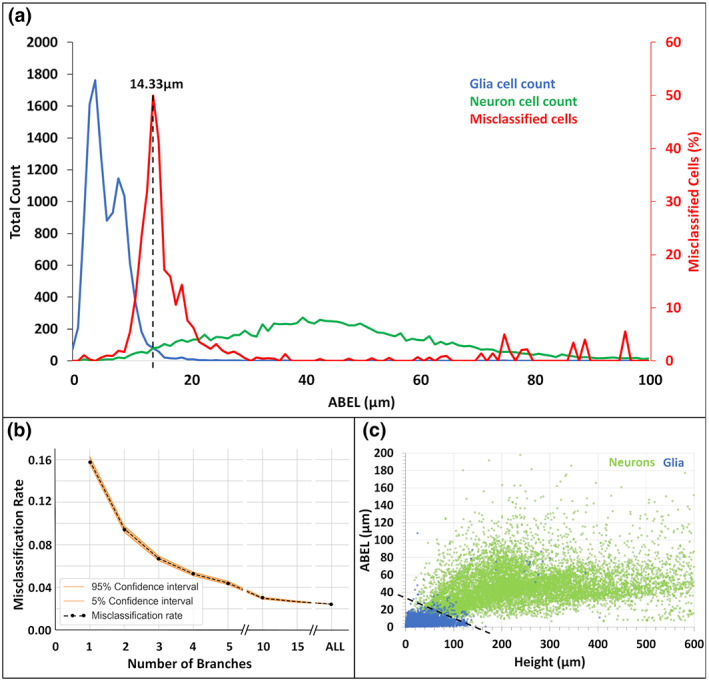
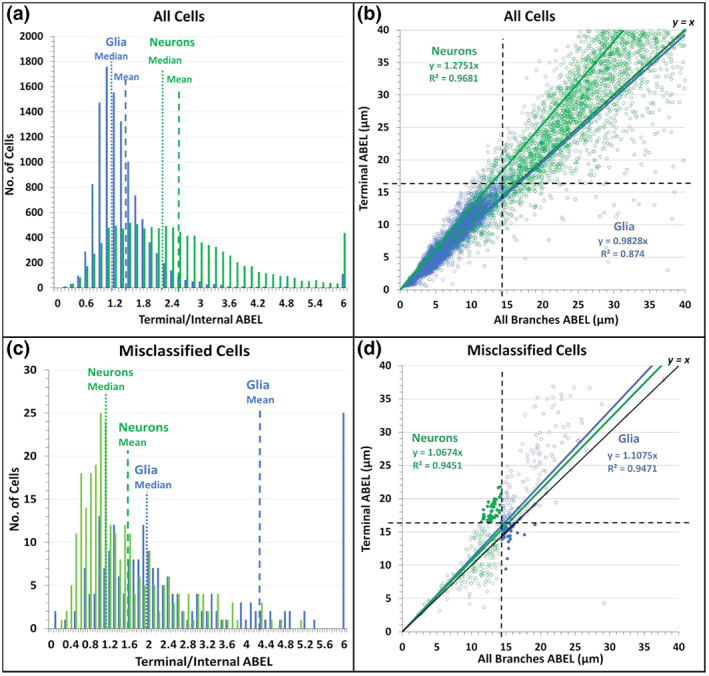
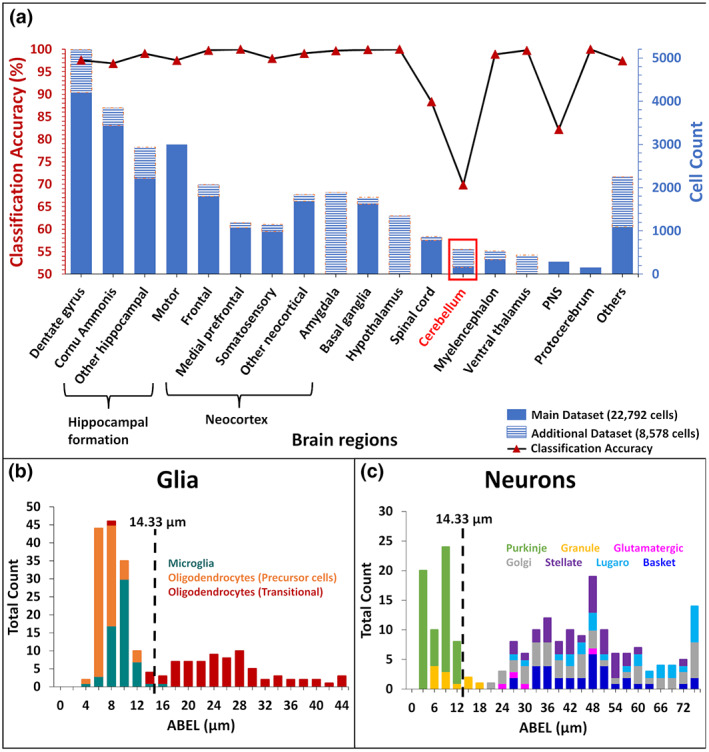
Neurons and glia are the two main cell classes in the nervous systems of most animals. Although functionally distinct, neurons and glia are both characterized by multiple branching arbors stemming from the cell bodies. Glial processes are generally known to form smaller trees than neuronal dendrites. However, the full extent of morphological differences between neurons and glia in multiple species and brain regions has not yet been characterized, nor is it known whether these cells can be reliably distinguished based on geometric features alone. Here, we show that multiple supervised learning algorithms deployed on a large database of morphological reconstructions can systematically classify neuronal and glial arbors with nearly perfect accuracy and precision. Moreover, we report multiple morphometric properties, both size related and size independent, that differ substantially between these cell types. In particular, we newly identify an individual morphometric measurement, Average Branch Euclidean Length that can robustly separate neurons from glia across multiple animal models, a broad diversity of experimental conditions, and anatomical areas, with the notable exception of the cerebellum. We discuss the practical utility and physiological interpretation of this discovery.
Keywords: K-nearest neighbor; NeuroMorpho.Org; branch length; cellular identity; morphology; neuroinformatics; random forest; supervised learning; support vector machine; tree size.
© 2022 The Authors. Journal of Neuroscience Research published by Wiley Periodicals LLC.
Conflict of interest statement
The authors declare no conflict of interest.
Figures
Similar articles
-
Cell morphologies in the nervous system: Glia steal the limelight.J Comp Neurol. 2023 Feb;531(3):338-343. doi: 10.1002/cne.25429. Epub 2022 Oct 31. J Comp Neurol. 2023. PMID: 36316800 Free PMC article.
-
Statistical analysis and data mining of digital reconstructions of dendritic morphologies.Front Neuroanat. 2014 Dec 4;8:138. doi: 10.3389/fnana.2014.00138. eCollection 2014. Front Neuroanat. 2014. PMID: 25538569 Free PMC article.
-
Objective Supervised Machine Learning-Based Classification and Inference of Biological Neuronal Networks.Molecules. 2022 Sep 23;27(19):6256. doi: 10.3390/molecules27196256. Molecules. 2022. PMID: 36234792 Free PMC article.
-
Quantitative investigations of axonal and dendritic arbors: development, structure, function, and pathology.Neuroscientist. 2015 Jun;21(3):241-54. doi: 10.1177/1073858414540216. Epub 2014 Jun 27. Neuroscientist. 2015. PMID: 24972604 Free PMC article. Review.
-
Not all brains are made the same: new views on brain scaling in evolution.Brain Behav Evol. 2011;78(1):22-36. doi: 10.1159/000327318. Epub 2011 Jun 17. Brain Behav Evol. 2011. PMID: 21691045 Review.
Cited by
-
Automatic identification of scientific publications describing digital reconstructions of neural morphology.Brain Inform. 2023 Sep 8;10(1):23. doi: 10.1186/s40708-023-00202-x. Brain Inform. 2023. PMID: 37684527 Free PMC article.
-
Cell morphologies in the nervous system: Glia steal the limelight.J Comp Neurol. 2023 Feb;531(3):338-343. doi: 10.1002/cne.25429. Epub 2022 Oct 31. J Comp Neurol. 2023. PMID: 36316800 Free PMC article.
-
Accelerating the continuous community sharing of digital neuromorphology data.FASEB Bioadv. 2024 Jun 17;6(7):207-221. doi: 10.1096/fba.2024-00048. eCollection 2024 Jul. FASEB Bioadv. 2024. PMID: 38974113 Free PMC article.
-
Circuit analysis of the Drosophila brain using connectivity-based neuronal classification reveals organization of key communication pathways.Netw Neurosci. 2023 Jan 1;7(1):269-298. doi: 10.1162/netn_a_00283. eCollection 2023. Netw Neurosci. 2023. PMID: 37339321 Free PMC article.
References
-
- Abdi, H. , & Williams, L. J. (2010). Principal component analysis: Principal component analysis. Wiley Interdisciplinary Reviews: Computational Statistics, 2(4), 433–459. 10.1002/wics.101 - DOI
-
- Aha, D. W. , Kibler, D. , & Albert, M. K. (1991). Instance‐based learning algorithms. Machine Learning, 6(1), 37–66. 10.1007/BF00153759 - DOI
Publication types
MeSH terms
Substances
Grants and funding
LinkOut - more resources
Full Text Sources
