. 2022 Nov 1;15(11):dmm049516.
doi: 10.1242/dmm.049516. Epub 2022 Oct 31.

DUX4 expression activates JNK and p38 MAP kinases in myoblasts

Affiliations

DUX4 expression activates JNK and p38 MAP kinases in myoblasts

Christopher M Brennan et al. Dis Model Mech. .

Abstract

Facioscapulohumeral muscular dystrophy (FSHD) is caused by misexpression of the DUX4 transcription factor in skeletal muscle that results in transcriptional alterations, abnormal phenotypes and cell death. To gain insight into the kinetics of DUX4-induced stresses, we activated DUX4 expression in myoblasts and performed longitudinal RNA sequencing paired with proteomics and phosphoproteomics. This analysis revealed changes in cellular physiology upon DUX4 activation, including DNA damage and altered mRNA splicing. Phosphoproteomic analysis uncovered rapid widespread changes in protein phosphorylation following DUX4 induction, indicating that alterations in kinase signaling might play a role in DUX4-mediated stress and cell death. Indeed, we demonstrate that two stress-responsive MAP kinase pathways, JNK and p38, are activated in response to DUX4 expression. Inhibition of each of these pathways ameliorated DUX4-mediated cell death in myoblasts. These findings uncover that the JNK pathway is involved in DUX4-mediated cell death and provide additional insights into the role of the p38 pathway, a clinical target for the treatment of FSHD.

Keywords: MAP kinase signaling; Muscular dystrophy; Phosphoproteomics.


Conflict of interest statement

Competing interests At the time that these studies were performed, C.M.B., A.S.H., M.S.A., X.L., V.M., S.G., L.X., T.G., A.H., M.M., R.M., J.O., and N.C. were all Pfizer employees and declare potential conflicts of interest due to income received from their employment.

Figures
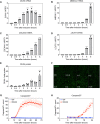
Fig. 1.
Fig. 1.
Determining the kinetics of DUX4 induction in iDUX4 myoblasts. In all panels, DUX4 expression in MB135 iDUX4 myoblasts was induced with 1 µg/ml doxycycline and analysis was performed at the indicated timepoints. (A-D) mRNA expression of DUX4 (A), MBD3L2 (B), ZSCAN4 (C) and LEUTX (D) was measured using ddPCR and normalized to HPRT1 expression. (E) DUX4 protein levels were analyzed using capillary-based western blotting and normalized to total protein levels. For A-E, error bars represent s.d. (n=3). *P<0.05; ***P<0.001; ****P<0.0001; one-way ANOVA with Dunnett's multiple comparisons for each timepoint compared to t=0. (F) Cells were fixed with paraformaldehyde at the indicated timepoints (in hours) and stained for DUX4. (G,H) The Caspase3/7 Dye was added simultaneously upon DUX4 induction. Cells were monitored by live-cell imaging and quantified by counting the number of cells positive for the Caspase 3/7 Dye per well. The entire 72 h time course is plotted in G and the first 24 h are shown in H. Error bars represent 95% confidence intervals. n=4.
Fig. 2.
Fig. 2.
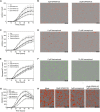
RNAseq and proteomics following DUX4 expression. (A-C) DUX4 expression was induced in MB135 iDUX4 myoblasts as in Fig. 1 and RNA was harvested 2 h (A), 6 h (B) and 14 h (C) after DUX4 induction for sequencing. RNAseq was also performed with iDUX4 myoblasts treated with an equivalent amount of DMSO for 14 h, which served as a reference for all timepoints. In many cases, genes that were upregulated upon DUX4 induction were undetected or very lowly expressed in uninduced cells; the voom transformation uses a pseudo count to allow for quantification resulting in genes with a normalized counts per million (CPM) value <1 in the uninduced samples (green dots) forming a distinct cluster compared to genes that were more highly expressed in the uninduced reference (purple dots). Each dot represents a gene (n=22,527). Data represent four biological replicates per condition. (D-F) DUX4 expression was induced as above and cell lysates were harvested 2 h (D), 6 h (E) and 14 h (F) after DUX4 induction. Samples were labeled for TMT proteomics and quantified by MS. iDUX4 myoblasts treated with an equivalent amount of DMSO for 14 h served as a reference for all timepoints. Proteins are colored according to their abundance in the reference sample. Each dot represents a unique protein (n=4098). Data represent three biological replicates per condition for iDUX4 samples and two biological replicates per condition for WT samples.
Fig. 3.
Fig. 3.
Determination of kinetics of DUX4-mediated phenotypes. (A-E) DUX4 expression in iDUX4 and WT myoblasts was induced as in Fig. 1. Cells were fixed at the indicated timepoints and stained for DUX4 and γH2A.X. (A) Representative image of WT and iDUX4 myoblasts induced for 24 h. (B-E) Quantification of the number of γH2A.X foci per nucleus 2 h (B), 6 h (C), 14 h (D) and 24 h (E) post DUX4 induction. The first four bars are quantifications of all nuclei in each group. The last two bars are iDUX4 myoblasts that were separated based on DUX4 expression. nd, not detected. (F,G) Percentage of RNAseq reads mapping to intergenic (F) and intronic (G) regions of the genome in uninduced and doxycycline-induced iDUX4 myoblasts. Error bars indicate s.d. n=4. ns, not significant; **P<0.01; ***P<0.001; ****P<0.0001; one-way ANOVA with Dunnett's multiple comparisons.
Fig. 4.
Fig. 4.
DUX4 induces changes in splice isoforms. (A-C) Quantification of all LSVs (A), exon-skipping events (B) and intron inclusion events (C) using MAJIQ for splice variation analysis of RNAseq data from iDUX4 myoblasts induced for 2, 6 and 14 h relative to uninduced iDUX4 myoblasts or from WT myoblasts induced for 14 h relative to uninduced WT myoblasts. LSVs were counted if they changed by 20% or more compared to the reference with 95% confidence. Red bars in B,C indicate increases in exon skipping or intron inclusion and green bars indicate decreases relative to the reference. (D,E) VOILA visualizations of examples of changes in splicing in iDUX4-induced myoblasts (bottom) compared to uninduced cells (top). Splice junctions are indicated by curved lines: red, annotated in Ensembl reference transcriptome; green, unannotated but detected in RNAseq data; dashed, undetected in the condition shown.
Fig. 5.
Fig. 5.
DUX4 modulates protein phosphorylation. (A) The phosphoproteome was quantified at the peptide level by TMT mass spectrometry and represented as a dot plot. Each phosphopeptide was normalized to total protein levels from MS (Fig. 2) to account for changes in protein levels. Each dot represents a peptide (n=4993) plotted as a function of its log2[fold change (FC)] relative to the reference. DMSO-treated iDUX4 myoblasts served as a reference for doxycycline-treated iDUX4 samples, and DMSO-treated WT myoblasts served as a reference for doxycycline-treated WT samples. Some examples of peptides with increased phosphorylation are labeled. (B,C) Examples of proteins with multiple peptides displaying increased phosphorylation on the indicated sites as determined by MS.
Fig. 6.
Fig. 6.
DUX4 expression activates JNK and p38. (A) Diagram of relevant components of the JNK and p38 MAPK signaling pathways. Multiple MAP3Ks (MAPKKK) can transmit signals from stress and other external cues to MAP2Ks. MKK7 and MKK4 are listed to illustrate cross talk between JNK and p38 signaling, although other MAP2Ks can signal through p38. Gray arrows indicate phosphorylation events. Bold text indicates proteins that we identified by proteomics. (B) Phosphorylation levels of Jun peptides as measured by MS following induction of DUX4 relative to the uninduced controls. Measurements are normalized to total protein as in Fig. 5. (C-H) Capillary-based western blotting (C,E,G) and quantification (D,F,H) of components of the JNK (C-F) and p38 (G,H) pathways in MB135 iDUX4 myoblasts. All protein levels were first normalized to vinculin levels to control for loading, then the phosphorylated proteins were normalized to their corresponding total protein to control for any changes in protein levels. Phosphorylated HSP27 was normalized to vinculin only because a commercially available antibody failed to detect total HSP27. Phosphorylation sites (C) and isoforms detected (E) are indicated in parentheses. Error bars represent s.d. n=2, ns, not significant; *P<0.05; **P<0.01; one-way ANOVA with Dunnett's multiple comparisons. (I,J) Capillary-based western blotting (I) and quantification (J) of p38 phosphorylation in gastrocnemius from ACTA1-MCM/+ (MCM/+) and ACTA1-MCM; FLExDUX4 (MCM; FLExDUX4) mice injected with 5 mg/kg tamoxifen and analyzed 9 days post injection. Normalization and quantification were performed as in D,F,H. Error bars represent s.d. n=3. *P<0.05; unpaired two-tailed t-test.
Fig. 7.
Fig. 7.
JNK and p38 inhibition rescues DUX4-mediated cell death. (A) DUX4 expression was induced in iDUX4 myoblasts as in Fig. 1 and cells were treated with SP600125 or vehicle and Incucyte Cytotox Dye simultaneously upon doxycycline (dox) addition. All cells received equivalent amounts of DMSO. Cells were imaged every 2 h and analyzed for dye staining. The number of cells positive for the Cytotox Dye were calculated at each timepoint. Closed symbols represent cells that received doxycycline and open circles indicate cells that did not receive doxycycline. Error bars represent 95% confidence intervals where non overlapping error bars are significantly different (P<0.05). n=8. (B) Representative images of induced iDUX4 myoblasts after 60 h either untreated (left) or treated with 25 µM SP6000125. Red spots are Cytotox-positive cells. (C-F) Live-cell imaging was performed as in A,B and cells were treated with losmapimod or vehicle and stained for either Incucyte Cytotox Dye (C,D) or Incucyte Caspase 3/7 Dye (E,F). Error bars represent 95% confidence intervals where non overlapping error bars are significantly different (P<0.05). n=8. Representative images of Cytotox-stained cells after 60 h (D) and Caspase 3/7 Dye-stained cells after 48 h (F). (G,H) Live-cell imaging was performed as in A,B and cells were treated with vehicle, SP600125, losmapimod, or both SP600125 and losmapimod. Error bars represent 95% confidence intervals where non overlapping error bars are significantly different (P<0.05). n=8. (H) Representative images of Cytotox-stained cells after 36 h.

References

    1. Anders, S. and Huber, W. (2010). Differential expression analysis for sequence count data. Genome Biol. 11, R106. 10.1186/gb-2010-11-10-r106 - DOI - PMC - PubMed
    1. Bennett, B. L., Sasaki, D. T., Murray, B. W., O'Leary, E. C., Sakata, S. T., Xu, W., Leisten, J. C., Motiwala, A., Pierce, S., Satoh, Y.et al. (2001). SP600125, an anthrapyrazolone inhibitor of Jun N-terminal kinase. Proc. Natl. Acad. Sci. USA 98, 13681-13686. 10.1073/pnas.251194298 - DOI - PMC - PubMed
    1. Bogoyevitch, M. A., Boehm, I., Oakley, A., Ketterman, A. J. and Barr, R. K. (2004). Targeting the JNK MAPK cascade for inhibition: basic science and therapeutic potential. Biochim. Biophys. Acta Proteins Proteom. 1697, 89-101. 10.1016/j.bbapap.2003.11.016 - DOI - PubMed
    1. Boppart, M. D., Aronson, D., Gibson, L., Roubenoff, R., Abad, L. W., Bean, J., Goodyear, L. J. and Fielding, R. A. (1999). Eccentric exercise markedly increases c-Jun NH2-terminal kinase activity in human skeletal muscle. J. Appl. Physiol. 87, 1668-1673. 10.1152/jappl.1999.87.5.1668 - DOI - PubMed
    1. Bosnakovski, D., Chan, S. S. K., Recht, O. O., Hartweck, L. M., Gustafson, C. J., Athman, L. L., Lowe, D. A. and Kyba, M. (2017). Muscle pathology from stochastic low level DUX4 expression in an FSHD mouse model. Nat. Commun. 8, 550. 10.1038/s41467-017-00730-1 - DOI - PMC - PubMed

Publication types

MeSH terms

Substances