. 2023 Jan;21(1):202-218.
doi: 10.1111/pbi.13938. Epub 2022 Oct 21.

Time-ordering japonica/geng genomes analysis indicates the importance of large structural variants in rice breeding

Affiliations

Time-ordering japonica/geng genomes analysis indicates the importance of large structural variants in rice breeding

Yu Wang et al. Plant Biotechnol J. 2023 Jan.

Abstract

Temperate japonica/geng (GJ) rice yield has significantly improved due to intensive breeding efforts, dramatically enhancing global food security. However, little is known about the underlying genomic structural variations (SVs) responsible for this improvement. We compared 58 long-read assemblies comprising cultivated and wild rice species in the present study, revealing 156 319 SVs. The phylogenomic analysis based on the SV dataset detected the putatively selected region of GJ sub-populations. A significant portion of the detected SVs overlapped with genic regions were found to influence the expression of involved genes inside GJ assemblies. Integrating the SVs and causal genetic variants underlying agronomic traits into the analysis enables the precise identification of breeding signatures resulting from complex breeding histories aimed at stress tolerance, yield potential and quality improvement. Further, the results demonstrated genomic and genetic evidence that the SV in the promoter of LTG1 is accounting for chilling sensitivity, and the increased copy numbers of GNP1 were associated with positive effects on grain number. In summary, the current study provides genomic resources for retracing the properties of SVs-shaped agronomic traits during previous breeding procedures, which will assist future genetic, genomic and breeding research on rice.

Keywords: Oryza sativa; japonica/geng; breeding process; de novo assembly; gene editing; structural variations.


Conflict of interest statement

The authors declare no conflict of interest.

Figures

Figure 1
Figure 1
Agronomic phenotypes and pedigree relationship of the genome for 12 GJ varieties. (a) The pedigree relationship among the 12 temperate GJ assemblies. The colours orange and blue stand for Chinese GJ and Japanese GJ respectively. (b) The plant and panicle architecture of 12 temperate GJ varieties assembled in this study.
Figure 2
Figure 2
Population structure of 58 long‐read assemblies. (a) The average SVs density of 58 assemblies. (b) Phylogenetic tree of 58 accessions including 12 assemblies in this study and 46 existing assemblies. The assemblies with red colour represent the 12 assemblies in the current study. Scale bar = 0.1. (c) Principal component analysis (PCA) plot for 58 de novo assemblies. (d) STRUCTURE analysis of 58 accessions with different numbers of clusters K = 4–6. The assemblies with red colour represent the 12 assemblies in the current study.
Figure 3
Figure 3
Structural variant (SV) characterization of GJ rice genomes. (a) The number of SVs in each assembly includes five types of SV. DEL, deletion; INS, insertion; INV, inversion; TRA, translocation. Other types included NOTAL (not aligned region), TDM (tandem repeat) and HDR (highly diverged regions). (b) The percentage of the detected SVs overlapped with different genomic regions in the 17 Geng assemblies. The mean percentage values of elements (2 kb upstream, coding region, intron, transposable elements and intergenic regions) are 21.4%, 3.5%, 16.6%, 48.4% and 10.1% respectively. (c) The SV distribution among 17 assemblies relative to Nip. A circular show of the detected SVs among the 17 GJ genomes with a sliding window size of 500 kb. (d) The landscape of some large‐size SVs among 17 GJ varieties and Nip. Red arrows direct the locus of SVs with insertions and deletions. Dark‐coloured bands display examples of large structural variations in inversion and translocation. (e) Presence of SVs among different breeding stages. SVs only existed in one group and were defined as specific SVs; the SVs not only existed in the first batch (shown in pink) but are also inherited into at least one group that was defined as common SVs. (f) Summary of transmitted SVs during past breeding. The values in differently coloured circles represent the number of SVs for corresponding SVs‐deriving sets including black (group‐specific SVs), purple (before 1980 inherited by following released groups), brown (1980–1990 inherited by following released groups), green (1990–2000 group inherited by following released groups) and blue (after 2000 inherited by internal varieties). (g) The pie plot shows the proportion changes in SV types between specific SVs and common SVs. The insertion (INS) and inversion (INV) rates are increased in common SVs. (h) Profiles of SV locus among different genetic elements. The proportion of SVs in the intergenic region is increased in common SVs.
Figure 4
Figure 4
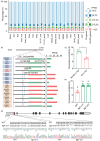
SVs impact gene expression profiles. (a) The proportion of SV genes and non‐SV genes were associated significantly (P < 0.01) with altered expression of related genes. The differences in per cent values between SV genes and non‐SV genes were assessed using Student's t‐tests for five continuous expression ranges respectively. *Indicated a significance level at P < 0.01. (b) The SVs upstream of LTG1 cause expression variants among GJ varieties. The blue line indicates the 288 bp insertion in the promoter of LTG1. (c) The temperature sensitivity (the difference in days to heading between plants under high and low temperatures) of non‐SV‐LTG1 and SV‐LTG1 varieties. Data are mean ± SEM (n = 7 for non‐SV‐LTG1, and n = 6 for SV‐LTG1), and *indicates significance at the P < 0.05 level. (d) Diagram and sequence of LTG1 CRISPR knockout lines (ltg1‐cr1 and ltg1‐cr2). The red line indicates the position of the sgRNA target site. (e) The temperature sensitivity of WT and CRISPR knockout lines (ltg1‐cr1 and ltg1‐cr2). Data are mean ± SEM (n = 10), and different letters indicate significant differences (P < 0.05, one‐way ANOVA, Tukey's HSD test).
Figure 5
Figure 5
Characteristics of gene CNVs related to important agronomic traits. (a) The functional genes with CNV mutations. Circle size represents the number of gene copies potentially generated by a tandem duplicated mechanism. Colours from light to dark imply the global expression level [log2 (FPKM)] of genes ranging from low to high. (b) Local syntenic relation of GNP1 implying breeding selection of different CNVs among 18 GJ varieties. The blue rectangle represents the forward strand gene in the chromosome, and the green rectangle means the reverse strand gene. Orange‐linked bands highlight homologue gene pairs having different copy numbers in this region. (c) Local syntenic relation of Pigm implying breeding selection of different copy number variation among 18 GJ varieties. The colours are the same as (b). The red dashed rectangle represents the Pigm cluster (R1R13) in Nip. Dark grey bands linked homologue R genes among assemblies. The orange band tracks the evolutionary pattern of R2 (LOC_Os06g17900) along with released GJ varieties.
Figure 6
Figure 6
Gene copy number variants (CNVs) are associated with variations in production. (a) Schematic illustrating a single copy of GNP1 in Nip and ZH11 and three copies of GNP1 in Toyo. (b) DNA qPCR validation of the three GNP1 copies. *Indicates significance at the P < 0.05 level. (c) The expression of GNP1 in Toyo with three copies is significantly higher than in Nip with a single copy of GNP1. *Indicates significance at the P < 0.05 level. (d) The expression level of GNP1 in Zh11 (CK) and two independent over‐expression transgenic lines. *Indicates significance at the P < 0.05 level. (e) The Zh11 (CK) plant architecture and two independent over‐expression transgenic lines. Bar = 20 cm. (f) The Zh11 (CK) plant height and two independent over‐expression transgenic lines. Data are mean ± SEM (n = 10), and *indicates significance at the P < 0.05 level. (g) Zh11 (CK) panicle size and two independent over‐expression transgenic lines. Bar = 1 cm. (h) The grains are derived from one Zh11 (CK) panicle and two independent over‐expression transgenic lines. Bar = 1 cm. (i) The grain number per panicle of Zh11 (CK) and two independent over‐expression transgenic lines. Data are mean ± SEM (n = 10), and *indicates significance at the P < 0.05 level. (j) The SVs around GNP1 in the 18 assemblies. (k) The distribution of multiple copies of GNP1 among 74 GJ varieties. (l) The grain number per panicle of varieties harbouring multiple GNP1 copies and varieties harbouring a single copy of GNP1. *Indicates significance at the P < 0.05 level.
Figure 7
Figure 7
The selection of the SVs in GJ. (a) A total of 24 878 SVs were overlapped with select sweeps, which involved 4089 genes. (b) Selection sweeps uncovered by joint cross‐population composite likelihood ratio (XP‐CLR) and diversity reduction index (DRI) approaches for the GJ population. Genes or QTLs related to yield, grain quality, hybrid sterility and biotic and abiotic stresses in the selection sweeps are indicated (Table S9).
Figure 8
Figure 8
The introgression of the SVs and inferior allele editing breeding. (a) Venn diagrams showing the number of the traced SVs from wild, cA, cB, japonica/geng (GJ) and indica/xian (XI). (b) A heat map showing the introgression of SVs around Chalk5. (c) The enlarged image of XP‐CLR score around Chalk5 and GS5. (d) Linkage disequilibrium plot for SVs. (e) Diagram and sequence of Chalk5 CRISPR knockout lines (chalk5‐cr1 and chalk5‐cr2). The red line indicates the position of the sgRNA target site. (f) The plant architecture of WT and chalk5‐cr1 and chalk5‐cr2. Bar = 10 cm. (g) The grain shape of WT and chalk5‐cr1 and chalk5‐cr2. Bar = 1 cm. (h) The panicle of WT and chalk5‐cr1 and chalk5‐cr2. Bar = 1 cm. (i) The chalkiness trait of WT and chalk5‐cr1 and chalk5‐cr2. Bar = 1 cm.

References

    1. Alexander, D.H. , Novembre, J. and Lange, K. (2009) Fast model‐based estimation of ancestry in unrelated individuals. Genome Res. 19, 1655–1664. - PMC - PubMed
    1. Altschul, S.F. , Gish, W. , Miller, W. , Myers, E.W. and Lipman, D.J. (1990) Basic local alignment search tool. J. Mol. Biol. 215, 403–410. - PubMed
    1. Barrett, J.C. , Fry, B. , Maller, J. and Daly, M.J. (2005) Haploview: analysis and visualization of LD and haplotype maps. Bioinformatics, 21, 263–265. - PubMed
    1. Birney, E. , Clamp, M. and Durbin, R. (2004) GeneWise and genomewise. Genome Res. 14, 988–995. - PMC - PubMed
    1. Blanco, E. , Parra, G. and Guigó, R. (2007) Using geneid to identify genes. Curr. Protoc. Bioinform. 18, 4–3. - PubMed

Publication types

LinkOut - more resources