

doi: 10.1039/d2cc03947h.
A long-wavelength xanthene dye for photoacoustic imaging
Affiliations
- PMID: 36196957
- PMCID: PMC9634815
- DOI: 10.1039/d2cc03947h
Item in Clipboard
A long-wavelength xanthene dye for photoacoustic imaging
Chem Commun (Camb).
.
Abstract
Photoacoustic (PA) imaging is a powerful biomedical imaging modality. We designed KeTMR and KeJuR, two xanthene-based dyes that were readily obtained through a 2-step synthetic route. KeJuR has low molecular weight, good aqueous solubility, and superior chemical stability compared to KeTMR. KeJuR shows a robust PA signal under 860 nm excitation and can be paired with traditional PA dyes for multiplex imaging in blood samples under a tissue-mimicking environment.
Figures
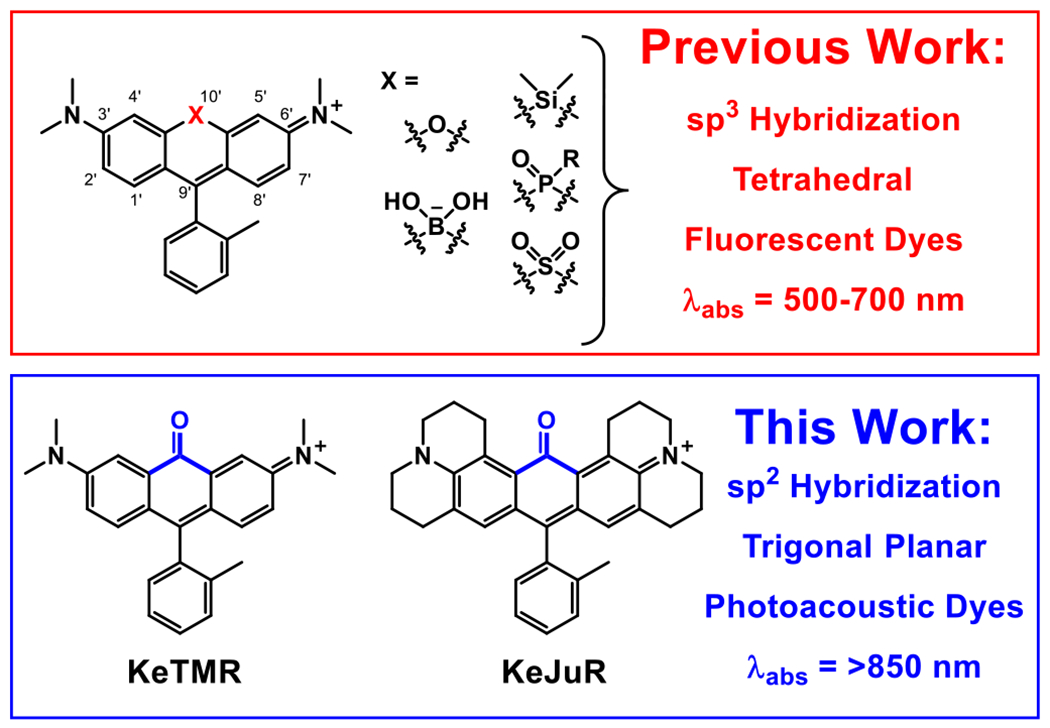
Structural comparison of previously reported xanthene based fluorescent dyes and the re-purposed PA dyes reported in this work.

Synthesis of KeTMR.
Absorbance and Emission Spectra of KeTMR. a) Plot of relative absorbance (red) or emission intensity (dark red) for KeTMR (10 μM, DPBS). Emission intensity is corrected for solvent re-absorption (SI). b) Plot of emission maxima for KeTMR (10 μM) vs. dielectric constant (ε).

Synthesis of KeJuR.

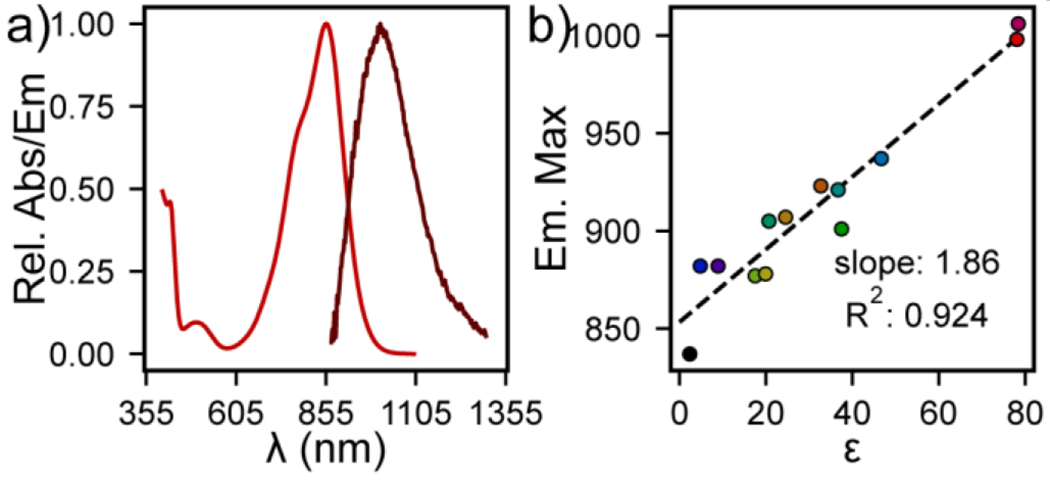
Absorbance and Emission Spectra of KeJuR. a) Plot of relative absorbance (red) or emission intensity (dark red) for KeJuR (10 μM, DPBS). Emission intensity is corrected for solvent re-absorption (SI). b) Plot of emission maxima for KeJuR (10 μM) vs. dielectric constant (ε).
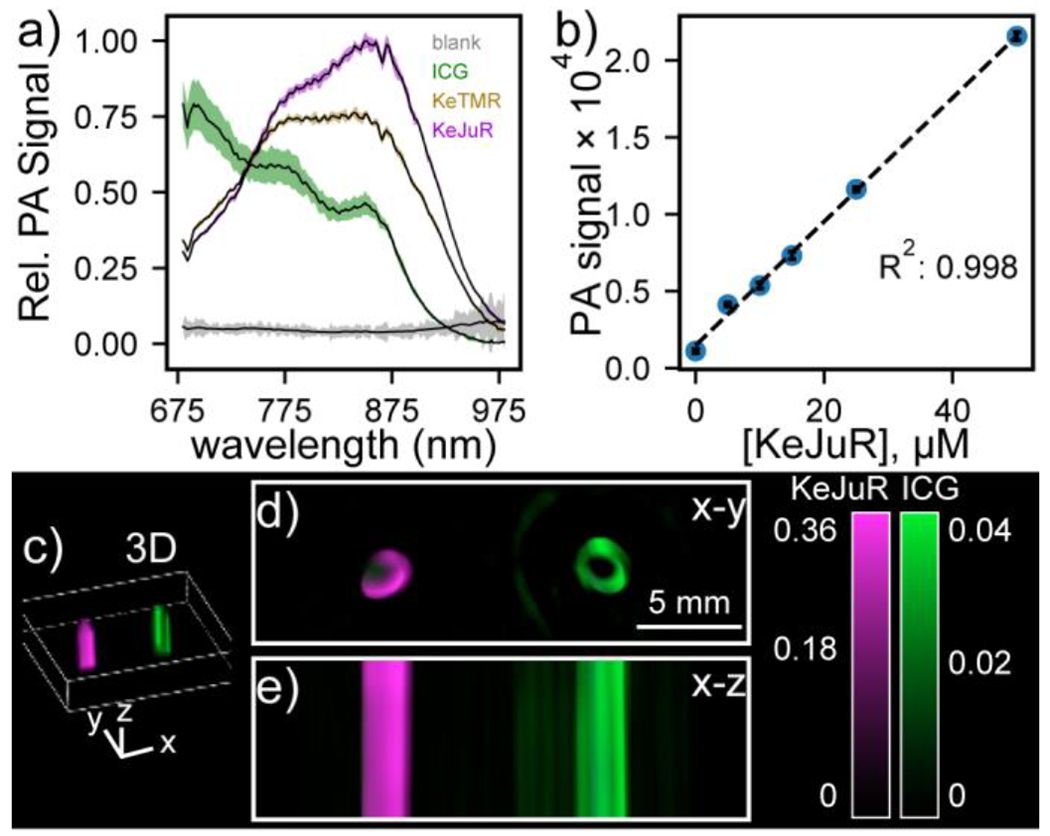
Photoacoustic imaging with Ke-xanthene dyes. a) Plot of relative PA intensity for 50 μM of the indicated dye in DBPS (pH 7.2, 1% DMSO). Data are mean ± S.D. for n = 7 different depths. b) Plot of PA signal (ex: 860 nm) vs. KeJuR concentration. c) 3D reconstruction of PA tomograph of KeJuR (magenta) or ICG (green) in sheep blood within a tissue phantom containing 60% milk. Cross - sections through d) x-y or e) x-z planes show strong PA signal for KeJuR.
Similar articles
-
Thienylpiperidine Donor NIR Xanthene-Based Dye for Photoacoustic Imaging.Org Lett. 2021 Oct 1;23(19):7640-7644. doi: 10.1021/acs.orglett.1c02862. Epub 2021 Sep 22. Org Lett. 2021. PMID: 34550707
-
Xanthene-Based Nitric Oxide-Responsive Nanosensor for Photoacoustic Imaging in the SWIR Window.Angew Chem Int Ed Engl. 2023 Mar 20;62(13):e202214855. doi: 10.1002/anie.202214855. Epub 2023 Feb 17. Angew Chem Int Ed Engl. 2023. PMID: 36722146 Free PMC article.
-
Optimizing Axial and Peripheral Substitutions in Si-Centered Naphthalocyanine Dyes for Enhancing Aqueous Solubility and Photoacoustic Signal Intensity.Int J Mol Sci. 2023 Jan 23;24(3):2241. doi: 10.3390/ijms24032241. Int J Mol Sci. 2023. PMID: 36768560 Free PMC article.
-
Activatable Small Molecule Probes for Photoacoustic Imaging: Dyes and Applications.Curr Med Chem. 2022;29(39):6008-6029. doi: 10.2174/0929867329666220208093735. Curr Med Chem. 2022. PMID: 35135445 Review.
-
Advances in Imaging Techniques and Genetically Encoded Probes for Photoacoustic Imaging.Theranostics. 2016 Oct 7;6(13):2414-2430. doi: 10.7150/thno.15878. eCollection 2016. Theranostics. 2016. PMID: 27877244 Free PMC article. Review.
Cited by
-
Azaphosphinate Dyes: A Low Molecular Weight Near-Infrared Scaffold for Development of Photoacoustic or Fluorescence Imaging Probes.Chemistry. 2024 Mar 15;30(16):e202303331. doi: 10.1002/chem.202303331. Epub 2024 Feb 2. Chemistry. 2024. PMID: 38206848 Free PMC article.
-
An open and shut case? Chemistry to control xanthene dyes.Trends Chem. 2024 Apr;6(4):164-172. doi: 10.1016/j.trechm.2024.01.006. Epub 2024 Apr 10. Trends Chem. 2024. PMID: 39036609 Free PMC article.
-
Acoustic loudness factor as an experimental parameter for benchmarking small molecule photoacoustic probes.Nat Commun. 2025 Apr 22;16(1):3779. doi: 10.1038/s41467-025-59121-6. Nat Commun. 2025. PMID: 40263272 Free PMC article.
-
Single Atom Stabilization of Phosphinate Ester-Containing Rhodamines Yields Cell Permeable Probes for Turn-On Photoacoustic Imaging.Chemistry. 2024 Jan 2;30(1):e202303038. doi: 10.1002/chem.202303038. Epub 2023 Nov 10. Chemistry. 2024. PMID: 37852935 Free PMC article.
-
Xanthene-Based Dyes for Photoacoustic Imaging and their Use as Analyte-Responsive Probes.Chemistry. 2024 Jul 2;30(37):e202400598. doi: 10.1002/chem.202400598. Epub 2024 Jun 14. Chemistry. 2024. PMID: 38662806 Free PMC article.