

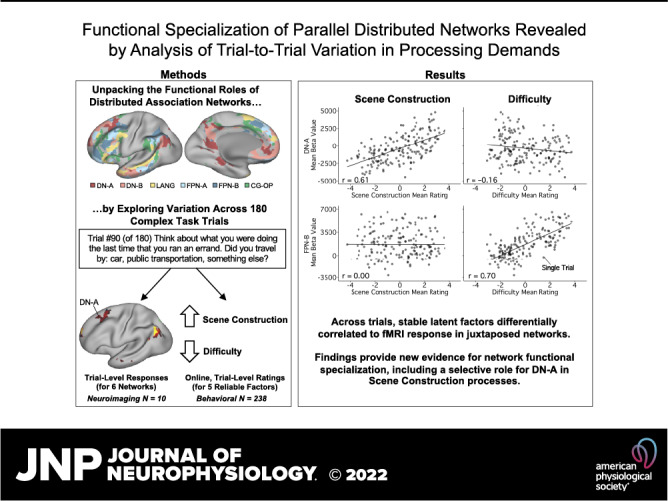
Functional specialization of parallel distributed networks revealed by analysis of trial-to-trial variation in processing demands
- PMID: 36197013
- PMCID: PMC9799157
- DOI: 10.1152/jn.00211.2022
Functional specialization of parallel distributed networks revealed by analysis of trial-to-trial variation in processing demands
Abstract
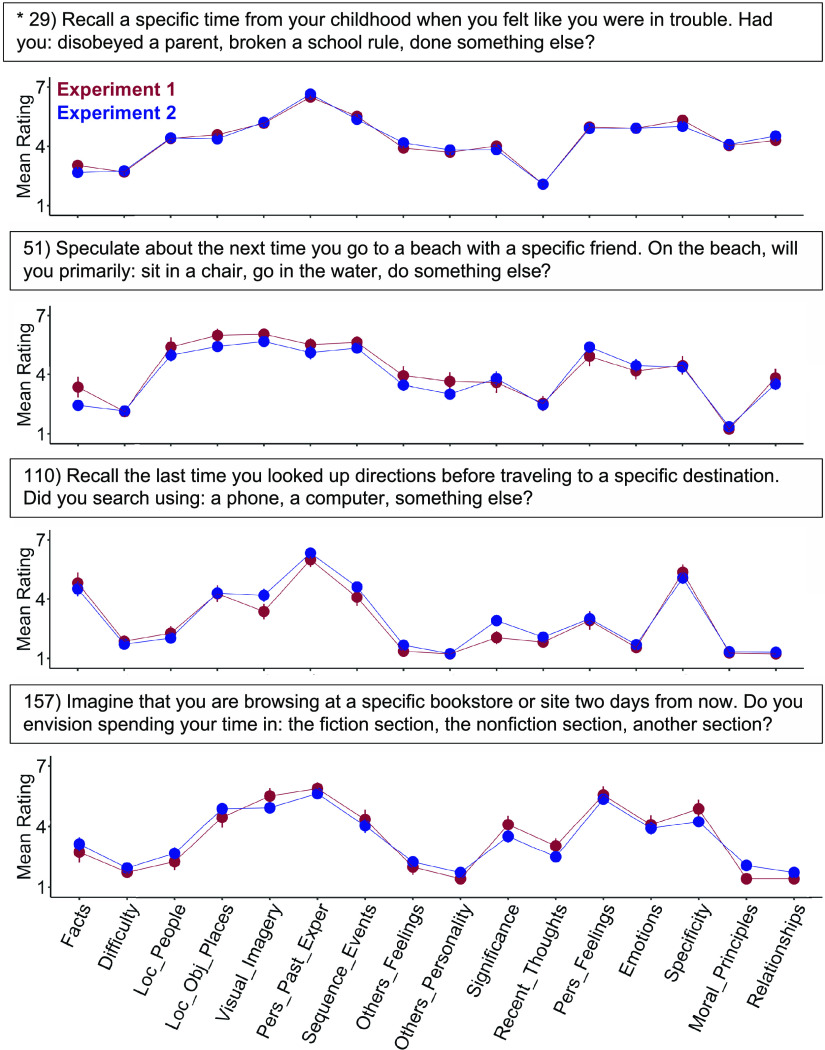
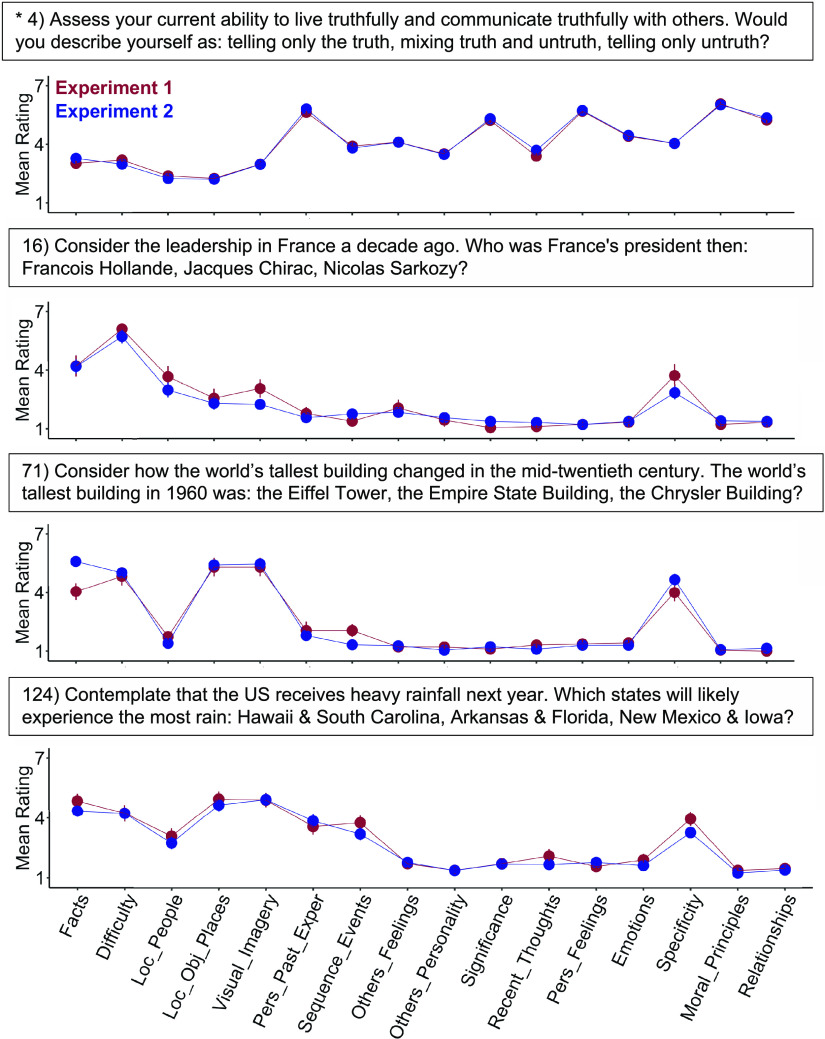
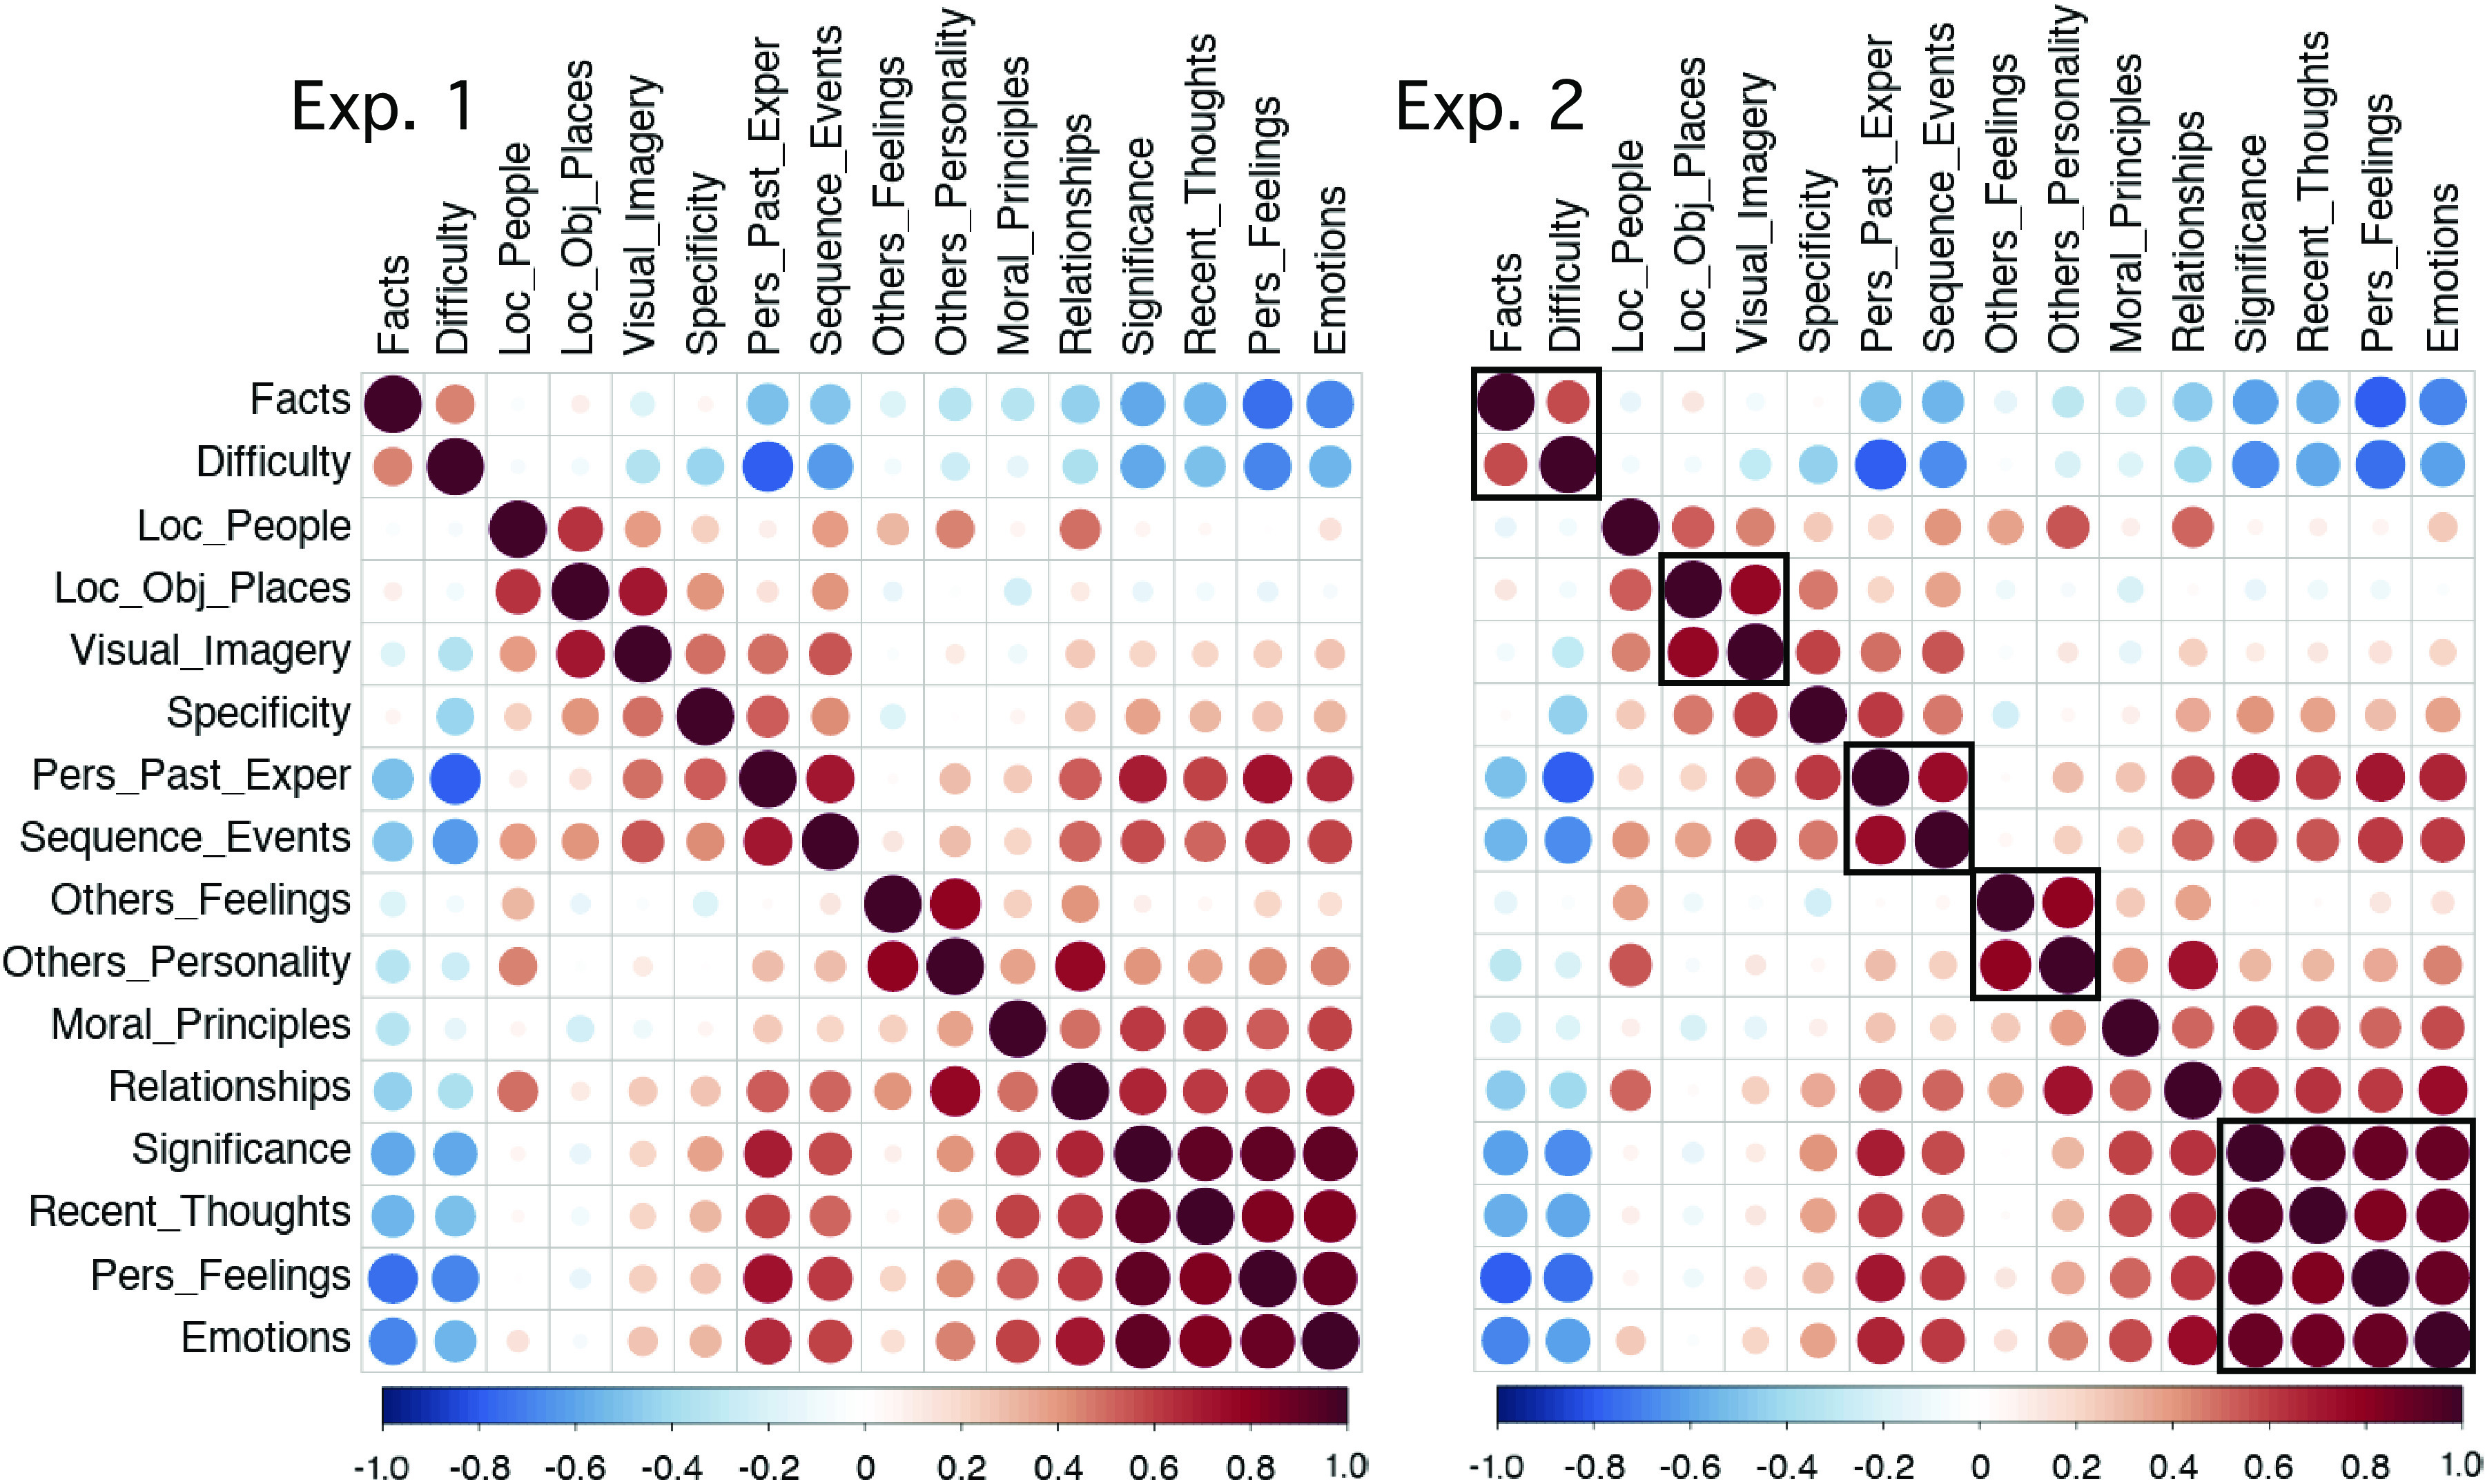
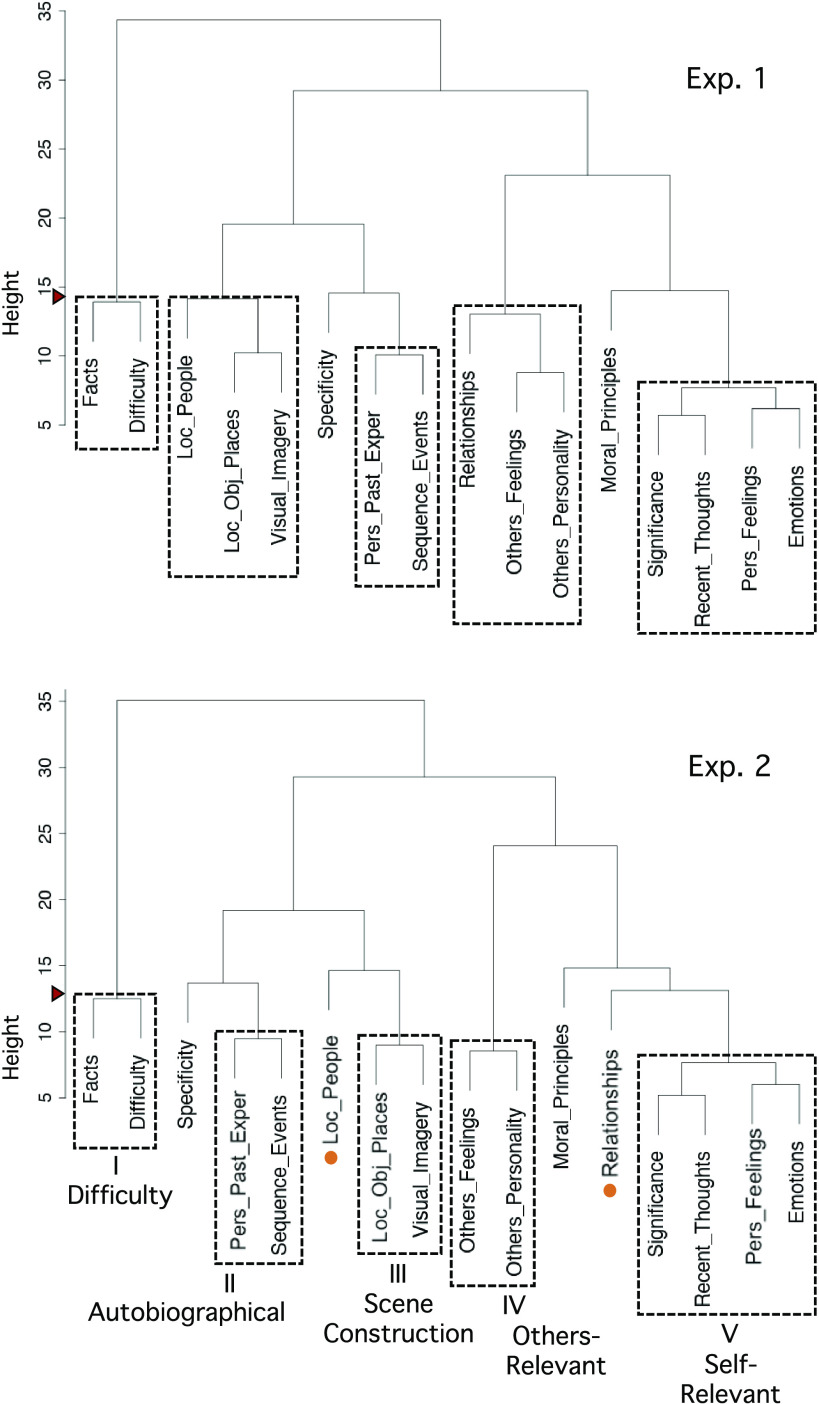
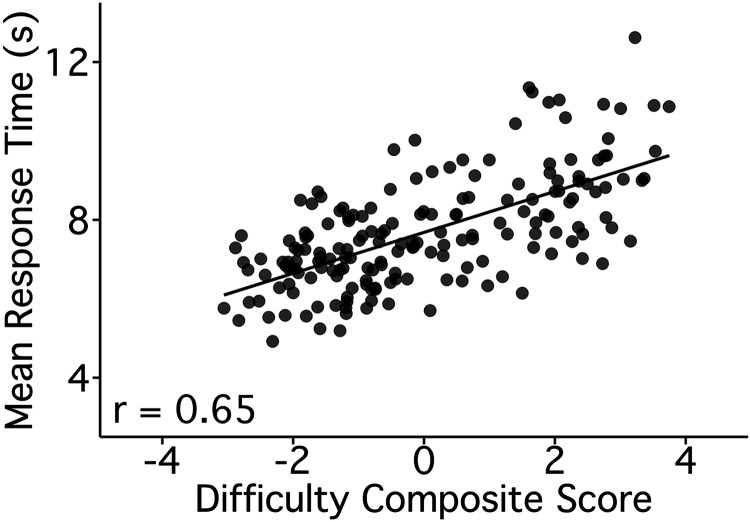
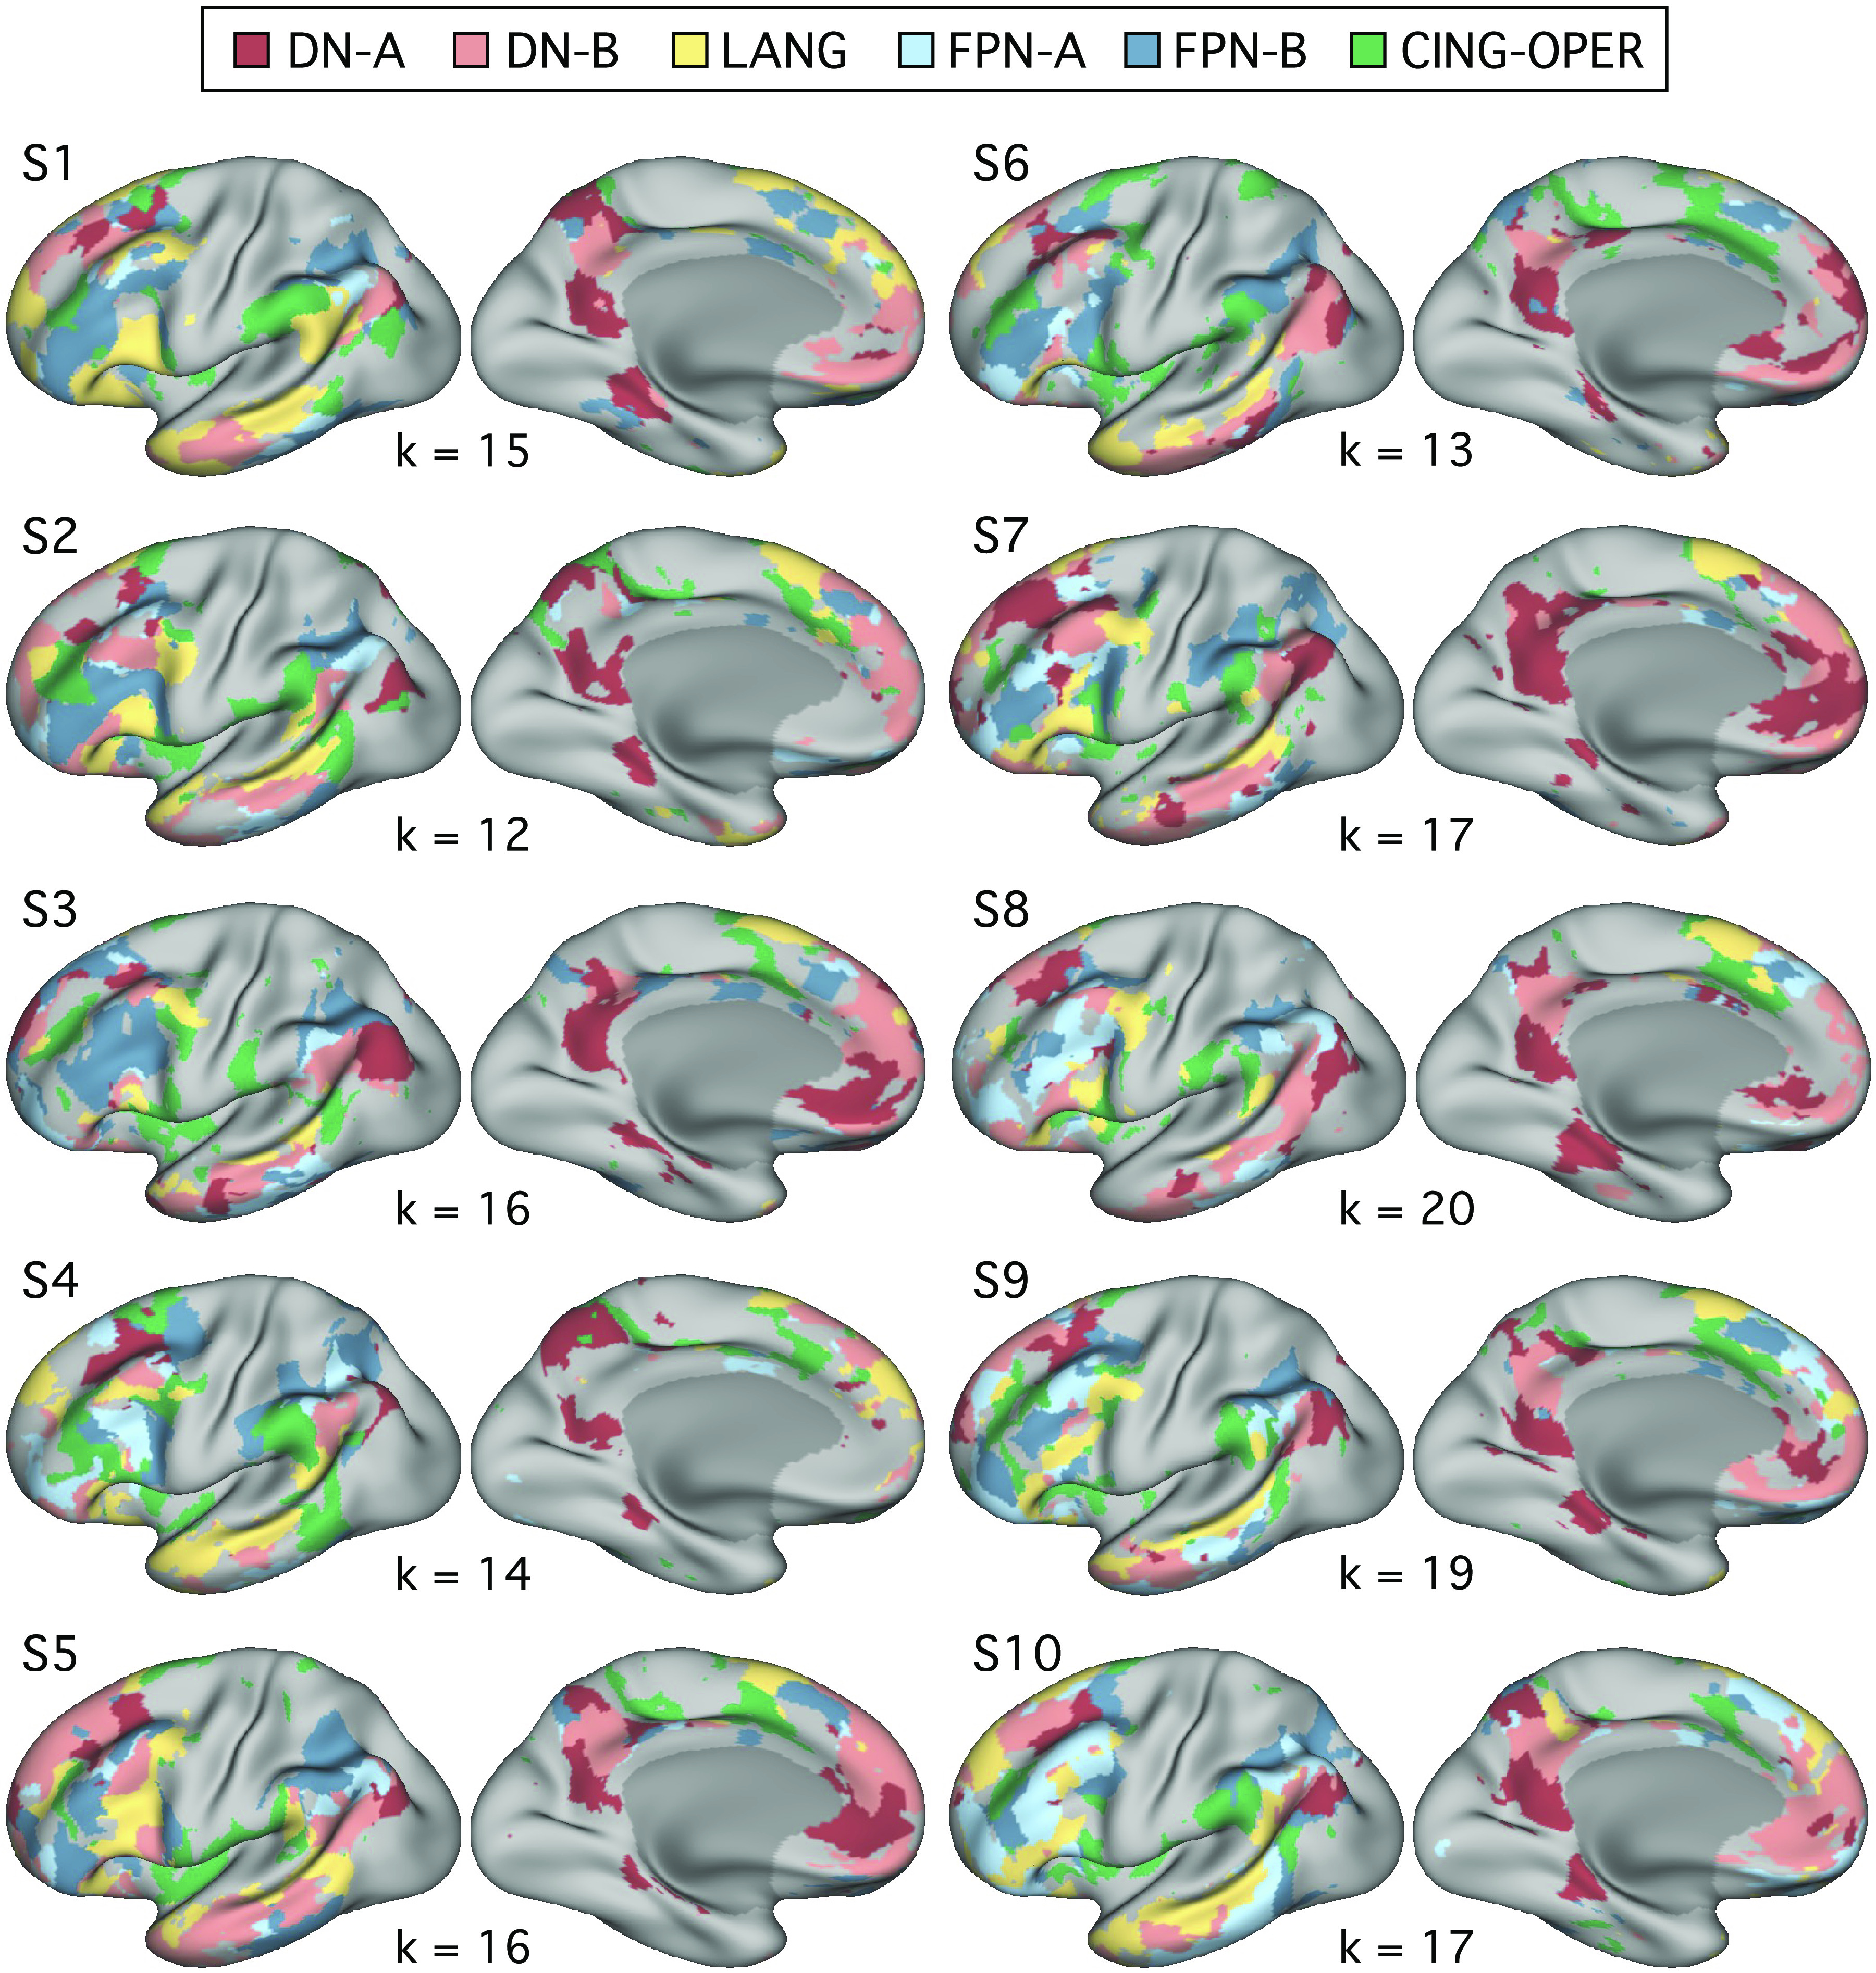
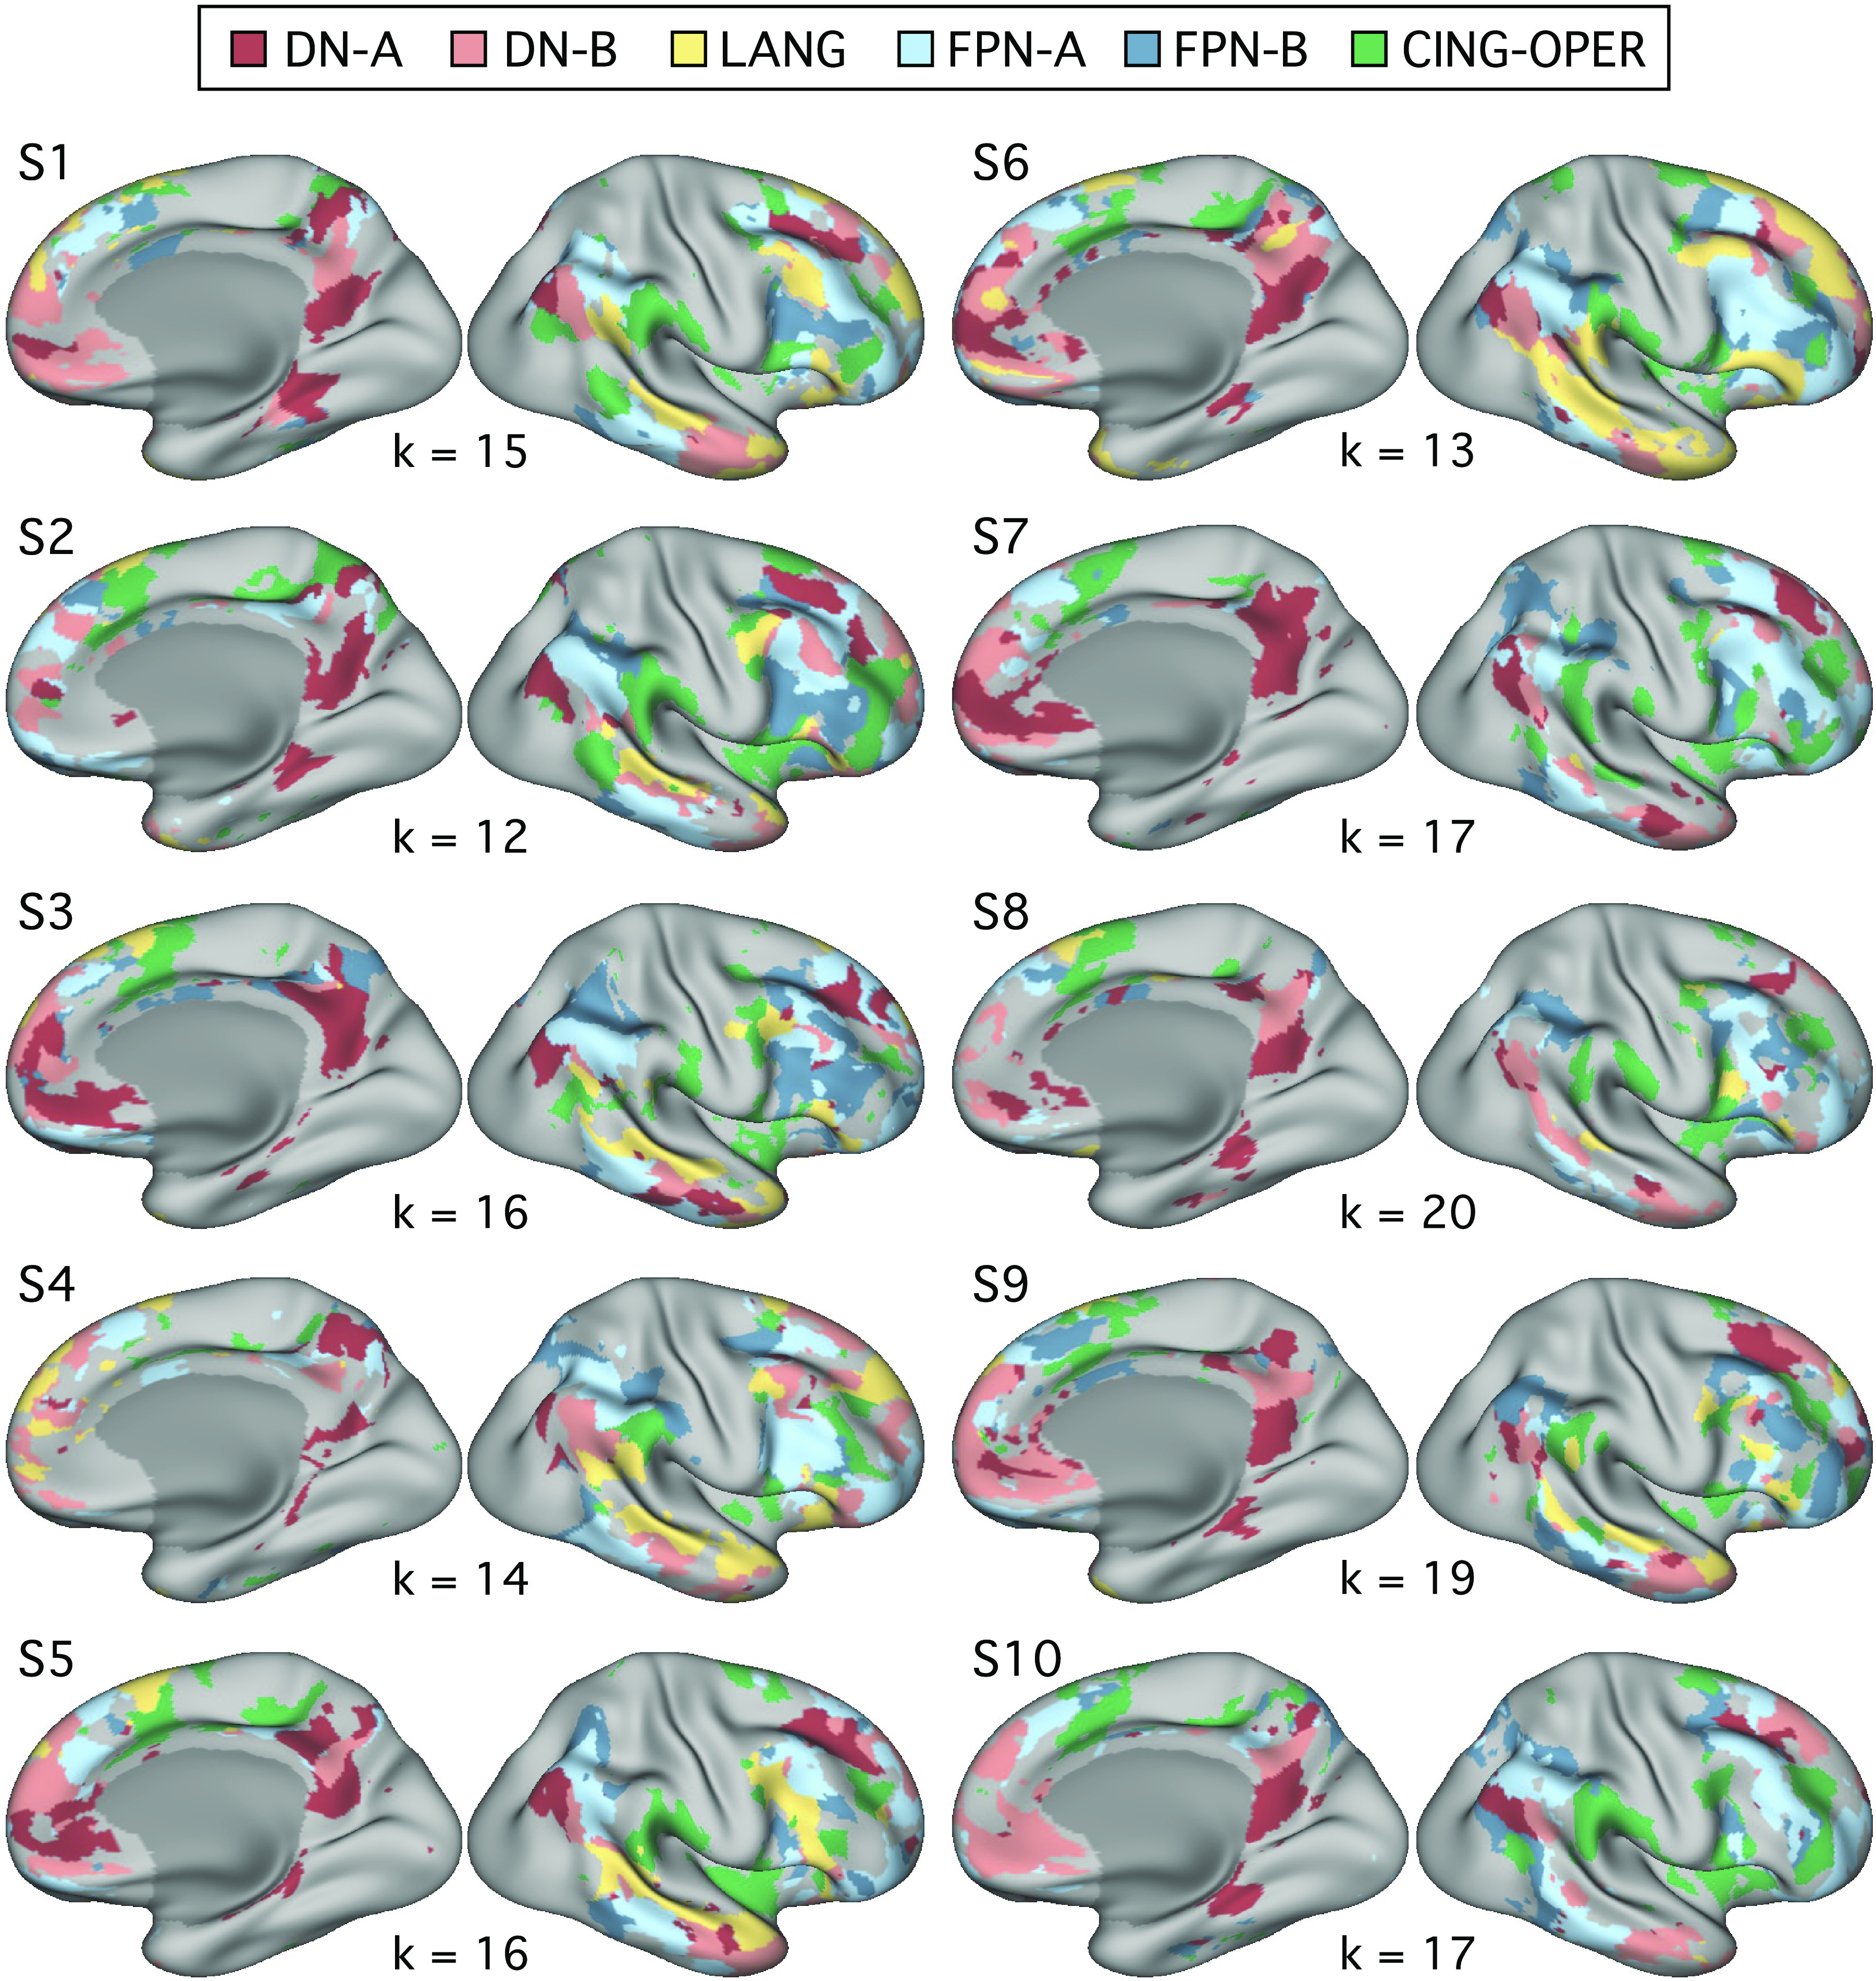
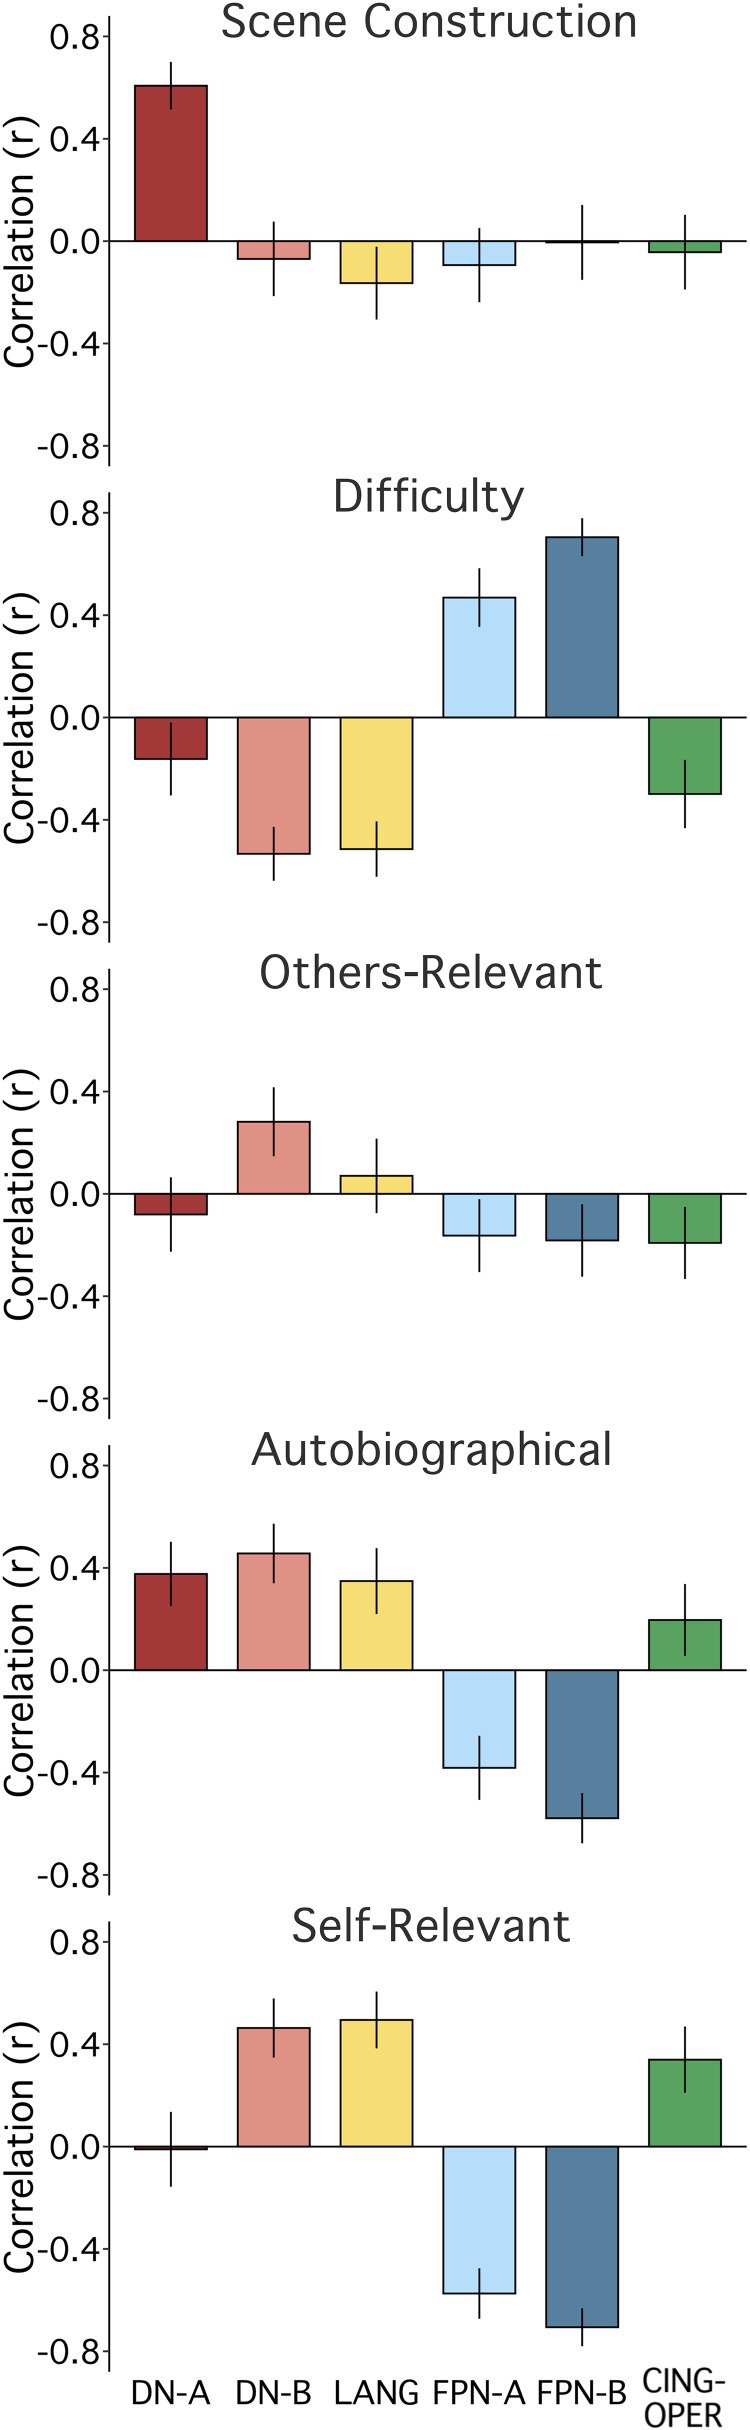
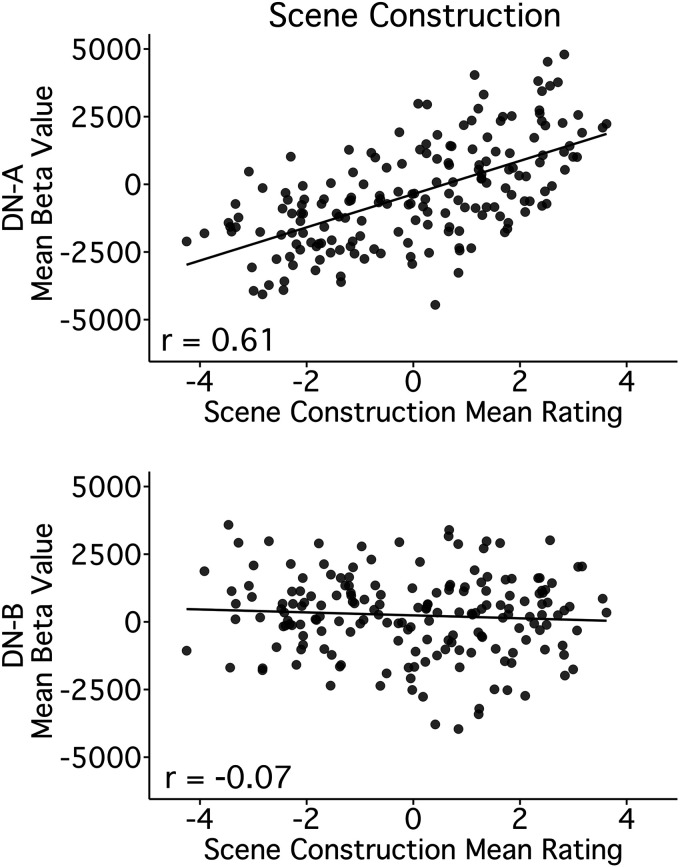
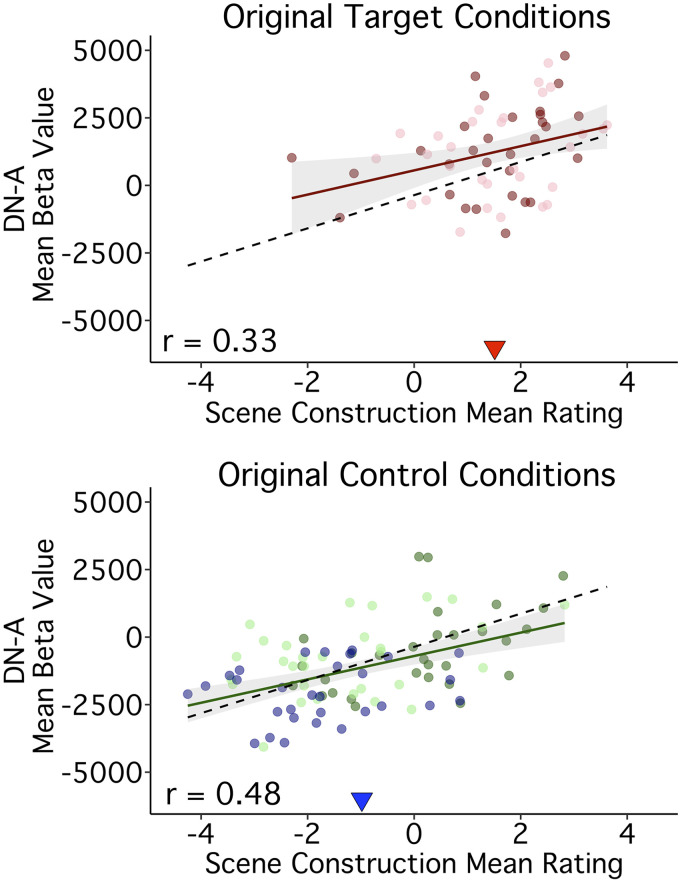
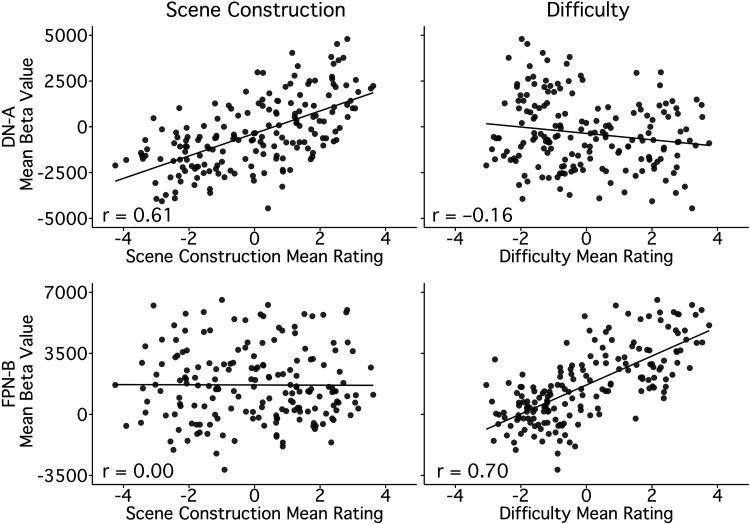
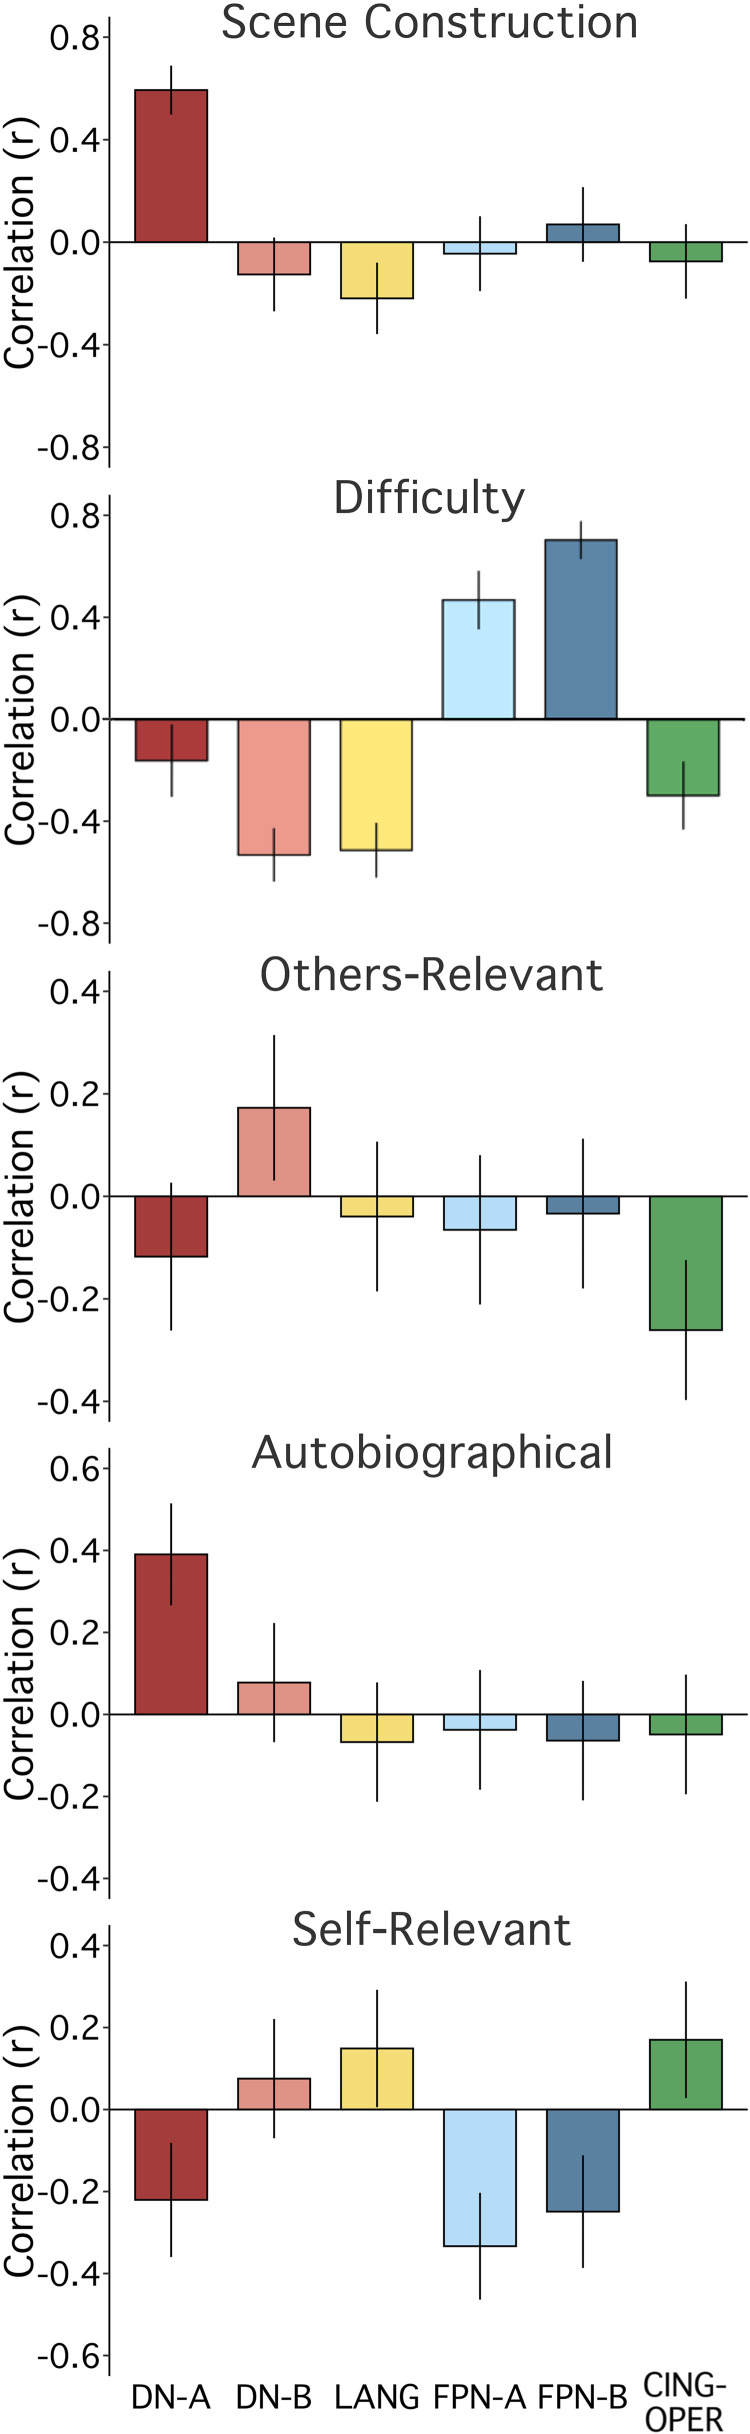
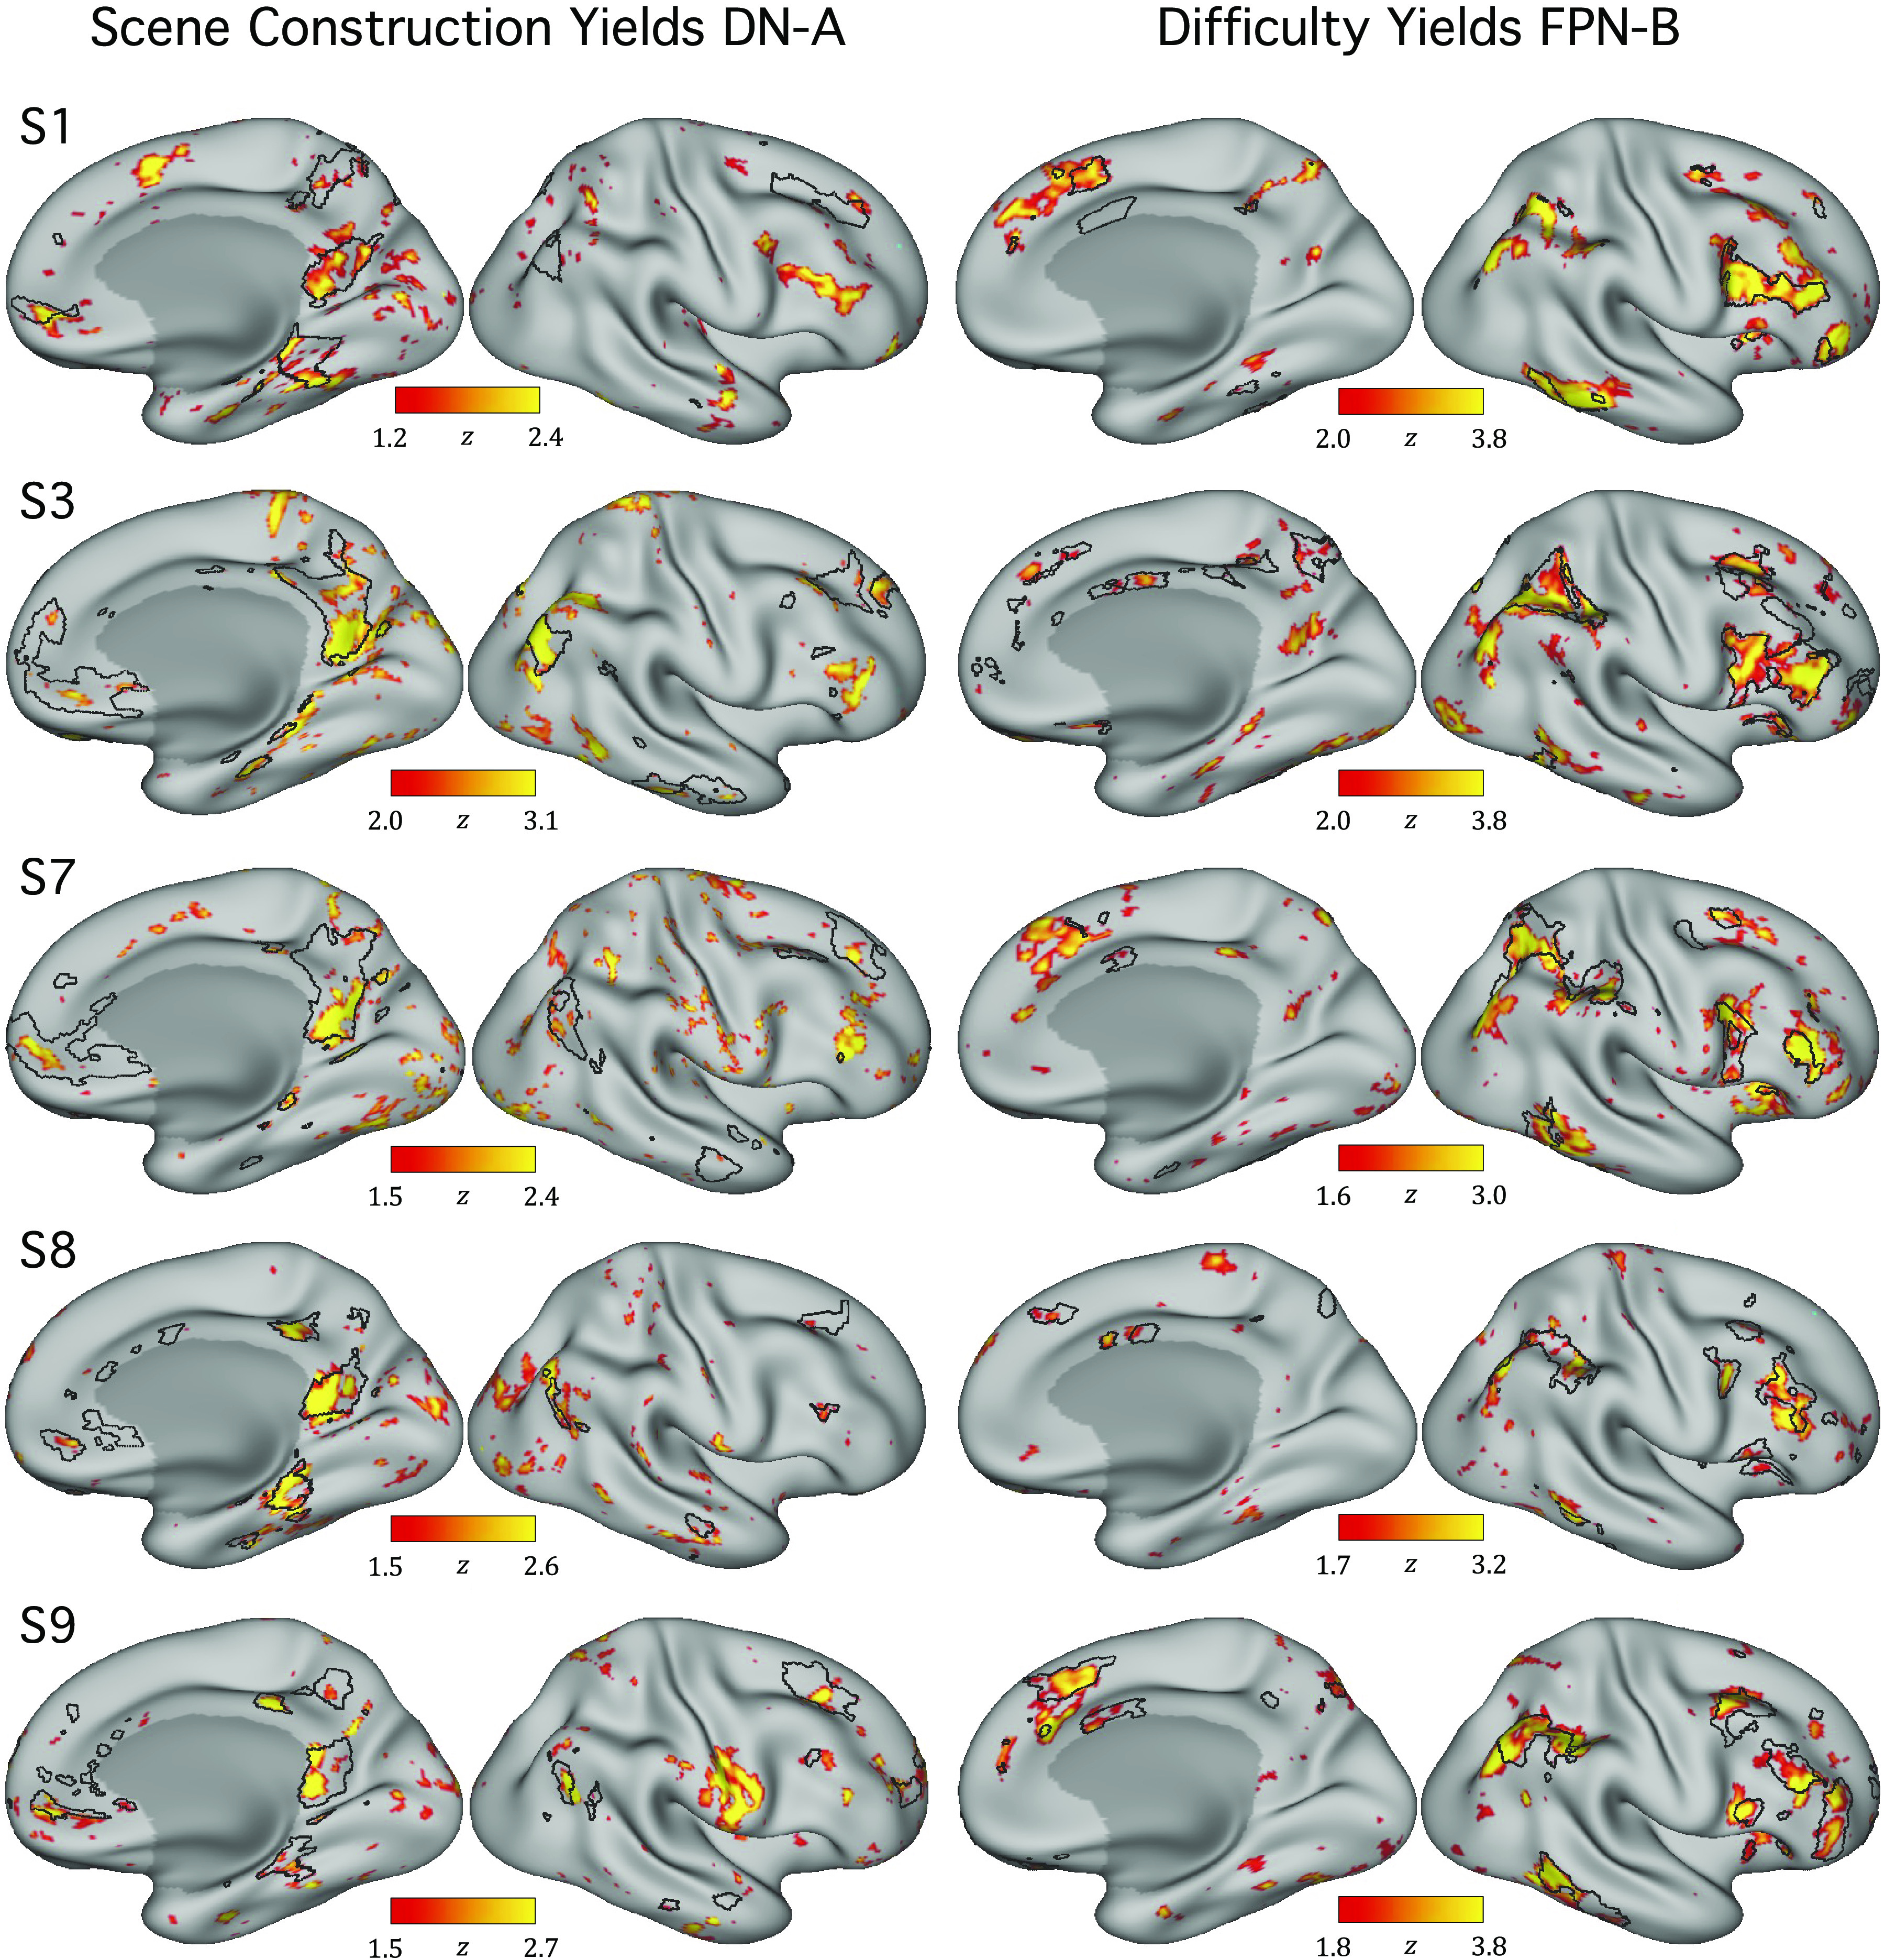
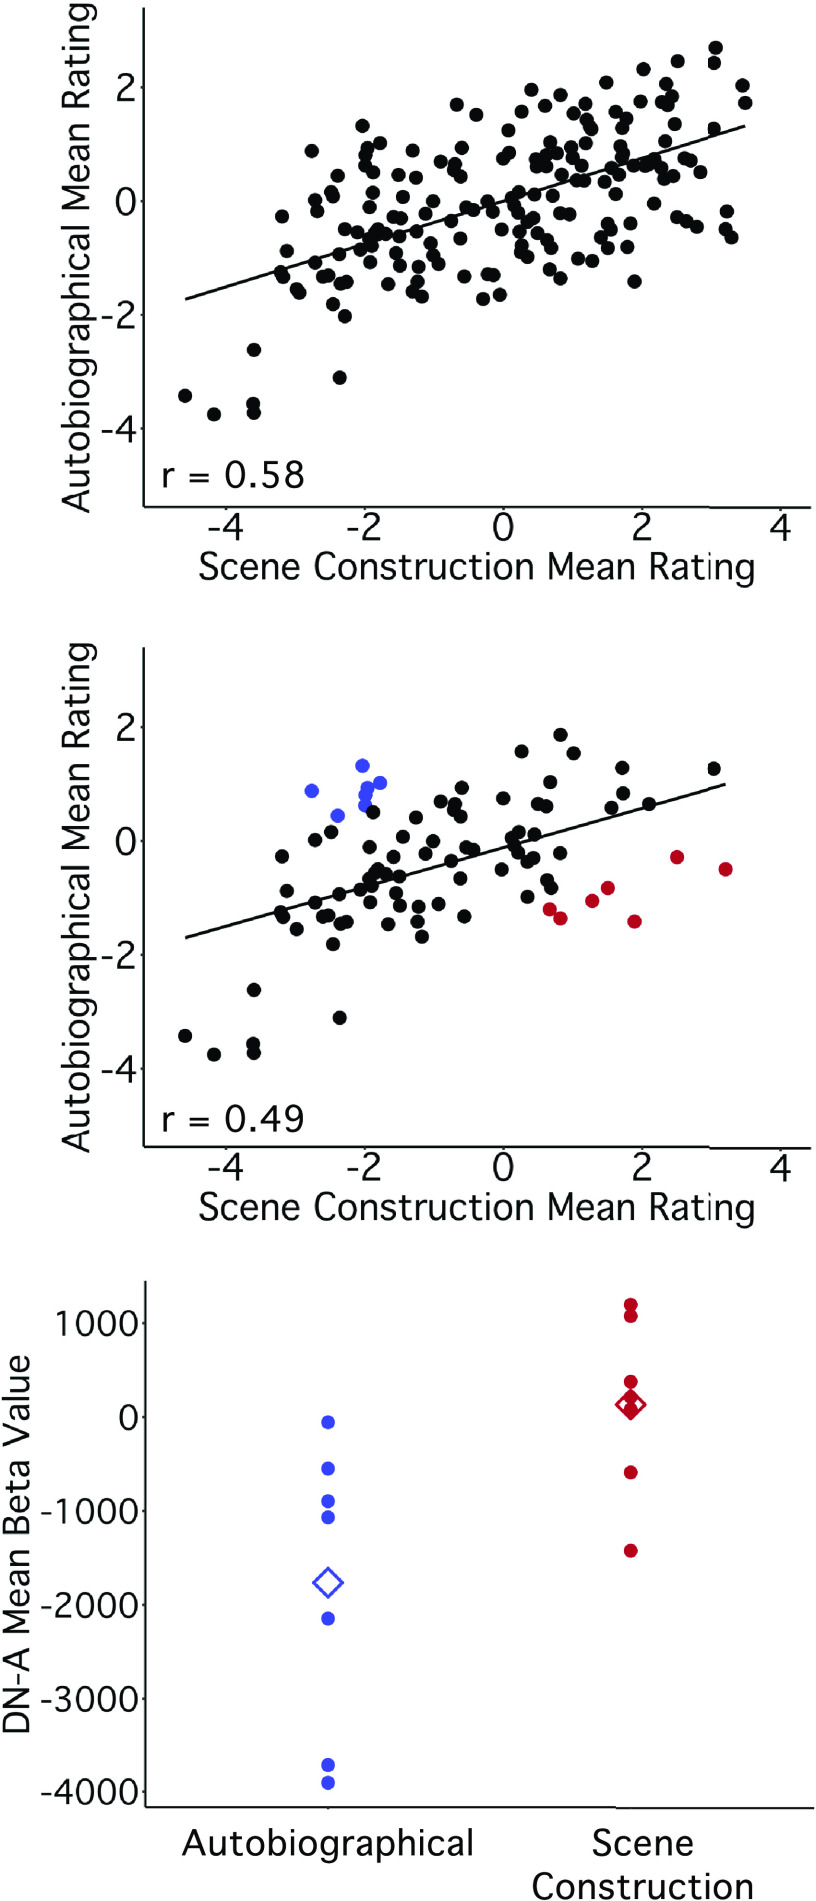
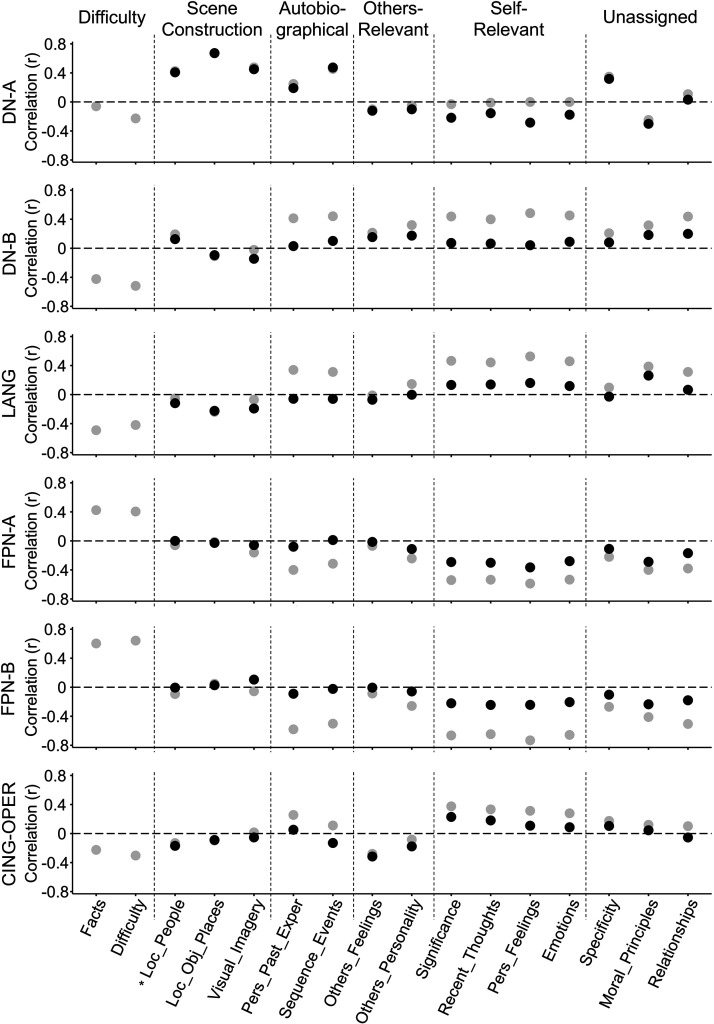
Multiple large-scale networks populate human association cortex. Here, we explored the functional properties of these networks by exploiting trial-to-trial variation in component-processing demands. In two behavioral studies (n = 136 and n = 238), participants quantified strategies used to solve individual task trials that spanned remembering, imagining future scenarios, and various control trials. These trials were also all scanned in an independent sample of functional MRI participants (n = 10), each with sufficient data to precisely define within-individual networks. Stable latent factors varied across trials and correlated with trial-level functional responses selectively across networks. One network linked to parahippocampal cortex, labeled Default Network A (DN-A), tracked scene construction, including for control trials that possessed minimal episodic memory demands. To the degree, a trial encouraged participants to construct a mental scene with imagery and awareness about spatial locations of objects or places, the response in DN-A increased. The juxtaposed Default Network B (DN-B) showed no such response but varied in relation to social processing demands. Another adjacent network, labeled Frontoparietal Network B (FPN-B), robustly correlated with trial difficulty. These results support that DN-A and DN-B are specialized networks differentially supporting information processing within spatial and social domains. Both networks are dissociable from a closely juxtaposed domain-general control network that tracks cognitive effort.NEW & NOTEWORTHY Tasks shown to differentially recruit parallel association networks are multifaceted, leaving open questions about network processes. Here, examining trial-to-trial network response properties in relation to trial traits reveals new insights into network functions. In particular, processes linked to scene construction selectively recruit a distributed network with links to parahippocampal and retrosplenial cortices, including during trials designed not to rely on the personal past. Adjacent networks show distinct patterns, providing novel evidence of functional specialization.
Keywords: association cortex; cognitive control; frontoparietal control network; hippocampus.
Conflict of interest statement
No conflicts of interest, financial or otherwise, are declared by the authors.
Figures
Similar articles
-
Parallel distributed networks dissociate episodic and social functions within the individual.J Neurophysiol. 2020 Mar 1;123(3):1144-1179. doi: 10.1152/jn.00529.2019. Epub 2020 Feb 12. J Neurophysiol. 2020. PMID: 32049593 Free PMC article.
-
Situating the left-lateralized language network in the broader organization of multiple specialized large-scale distributed networks.J Neurophysiol. 2020 Nov 1;124(5):1415-1448. doi: 10.1152/jn.00753.2019. Epub 2020 Sep 23. J Neurophysiol. 2020. PMID: 32965153 Free PMC article.
-
Side-by-side regions in dorsolateral prefrontal cortex estimated within the individual respond differentially to domain-specific and domain-flexible processes.J Neurophysiol. 2023 Dec 1;130(6):1602-1615. doi: 10.1152/jn.00277.2023. Epub 2023 Nov 8. J Neurophysiol. 2023. PMID: 37937340 Free PMC article.
-
From sensation to cognition.Brain. 1998 Jun;121 ( Pt 6):1013-52. doi: 10.1093/brain/121.6.1013. Brain. 1998. PMID: 9648540 Review.
-
Specialized Networks for Social Cognition in the Primate Brain.Annu Rev Neurosci. 2023 Jul 10;46:381-401. doi: 10.1146/annurev-neuro-102522-121410. Annu Rev Neurosci. 2023. PMID: 37428602 Free PMC article. Review.
Cited by
-
Organization of the human cerebral cortex estimated within individuals: networks, global topography, and function.J Neurophysiol. 2024 Jun 1;131(6):1014-1082. doi: 10.1152/jn.00308.2023. Epub 2024 Mar 15. J Neurophysiol. 2024. PMID: 38489238 Free PMC article.
-
Scene construction and autobiographical memory retrieval in autism spectrum disorder.Autism Res. 2024 Feb;17(2):204-214. doi: 10.1002/aur.3066. Epub 2023 Nov 30. Autism Res. 2024. PMID: 38037250 Free PMC article. Review.
-
Specialization of the Human Hippocampal Long Axis Revisited.bioRxiv [Preprint]. 2023 Dec 19:2023.12.19.572264. doi: 10.1101/2023.12.19.572264. bioRxiv. 2023. Update in: Proc Natl Acad Sci U S A. 2025 Jan 21;122(3):e2422083122. doi: 10.1073/pnas.2422083122. PMID: 38187548 Free PMC article. Updated. Preprint.
-
Default Mode Network Functional Connectivity As a Transdiagnostic Biomarker of Cognitive Function.Biol Psychiatry Cogn Neurosci Neuroimaging. 2025 Apr;10(4):359-368. doi: 10.1016/j.bpsc.2024.12.016. Epub 2025 Jan 9. Biol Psychiatry Cogn Neurosci Neuroimaging. 2025. PMID: 39798799 Review.
-
Distinct distributed brain networks dissociate self-generated mental states.bioRxiv [Preprint]. 2025 Feb 27:2025.02.27.640604. doi: 10.1101/2025.02.27.640604. bioRxiv. 2025. PMID: 40060698 Free PMC article. Preprint.
References
Publication types
MeSH terms
Grants and funding
LinkOut - more resources
Full Text Sources
Miscellaneous