. 2022 Oct 26;96(20):e0054922.
doi: 10.1128/jvi.00549-22. Epub 2022 Oct 5.

SYNJ2BP Improves the Production of Lentiviral Envelope Protein by Facilitating the Formation of Mitochondrion-Associated Endoplasmic Reticulum Membrane

Affiliations

SYNJ2BP Improves the Production of Lentiviral Envelope Protein by Facilitating the Formation of Mitochondrion-Associated Endoplasmic Reticulum Membrane

Yingyi Duan et al. J Virol. .

Abstract

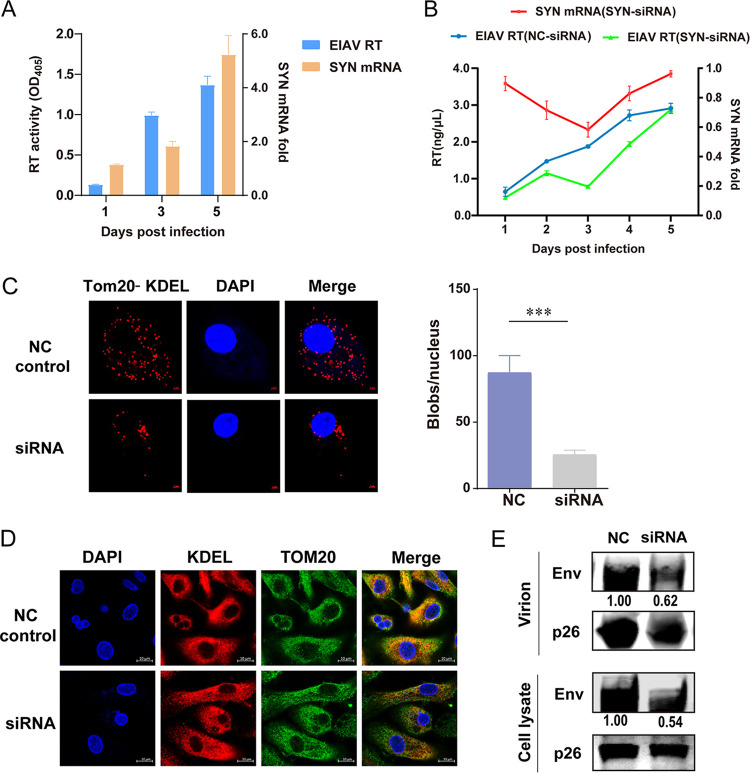
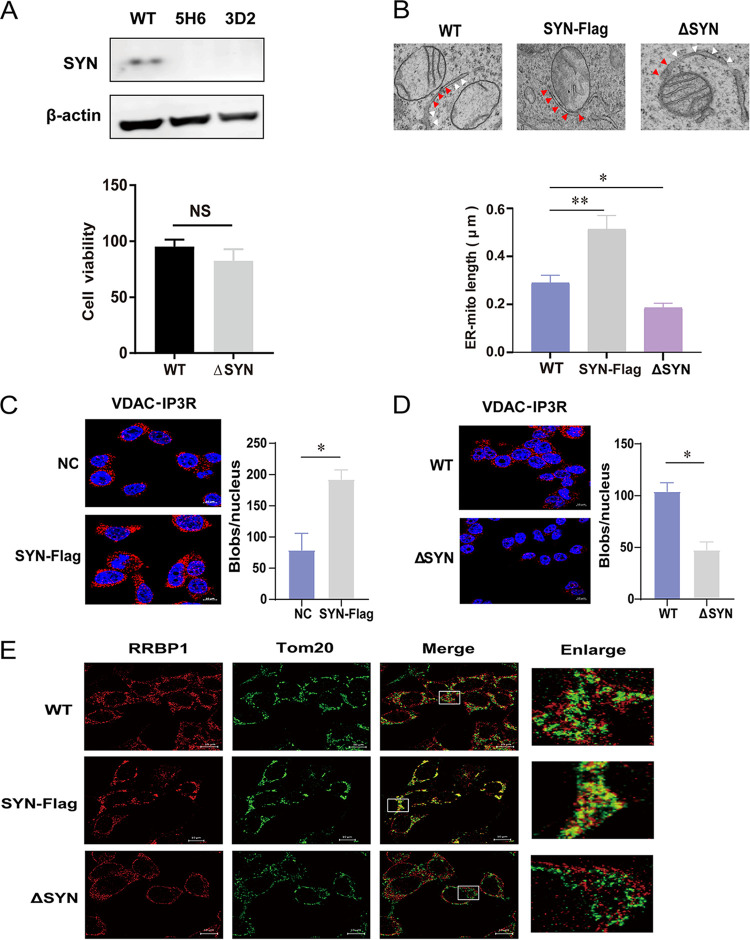
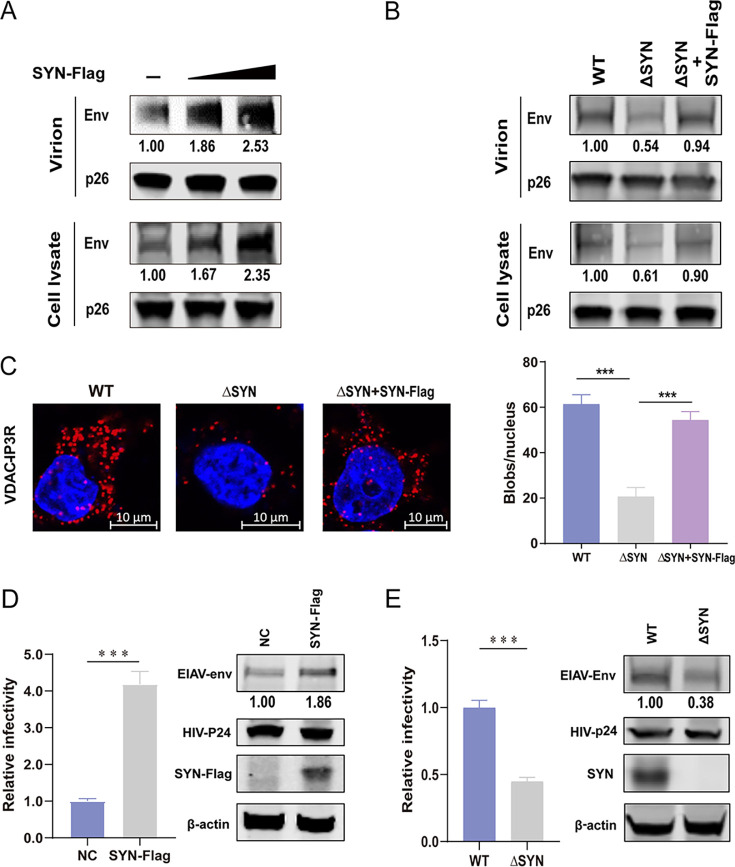
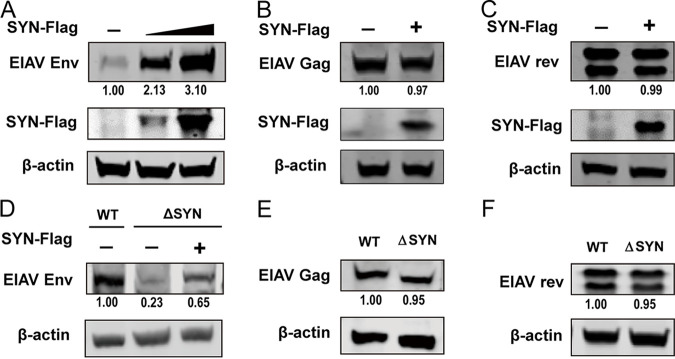
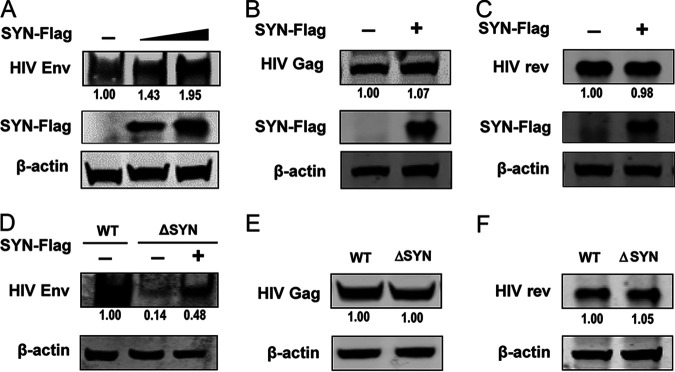
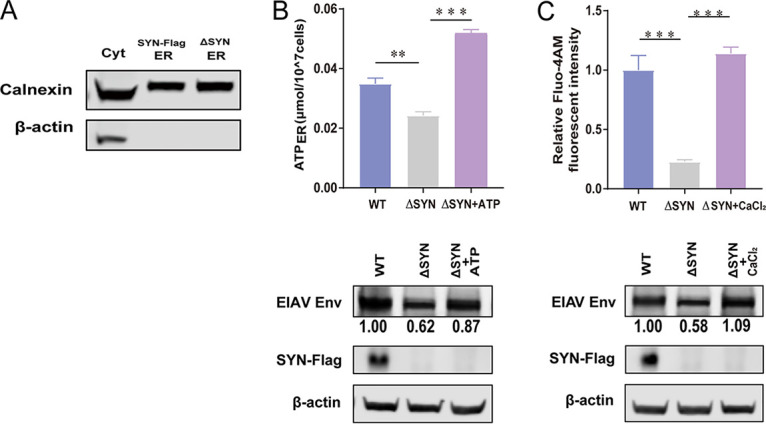
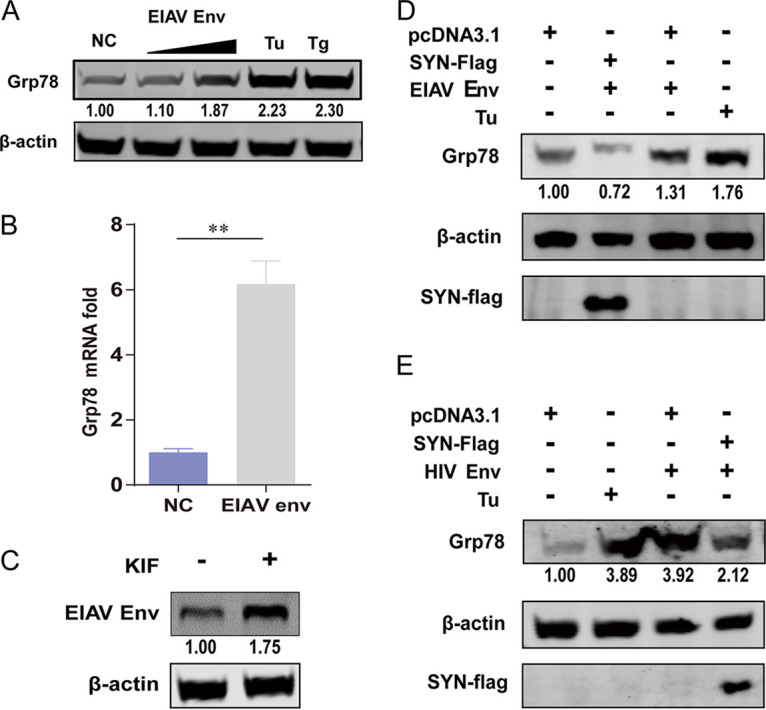
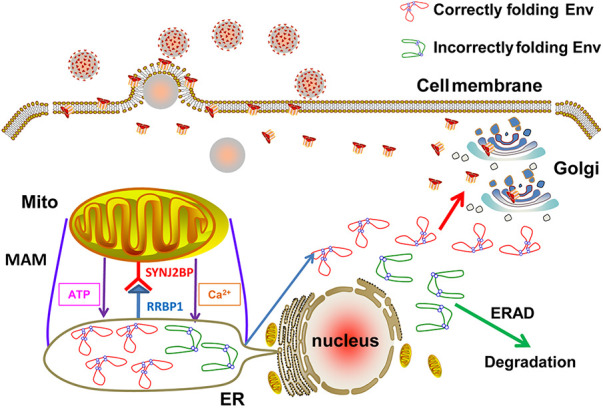
Equine infectious anemia virus (EIAV) and HIV are both members of the Lentivirus genus and are similar in major virological characters. EIAV endangers the horse industry. In addition, EIAV can also be used as a model for HIV research. The maturation of the lentiviral Env protein, which is necessary for viral entry, requires Env to be folded in the endoplasmic reticulum (ER). It is currently unclear how this process is regulated. Mitochondrion-associated endoplasmic reticulum membrane (MAM) is a specialized part of the close connection between the ER and mitochondria, and one of the main functions of MAM is to promote oxidative protein production in the ER. SYNJ2BP is one of the key proteins that make up the MAM, and we found that SYNJ2BP is essential for EIAV replication. We therefore constructed a SYNJ2BP knockout HEK293T cell line in which the number of MAMs is significantly reduced. Moreover, overexpression of SYNJ2BP could increase the number of MAMs. Our study demonstrates that SYNJ2BP can improve the infectivity of the EIAV virus with elevated production of the viral Env protein through increased MAM formation. Interestingly, SYNJ2BP was able to improve the production of not only EIAV Env but also HIV. Further investigation showed that MAMs can provide more ATP and calcium ions, which are essential factors for Env production, to the ER and can also reduce ER stress induced by HIV or EIAV Envs to increase the Env production level in cells. These results may help us to understand the key production mechanisms of lentiviral Env. IMPORTANCE Lentiviral Env proteins, which are rich in disulfide bonds, need to be fully folded in the ER; otherwise, misfolded Env proteins will induce ER stress and be degraded by ER-associated protein degradation (ERAD). To date, it is still unclear about Env production mechanism in the ER. MAM is the structure of closely connection between the ER and mitochondria. MAMs play important roles in the calcium steady state and oxidative stress, especially in the production of oxidative protein. For the first time, we found that SYNJ2BP can promote the production of lentiviral Env proteins by providing the ATP and calcium ions required for oxidative protein production in the ER and by reducing ER stress through facilitating formation of MAMs. These studies shed light on how MAMs improve lentiviral Env production, which will lay the foundation for the study of replication mechanisms in other lentiviruses from the perspective of the cellular organelle microenvironment.

Keywords: EIAV; HIV; SYNJ2BP; endoplasmic reticulum; envelope protein; lentivirus; mitochondria; mitochondrion-associated endoplasmic reticulum membrane.


Conflict of interest statement

The authors declare no conflict of interest.

Figures

FIG 1
FIG 1
Alterations of SYNJ2BP in equine monocyte-derived macrophages (eMDMs) following infection with EIAV and the effects of infection on virus replication. (A) SYNJ2BP mRNA expression increased post-EIAV infection. eMDMs were infected with EIAV(EIAVDLV34) at 2 × 104 50% tissue culture infective doses (TCID50). The viral replication level was determined by the detection of reverse transcriptase (RT) activity. The transcription levels of SYNJ2BP and β-actin were quantified by qPCR. The numbers of SYNJ2BP mRNA copies were normalized to those of β-actin. The data represent the means ± the SEM from three independent experiments. The yellow and blue columns represent the SYNJ2BP mRNA fold change and the EIAV RT activity, respectively. (B) Decreases in SYNJ2BP mRNA levels lead to decreases in EIAV replication efficiency. The virus from NC and SYNJ2BP siRNA knockdown eMDMs infected with 2 × 104 TCID50 EIAV were analyzed by assessment of RT activity at 1, 2, 3, 4, and 5 days postinfection (left y axis, blue curve, NC siRNA transfection group; green curve, SYNJ2BP siRNA transfection group). Meanwhile, the fold change in levels of SYNJ2BP mRNA (right y axis, red curve) in eMDMs after siRNA knockdown was measured using qPCR at 1, 2, 3, 4, and 5 days posttransfection. The data represent the means ± the SEM from three independent experiments. (C) Proximity ligation assay (PLA) to quantify the overlap between mitochondria and ER (MAM) through detection of the endogenous marker proteins Tom20 (mitochondria) and KDEL (ER) in eMDMs after SYNJ2BP siRNA knockdown. The red dots represent the interactions between Tom20 and KDEL in situ (at distances of <40 nm); DAPI staining (blue) was performed to visualize nuclei (scale bar, 2 μm). The number of red dots (blobs/nucleus) is presented by the histogram. The data represent the means ± the SEM from 30 cells in three independent experiments (***, P < 0.001). (D) Confocal fluorescence imaging of the overlap between mitochondria and ER (MAM) detecting the endogenous marker proteins Tom20 (mitochondria) and KDEL (ER) in eMDMs after SYNJ2BP siRNA knockdown. At 2 days after siRNA transfection, the cells were fixed and stained with anti-Tom 20 and anti-KDEL antibodies to detect Tom20-KDEL (Alexa Fluor 549 [AF549] and AF488 readout); DAPI staining (blue) was performed to visualize nuclei (scale bar, 10 μm). Ten visual fields for each group were examined. (E) NC and SYNJ2BP siRNA knockdown eMDMs infected with 2 × 104 TCID50 of EIAV were analyzed by Western blotting. Cell lysate and virion-containing supernatants were analyzed using Western blotting to detect the intensity of viral Env and p26 (EIAV CA) protein bands, respectively, at 72 h postinfection. The results of the densitometry analysis to quantify the ratio of Env to p26 are shown at the bottom (lane 1 set as 1.0). This experiment was performed three times.
FIG 2
FIG 2
Assay of MAMs in cells overexpressing SYNJ2BP or KO HEK293T cells. (A) Wild-type HEK293T cells (WT 293T) were transfected with plenti-CRISPRv2GFP vector (a plasmid expressing GFP and Cas9) and gRNAs targeting SYNJ2BP to generate SYNJ2BP knockout cells (ΔSYN). The endogenous proteins from WT 293T cells and ΔSYN cells were identified using Western blotting with antibodies against β-actin and SYNJ2BP. 5H6 and 3D2 represent two different KO cell clones. This experiment was performed three times. A histogram representing cell viability is shown. The viability of WT and ΔSYN 293T cells was assessed using a Cell Counting Kit-8 (CCK8), in which WST-8 [2-(2-methoxy-4-nitrophenyl)-3-(4-nitrophenyl)-5,2,(4-disulfophenyl)-2H-tetrazolium, monosodium salt] produces a water-soluble formazan dye upon reduction in the presence of an electron mediator. The data represent the means ± the SEM from three independent experiments (NS, P > 0.05). (B) Electron micrographs of changes in the connections between mitochondria and the ER in SYNJ2BP-Flag overexpression (SYN-Flag) and ΔSYN 293T cells. In the images, the red arrows indicate the connections between mitochondria and ERs (MAMs), and the white arrows indicate the part of the ER not connected to mitochondria. Compared to WT cells, more connections (MAMs) can be seen in SYN-Flag cells, and fewer connections (MAMs) can be seen in ΔSYN cells. The lengths of connections between mitochondria and the ER are presented in the histogram. The data represent the means ± the SEM from 15 cells of three independent experiments (**, P < 0.01; *, P < 0.05). (C and D) Proximity ligation assay to quantify the overlap between mitochondria and the ER (MAMs). The endogenous marker proteins VDAC (mitochondria) and IP3R (ER) were detected in NC and SYN-Flag 293T cells (C) or WT and ΔSYN 293T cells (D). The red dots represent interactions between VDAC and IP3R in situ (at distances <40 nm). DAPI staining (blue) was performed to visualize nuclei (scale bar, 10 μm). The numbers of red dots (blobs/nucleus) are presented in the histogram. The data represent the means ± the SEM from 30 cells in three independent experiments (*, P < 0.05). (E) WT and ΔSYN 293T cells transfected with empty vector or SYN-Flag were fixed and incubated together with anti-RRBP1 (ER) and anti-Tom20 (mitochondria) antibodies, followed by staining with secondary antibodies coupled to a fluorochrome. The signal was detected using a direct stochastic optical reconstruction microscopy (dSTORM) method. Single-molecule localization data from stained sections were captured and processed using high resolution light microscopy (ELYRA PS.1; Zeiss; scale bar, 10 μm). This experiment was performed three times.
FIG 3
FIG 3
Analysis of EIAV replication in cells overexpressing SYNJ2BP or KO HEK293T cells. (A) 293T cells were cotransfected with EIAV infectious clone (EIAVCMV3-8) and empty vector or SYN-Flag in three doses. (B) WT and ΔSYN 293T cells were cotransfected with EIAVCMV3-8 and empty vector or SYN-Flag. For panels A and B, cell lysates and virion-containing supernatants were analyzed by Western blotting to detect the intensity of viral Env and p26 (EIAV CA) protein bands at 48 hpt. This experiment was performed three times. The results of the densitometry analysis to quantify the ratio of Env to p26 are shown at the bottom (lane 1 set as 1.0). (C) PLA to quantify the overlap between mitochondria and ER (MAM) in WT and ΔSYN 293T cells cotransfected with EIAVCMV3-8 and empty vector or SYN-Flag. The red dots represent the interactions between VDAC and IP3R in situ (at distances of <40 nm); DAPI staining (blue) was performed to visualize nuclei (scale bar, 10 μm). The number of red dots (blobs/nucleus) is presented in the histogram. The data represent the means ± the SEM from 30 cells in three independent experiments (***, P < 0.001). (D) Overexpression of SYNJ2BP increased the infectivity of a luciferase-expressing HIV-EIAV pseudotyped reporter virus. HEK293T cells were cotransfected with either SYN-Flag or an empty vector, the HIV-1 luciferase reporter proviral vector pNL4–3-lucΔVifΔEnv and pcDNA3.1-Env (EIAV). Cell lysate was analyzed by using Western blotting to detect the intensity of the EIAV Env and HIV CA (p24) protein bands at 48 hpt. Equal numbers of virions in the supernatant were used to infect a HEK293T cell line consistently expressing the equine lentiviral receptor 1 (ELR1) to determine the infectivity of the HIV-EIAV pseudotyped virus. (E) Knockout of SYNJ2BP reduced infectivity of a luciferase-expressing HIV-EIAV pseudotyped reporter virus. ΔSYN or WT HEK293T cells were transfected with HIV-1 luciferase reporter proviral vector pNL4-3-lucΔVifΔEnv and pcDNA3.1-Env (EIAV). Cell lysates and viral infectivity were analyzed as described previously (see panel D). The results of the densitometry analysis to quantify the ratio of Env to β-actin are shown at the bottom (lane 1 set as 1.0). The data in panels D and E represent the means ± the SEM from three independent experiments (***, P < 0.001).
FIG 4
FIG 4
Assay of expression levels of EIAV viral proteins in cells overexpressing SYNJ2BP or KO HEK293T cells. (A to C) Overexpression of SYNJ2BP can promote the production of EIAV Env but not Gag or Rev. HEK293T cells were cotransfected with plasmids, either pcDNA3.1-Flag-SYNJ2BP in three doses or an empty plasmid and pcDNA3.1-Env (EIAV), or pcDNA3.1-Flag-SYNJ2BP and VR1012-Gag (EIAV) or pcDNA3.1-rev-HA (EIAV). Cell lysates were analyzed by using Western blotting to detect the intensity of the EIAV Env or Gag or Rev protein band at 48 hpt. This experiment was performed three times. (D to F) Knockout of SYNJ2BP reduced production of EIAV Env but not Gag or Rev. (D) Empty plasmid or pcDNA3.1-Flag-SYNJ2BP was cotransfected into WT or ΔSYN HEK293T cells, together with pcDNA3.1-Env (EIAV). (E and F) WT and ΔSYN HEK293T cells were transfected with VR1012-Gag (EIAV) or pcDNA3.1-rev-HA (EIAV). Cell lysates were analyzed as in panels A to C. The results of the densitometry analysis to quantify the ratio of Env, Gag, or Rev to β-actin are shown at the bottom (lane 1 set as 1.0). This experiment was performed three times.
FIG 5
FIG 5
Assay of expression levels of HIV proteins in cells overexpressing SYNJ2BP or KO HEK293T cells. (A to C) Overexpression of SYNJ2BP can promote the production of HIV Env but not that of Gag or Rev. HEK293T cells were cotransfected with plasmids, either pcDNA3.1-Flag-SYNJ2BP in three doses, or an empty plasmid and pcDNA3.1-Env-HA (HIV-1), or pcDNA3.1-Flag-SYNJ2BP and VR1012-Gag-HA (HIV-1), or pcDNA3.1-Rev-HA (HIV-1). Cell lysates were analyzed by using Western blotting to detect the intensity of the HIV Env or Gag or Rev protein band at 48 hpt. This experiment was performed three times. (D to F) Knockout of SYNJ2BP reduced production of HIV Env but not Gag and Rev. (D) Empty plasmid or pcDNA3.1-Flag-SYNJ2BP was cotransfected into WT or ΔSYN HEK293T cells, together with pcDNA3.1-Env-HA (HIV-1). (E and F) WT and ΔSYN HEK293T cells were transfected with VR1012-Gag-HA (HIV-1) or pcDNA3.1-Rev-HA (HIV-1). Cell lysates were analyzed as in panels A to C. The results of the densitometry analysis to quantify the ratio of Env, Gag, or Rev to β-actin are shown at the bottom (lane 1 set as 1.0). This experiment was performed three times.
FIG 6
FIG 6
ATP and Ca2+ restore EIAV Env production in SYNJ2BP KO HEK293T cells. (A) Extraction of the same amounts of ER from cells overexpressing SYNJ2BP and KO cells. The ER extraction process is described in Materials and Methods. The lysates from the cytoplasm (Cyt) and the ER were analyzed by using Western blotting to detect the ER internal reference protein calnexin. (B or C) Supplementation of the cell culture with ATP or CaCl2 can increase the levels of ATP or Ca2+ in the ER in SYNJ2BP KO HEK293T cells, as presented by the histogram. The detection of levels of ATP or Ca2+ in the ER is described in Materials and Methods. The data represent the means ± the SEM from three independent experiments (***, P < 0.001; **, P < 0.05). EIAV Env production in WT or SYNJ2BP KO HEK293T cells with or without supplement of ATP or CaCl2 was measured by Western blotting. The results of the densitometry analysis to quantify the ratio of Env to β-actin are shown at the bottom (lane 1 set as 1.0).
FIG 7
FIG 7
SYNJ2BP reduces ER stress induced by EIAV or HIV Env. (A) EIAV Env can induce increases in protein expression levels of the ER stress marker Grp78 in a dose-dependent manner. HEK293T cells were transfected with either pcDNA3.1-Env (EIAV) plasmids in two doses or an empty plasmid, and Tu or Tg (2 μg/mL) was used as a positive control for ER stress activation. Cell lysates were analyzed by Western blotting to detect the intensity of the Grp78 protein band at 48 hpt. The results of the densitometry analysis to quantify the ratio of Grp78 to β-actin are shown at the bottom (lane 1 set as 1.0). This experiment was performed three times. (B) EIAV Env can induce increases in mRNA levels of the ER stress marker Grp78. HEK293T cells were transfected with either pcDNA3.1-Env (EIAV) plasmids or an empty plasmid. Total RNA was isolated, and the transcriptional levels of Grp78 were measured by qPCR at 48 hpt. Fold change values were calculated according to the 2–ΔΔCT method using β-actin as an internal reference gene. The data represent the means ± the SEM from three independent experiments (**, P < 0.01). (C) EIAV Env was degraded through the ERAD pathway. KIF restores EIAV Env expression in HEK293T cells. HEK293T cells were transfected with plasmid pcDNA3.1-Env (EIAV) in treatment with KIF (100 μM) or without KIF. Cells were lysed, and EIAV Env expression levels were determined by Western blotting. The results of the densitometry analysis to quantify the ratio of Env to β-actin are shown at the bottom (lane 1 set as 1.0). This experiment was performed three times. (D) SYNJ2BP overexpression can reduce high expression levels of Grp78 induced by EIAV Env. HEK293T cells were cotransfected with either pcDNA3.1-Flag-SYNJ2BP plasmids or an empty plasmid, and pcDNA3.1-Env (EIAV) or an empty plasmid, and Tu (2 μg/mL) was used as a positive control for ER stress activation. Cell lysates were analyzed using Western blotting to detect the intensity of the Grp78 or SYNJ2BP-Flag protein bands at 48 hpt. The results of the densitometry analysis to quantify the ratio of Grp78 to β-actin are shown at the bottom (lane 1 set as 1.0). This experiment was performed three times. (E) SYNJ2BP overexpression can reduce high expression levels of Grp78 induced by HIV Env. HEK293T cells were cotransfected with either pcDNA3.1-Flag-SYNJ2BP plasmids or an empty plasmid, and pcDNA3.1-Env-HA (HIV-1) or an empty plasmid, and Tu (2 μg/mL) was used as a positive control for ER stress activation. Cell lysates were analyzed using Western blotting to detect the intensity of the Grp78 or SYNJ2BP-Flag protein bands at 48 hpt. The results of the densitometry analysis to quantify the ratio of Grp78 to β-actin are shown at the bottom (lane 1 set as 1.0). This experiment was performed three times.
FIG 8
FIG 8
Schematic diagrams demonstrating the role of SYNJ2BP in the regulation of the ER microenvironment via MAM formation to improve production of the lentiviral Env protein. The MAMs formed by the connection of SYNJ2BP and RRBP1 can not only increase the levels of ATP and Ca2+ in the ER, which improves production of the lentiviral Env protein, but also reduce ER stress induced by the lentiviral Env protein.

Similar articles

Cited by

References

    1. Leroux C, Cadore JL, Montelaro RC. 2004. Equine infectious anemia virus (EIAV): what has HIV’s country cousin got to tell us? Vet Res 35:485–512. 10.1051/vetres:2004020. - DOI - PubMed
    1. Eisinger RW, Fauci AS. 2018. Ending the HIV/AIDS pandemic. Emerg Infect Dis 24:413–416. 10.3201/eid2403.171797. - DOI - PMC - PubMed
    1. Craigo JK, Montelaro RC. 2011. Equine infectious anemia virus infection and immunity: lessons for aids vaccine development. Future Virol 6:139–142. 10.2217/fvl.10.85. - DOI - PMC - PubMed
    1. Checkley MA, Luttge BG, Freed EO. 2011. HIV-1 envelope glycoprotein biosynthesis, trafficking, and incorporation. J Mol Biol 410:582–608. 10.1016/j.jmb.2011.04.042. - DOI - PMC - PubMed
    1. Cook RF, Leroux C, Issel CJ. 2013. Equine infectious anemia and equine infectious anemia virus in 2013: a review. Vet Microbiol 167:181–204. 10.1016/j.vetmic.2013.09.031. - DOI - PubMed

Publication types