. 2022 Dec 5;221(12):e202111137.
doi: 10.1083/jcb.202111137. Epub 2022 Oct 5.

Coordinated metabolic transitions and gene expression by NAD+ during adipogenesis

Affiliations

Coordinated metabolic transitions and gene expression by NAD+ during adipogenesis

Edgar Sánchez-Ramírez et al. J Cell Biol. .

Abstract

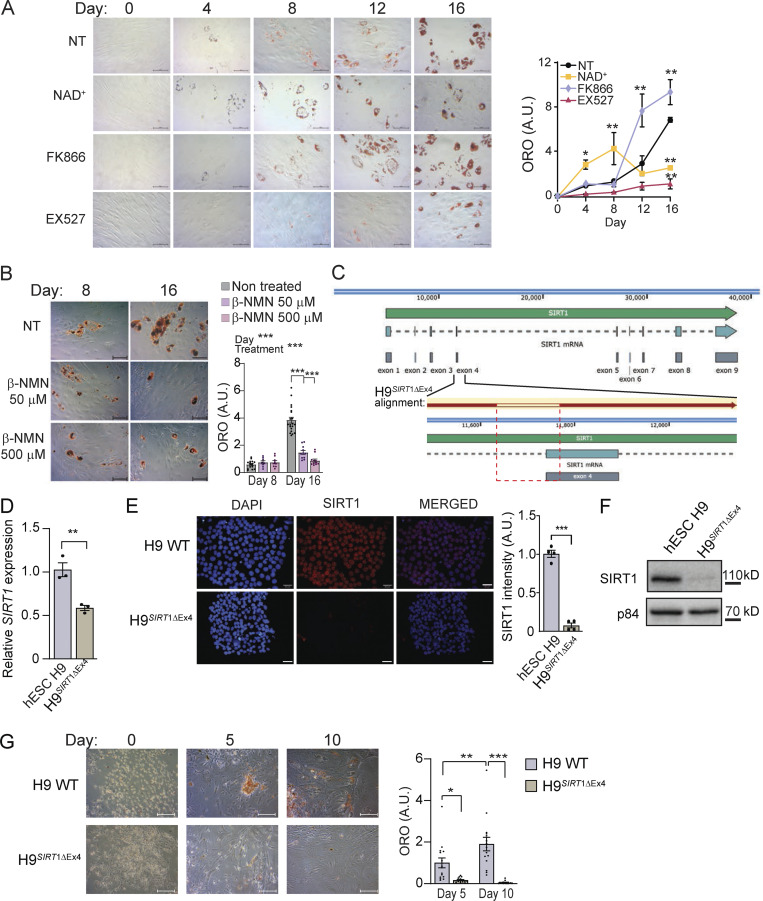
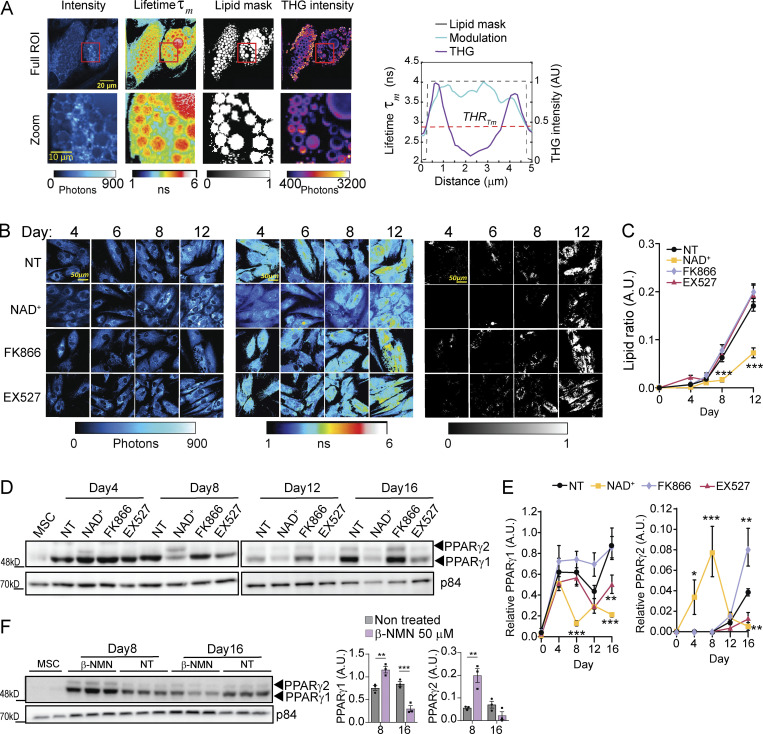
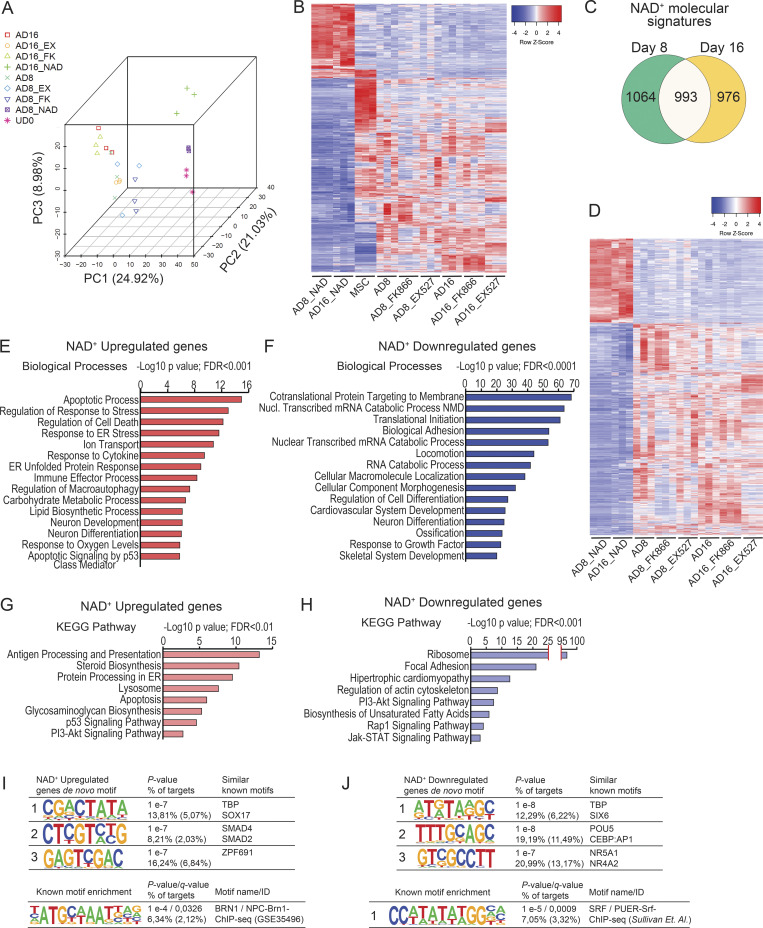
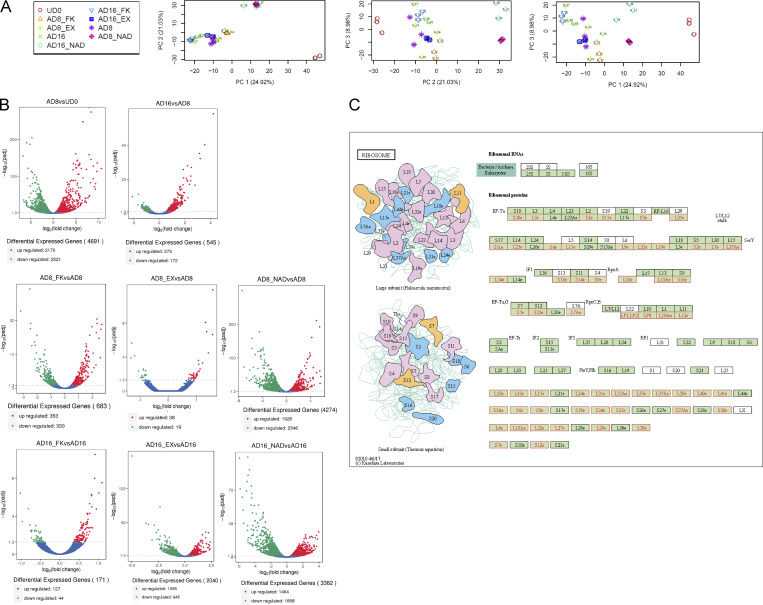
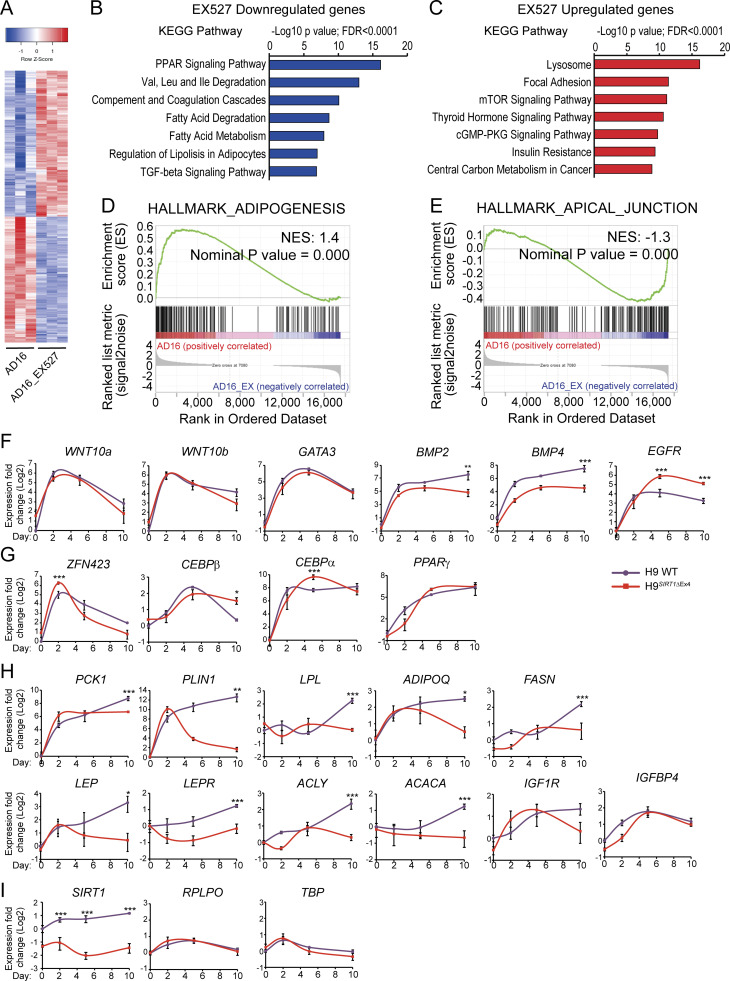
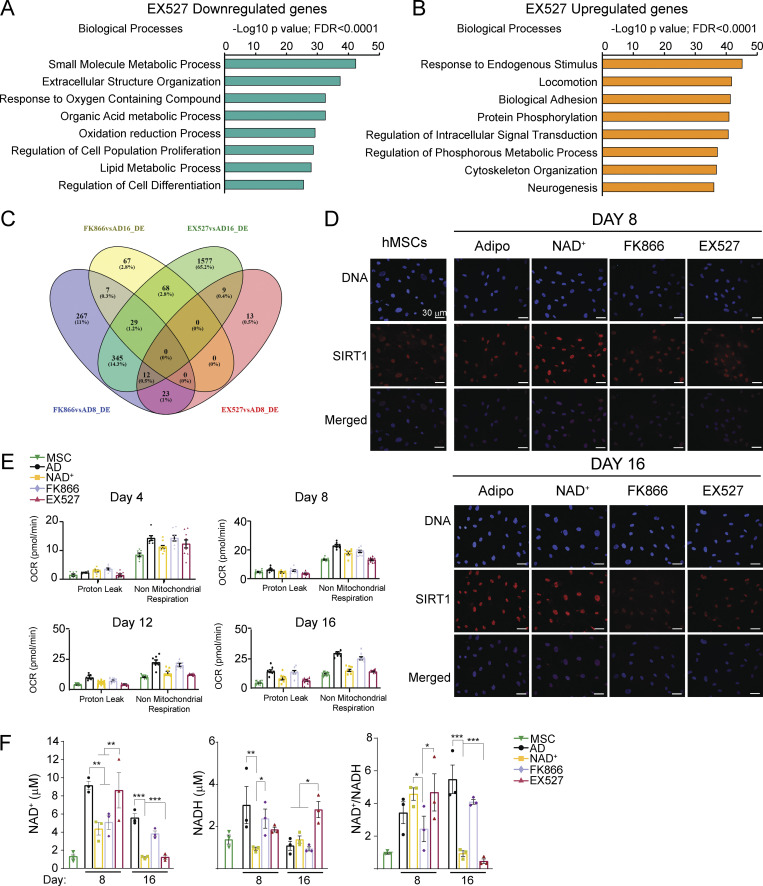
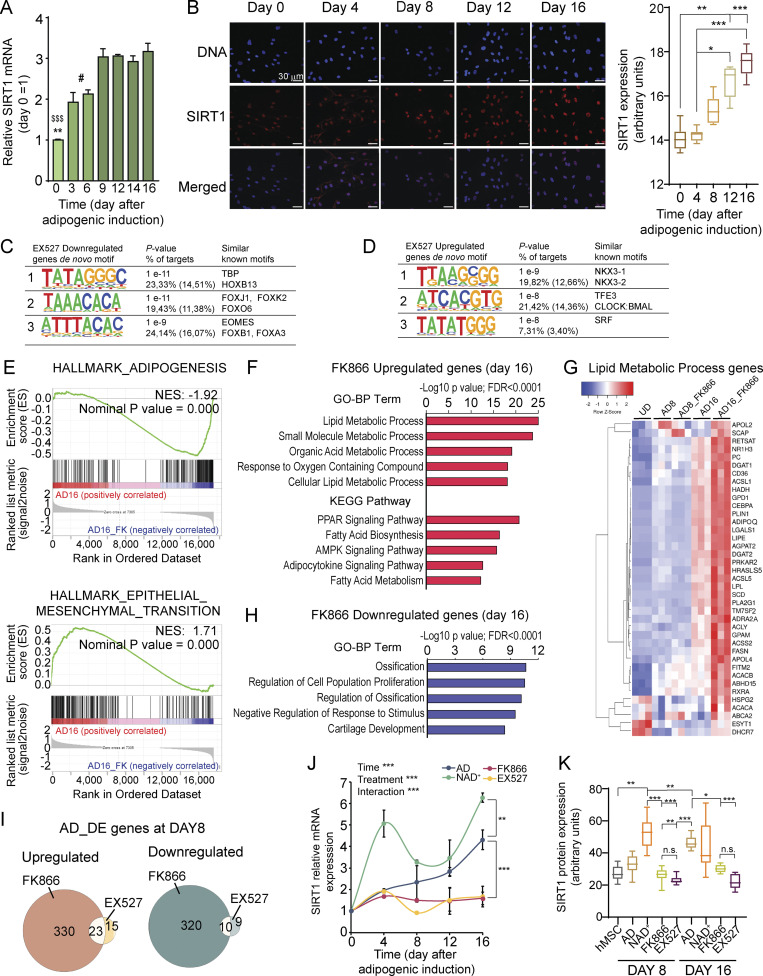
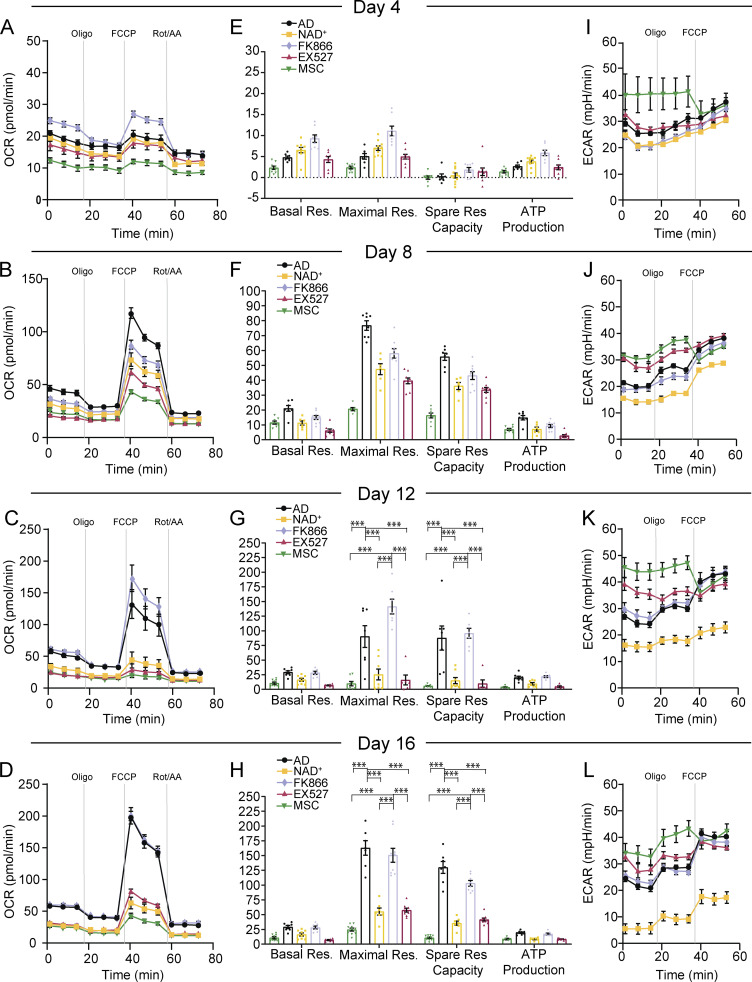
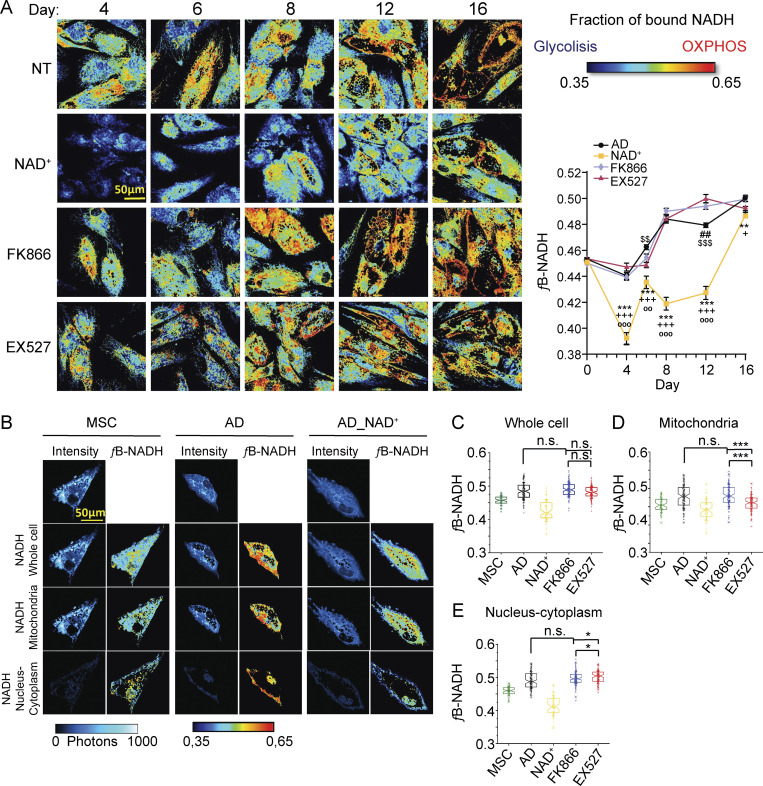
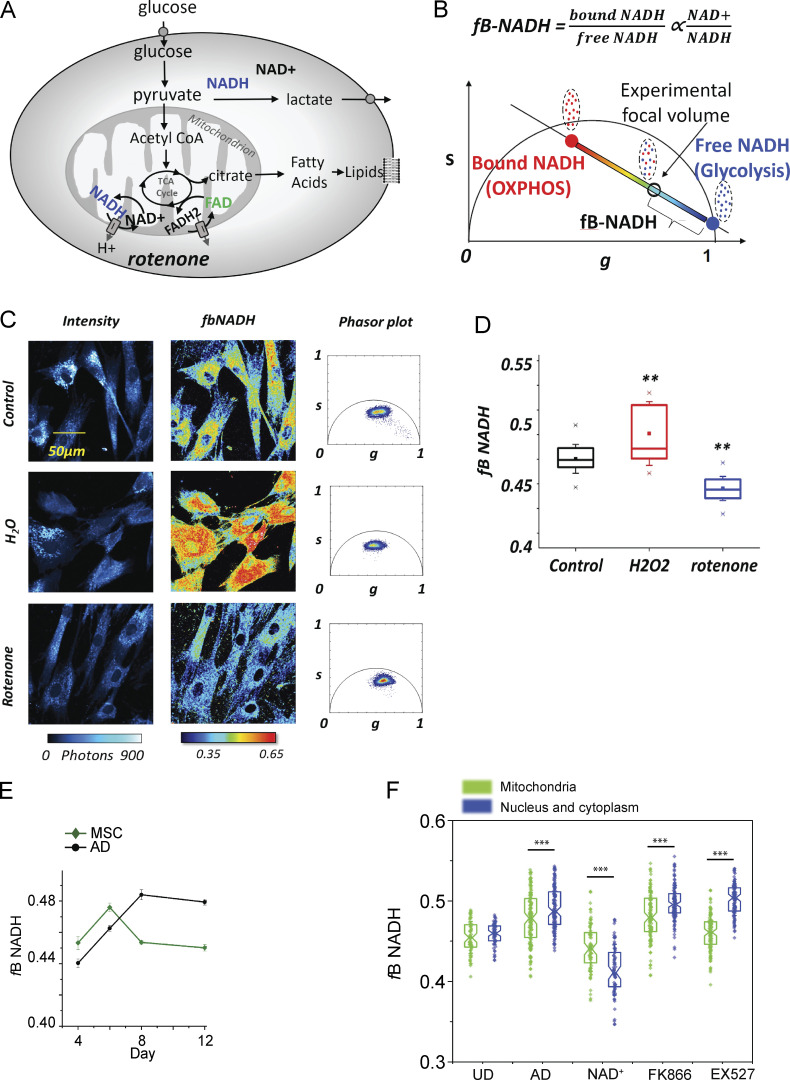
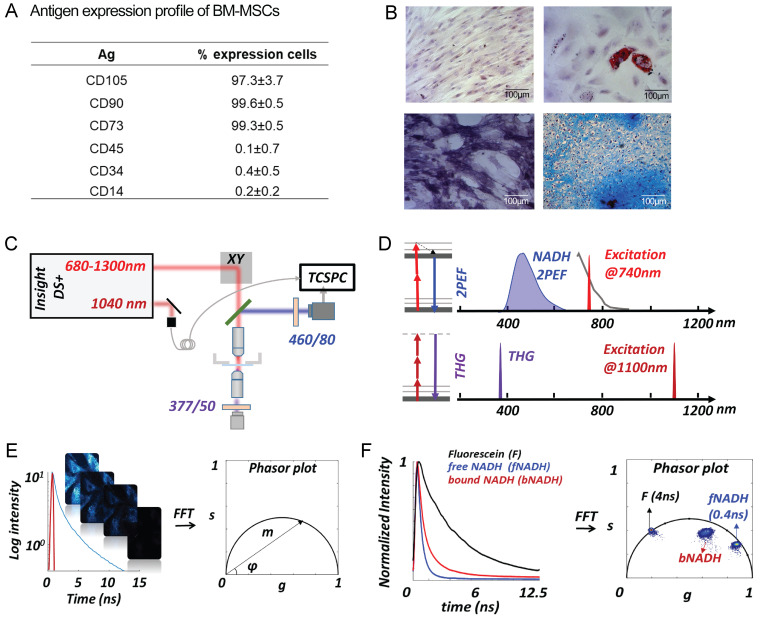
Adipocytes are the main cell type in adipose tissue, which is a critical regulator of metabolism, highly specialized in storing energy as fat. Adipocytes differentiate from multipotent mesenchymal stromal cells (hMSCs) through adipogenesis, a tightly controlled differentiation process involving close interplay between metabolic transitions and sequential programs of gene expression. However, the specific gears driving this interplay remain largely obscure. Additionally, the metabolite nicotinamide adenine dinucleotide (NAD+) is becoming increasingly recognized as a regulator of lipid metabolism, and a promising therapeutic target for dyslipidemia and obesity. Here, we explored how NAD+ bioavailability controls adipogenic differentiation from hMSC. We found a previously unappreciated repressive role for NAD+ on adipocyte commitment, while a functional NAD+-dependent deacetylase SIRT1 appeared crucial for terminal differentiation of pre-adipocytes. Repressing NAD+ biosynthesis during adipogenesis promoted the adipogenic transcriptional program, while two-photon microscopy and extracellular flux analyses suggest that SIRT1 activity mostly relies on the metabolic switch. Interestingly, SIRT1 controls subcellular compartmentalization of redox metabolism during adipogenesis.


Figures

Figure 1.
Figure 1.
NAD+-SIRT1 pathway shapes adipogenic differentiation and lipid accumulation in hMSC. Adipogenic differentiation was induced in hMSC in the absence or presence of the indicated drugs: NAD+ (5 mM), FK866 (1 nM), the SIRT1-specific inhibitor EX527 (50 μM), or β-NMN (50 or 500 μM), as indicated. (A and B) Neutral lipids were stained with ORO at the indicated days after adipogenic induction, and representative images are shown. Quantification was performed by densitometry from n = 4 technical and 3 biological replicates. Scale bars are for 50 μm. (C) Targeted mutation of the exon 4 in SIRT1 gene using a CRISPR-Cas9 strategy in H9 hESCs. The structure of the locus is represented together with the alignment of the sequence in the H9SIRT1ΔEx4 (red arrow), and the deleted is indicated within the red dashed rectangle. (D) SIRT1 mRNA expression in H9 WT and H9SIRT1ΔEx4 cells measured by qRT-PCR. Data were normalized to Tbp expression, and H9 data were set to 1. (E and F) SIRT1 protein expression in H9 WT and H9SIRT1ΔEx4 cells was analyzed by immunofluorescence with scale bars for 30 μm (E) or Western blot (F). (G) Neutral lipids were stained with ORO at the indicated days after adipogenic induction in hESC, and representative images are shown. Quantification was performed by densitometry from n = 10 technical and 3 biological replicates. Scale bars are for 50 μm. For all graphs, data are presented as mean ± SEM (*P < 0.05, **P < 0.01, ***P < 0.001, two-way ANOVA with Tukey’s or Bonferroni’s post-test). Source data are available for this figure: SourceData F1.
Figure 2.
Figure 2.
NAD+ hinders lipid accumulation and PPARγ expression during adipogenesis in hMSCs. (A) Representative images from label-free quantification of lipid droplets by FLIM of an adipocyte at terminal differentiation. Intensity, modulation lifetime tauM (τm) lipid mask determined by a τm threshold, and THG intensity are shown as indicated. The graph on the right shows a cross-sectional profile of lipid mask created by a τm threshold and THG signal of one lipid droplet of 5 µm diameter. (B) Representative images of intensity (left), modulation lifetime tm (middle), and lipid mask (right) of hMSCs during adipogenic differentiation at the indicated days of culture under selected treatments. (C) Quantification from lipid ratio at indicated days and treatments during the differentiation process of hMSC. n = 14 single cells; experiments were conducted in triplicate. (D and F) PPARγ1 and PPARγ2 protein expression levels were measured by Western blot in whole-cell extracts at the indicated days after adipogenic induction. p84 was used as loading control. (E) Quantification of PPARγ1 and PPARγ2 protein expression, normalized to p84 loading control. n = 3 biological replicates. For all graphs, data are presented as mean ± SEM (*P < 0.05, **P < 0.01, ***P < 0.001, two-way ANOVA with Tukey’s post-test). Source data are available for this figure: SourceData F2.
Figure S1.
Figure S1.
Image processing workflow for FLIM and Lipid and NADH segmentation. (A) Workflow of FFT-based Phasor analysis of FLIM images. (B) Workflow of subcellular segmentation based on lifetime and intensity thresholds. A threshold on modulation lifetime (THR [m] = 2.87 ns) is applied to separate lipid droplets and NADH in entire cell. The pixels of the FLIM image with τm > THR (m) (black points in the Phasor plot) are assigned to lipid droplets while the pixels with τm < THR (m) (gray points in the Phasor plot) are assigned to the NADH signal in the rest of the cell. A threshold (150 photons) on intensity of cell NADH is applied to segment mitochondria and nucleus plus cytoplasm. The pixels with intensity > THR (I) are assigned to mitochondria while pixels with intensity < THR (I) are assigned to the cytoplasm and nucleus. (C) PPARγ1 and PPARγ2 protein expression levels were measured by Western blot in whole cell extracts from hMSC untreated (NT) or treated with the indicated compounds for 16 d. Terminally differentiated adipocytes (ADIPO) were also included. p84 was used as loading control. Source data are available for this figure: SourceData FS1.
Figure 3.
Figure 3.
NAD+ treatment during adipogenesis from hMSC induces profound and specific changes in the transcriptome. (A) RNA-seq was performed per triplicate from multipotent hMSC (MSC, UD0), or at days 8 (AD8) and 16 (AD16) after adipogenic induction in the absence (AD8, AD16) or presence of 5 mM NAD+ (AD8_NAD, AD16_NAD), 1 nM FK866 (AD8_FK866, AD16_FK866) or 50 mM EX527 (AD8_EX527, AD16_EX527). PCA was computed for the whole data. (B–D) Heatmap comparing expression from 660 genes DE exclusively in NAD+-treated cells (FDR-adjusted P value <0.05). (C) Overlap of DE transcripts between NAD+-treated cells and the rest of the tested conditions at day 8 and day 16 after adipogenic induction. (D) Heatmap comparing expression from 994 genes DE exclusively in NAD+-treated cells at both days 8 and 16 after adipogenic induction when compared with the rest of the samples. (E–H) Functional annotation of the 994 DE genes constituting the NAD+ transcriptional signature: biological processes (E and F) or KEGG pathways (G and H) for consistently upregulated (E and G) or downregulated (F and H) transcripts. (I and J) Homer de novo motif discovery analyses from promoters of genes specifically upregulated (I) or downregulated (J) after NAD+ treatment during adipogenic induction.
Figure S2.
Figure S2.
RNA-seq data analyses. (A) PCA were computed and plotted in two-dimensional PCA score plots, showing clustering of UD hMSC vs. differentiated cells (top), NAD+-treated (AD8_NAD, AD16_NAD) vs. untreated cells (middle), and day 8 (adipocyte commitment) vs. day 16 (terminally differentiated adipocytes; bottom). (B) Volcano plots show DE genes from the indicated comparisons (FDR-adjusted P value <0.05). (C) Illustration of the Ribosomal Pathway according to the KEGG. Ribosomal components are illustrated (left) and listed (right). Ribosomal proteins whose mRNA expression was consistently downregulated by NAD+ treatment during adipogenesis are highlighted in red.
Figure 4.
Figure 4.
SIRT1 activity is essential for terminal differentiation of pre-adipocytes. (A) Heatmap comparing expression from 2,040 genes DE between EX527-treated cells (50 mM) and untreated cell at day 16 after adipogenic induction on hMSC. (B and C) FDR-adjusted P value <0.05. KEGG pathway enrichment analyses from genes downregulated (B) or upregulated (C) by EX527 treatment during adipogenic differentiation, at day 16 after induction, compared with untreated, terminally differentiated adipocytes. (D and E) GSEA investigated within the MSigDB “Hallmark” gene set collection. Genes were rank-ordered by differential expression between terminally differentiated adipocytes untreated (AD16) or treated with EX527 (AD16_EX). (F–I) Gene expression from H9 WT and H9SIRT1ΔEx4 cells was measured by qRT-PCR at days 0, 2, 5, and 10 after adipogenic induction. Genes involved in pre-adipocyte commitment (F), PPARg expression (G), lipid metabolism and adipocyte markers (H), and control genes (I) were analyzed from three biological replicates. Relative expression to Tbp or Hrpt housekeeping genes was obtained and normalized to H9 at day 0 = 1. Data were converted to Log2 scale and fold change is presented. Graphs show mean ± SEM (*P < 0.05, **P < 0.01, ***P < 0.001, two-way ANOVA with Bonferroni’s post-test).
Figure S3.
Figure S3.
Transcriptional and metabolic rewiring during adipogenic differentiation triggered by SIRT1 or NAMPT inhibition. (A and B) Biological processes enrichment analyses from genes downregulated (A) or upregulated (B) by EX527 treatment during adipogenic differentiation, at day 16 after induction, compared with untreated, terminally differentiated adipocytes. (C) Venn diagram shows overlapping DE genes between indicated comparisons: FK866vsAD8_DE and FK866vsAD16_DE: mRNA was analyzed from cells during adipogenic differentiation (day 8 or day 16) from untreated (AD) or treated with 1 nm FK866 during differentiation. EX527vsAD8_DE and EX527vsAD16_DE: mRNA was analyzed from cells during adipogenic differentiation (day 8 or day 16) from untreated (AD) or treated with 50 mM EX527 during differentiation. (D) SIRT1 protein levels and subcellular localization were analyzed by immunofluorescence at days 8 and 16 after adipogenic induction on hMSC. Cells were either untreated (Adipo) or treated with the indicated compounds. n = 2 biological and 7 technical replicates. Scale bars represent 30 μm. (E) Mitochondrial bioenergetic parameters calculated from extracellular flux analyses: Proton leak and non-mitochondrial respiration. (F) Total NAD+ and NADH were measured at days 8 and 16 after adipogenic induction in hMSCs from three biological replicates. Data are represented by mean ± SEM. Two-way ANOVA followed by Tukey’s post-test. *P < 0.05, **P < 0.01, ***P < 0.001. AD, adipogenic-induced cells; NAD+, adipogenic-induced cells treated with 5 mM NAD+; FK866, adipogenic-induced cells treated with 1 nM FK866; EX527, adipogenic-induced cells treated with 50 mM EX527; MSC, untreated, undifferentiated hMSC.
Figure 5.
Figure 5.
The NAD+ salvage pathway is dispensable for adipogenesis. (A) SIRT1 gene expression levels were assessed by RT-qPCR at the indicated days after adipogenic induction on hMSC. n = 3 biological and 2 technical replicates. One-way ANOVA followed by Tukey’s post-test. *P < 0.05, **P < 0.01, ***P < 0.001. Symbol key for multiple comparisons: *: day 0 vs. days 3, 6; $: day 0 vs. days 9–16; #: days 3, 6 vs. days 9–16. (B) SIRT1 protein expression and subcellular location were explored by immunofluorescence at the indicated days after adipogenic induction on hMSC. Scale bars represent 30 μm. Boxplot shows densitometric analyses from n = 2 biological and 7 technical replicates. Kruskal-Wallis test followed by Dunn’s multiple comparisons test was applied. *P < 0.05, **P < 0.01, ***P < 0.001. (C and D) Homer de novo motif discovery analyses from promoters of genes downregulated (C) or upregulated (D) by EX527 treatment during adipogenic induction, at terminal differentiation (day 16). (E) GSEA was investigated within the MSigDB “Hallmark” gene set collection. Genes were rank-ordered by differential expression between terminally differentiated adipocytes untreated (AD16) or treated with 1 nM FK866 (AD16_FK). (F) Functional annotation (biological processes [BP] and KEGG pathways) for 144 genes upregulated by FK866 treatment during adipogenesis, at terminal adipogenic differentiation (day 16). (G) Heatmap comparing expression levels between the indicated samples at day 16 from 39 genes involved in lipid metabolism. (H) Biological processes enriched in 44 genes downregulated by FK866 treatment during adipogenesis, at terminal differentiation (day 16). (I and J) Overlap of DE genes (up- or downregulated) comparing EX527 and FK866-treated cells during adipogenic induction, at day 8. (J) SIRT1 gene expression levels were assessed by RT-qPCR at the indicated days after adipogenic induction on hMSC either untreated (AD) or treated with the indicated drugs. n = 3 biological and 2 technical replicates. One-way ANOVA followed by Tukey’s post-test. **P < 0.01, ***P < 0.001. (K) Boxplot showing SIRT1 protein levels analyzed by immunofluorescence at days 8 and 16 after adipogenic induction on hMSC. Cells were either untreated (AD) or treated with the indicated compounds. Densitometric analyses are from n = 2 biological and 7 technical replicates. Kruskal-Wallis test followed by Dunn’s multiple comparisons test was applied. *P < 0.05, **P < 0.01, ***P < 0.001.
Figure 6.
Figure 6.
NAD+ impairs mitochondrial bioenergetics during adipogenic induction in hMSC. Analysis of OCR and ECAR was performed using Seahorse XF analyzer to assess mitochondrial respiration and lactate production from n = 3 biological replicates with 6–10 technical replicates each. (A–D) OCR was measured at days 4 (A), 8 (B), 12 (C), or 16 (D) after adipogenic induction in hMSC, in the absence or presence of the indicated treatments. With sequential addition of oligomycin (Oligo; complex V inhibitor), FCCP (a protonophore), and Rotenone/antimycin A (Rot/AA; complex III inhibitor). (E–H) Mitochondrial bioenergetic parameters were calculated from extracellular flux analyses: basal respiration, maximal respiratory capacity, spare respiratory capacity, and ATP production at the indicated days after adipogenic induction. Two-way ANOVA followed by Tukey’s post-test. ***P < 0.001. (I–L) ECAR was measured after serial addition of oligomycin and FCCP. Data is presented by mean ± SEM. AD: adipogenic-induced cells; NAD+, adipogenic-induced cells treated with 5 mM NAD+; FK866, adipogenic-induced cells treated with 1 nM FK866; EX527, adipogenic-induced cells treated with 50 mM EX527; MSC, untreated, undifferentiated hMSC.
Figure 7.
Figure 7.
Subcellular compartmentalization of NADH metabolism during adipogenesis depends on SIRT1 activity. (A) Representative images of fB_NADH of hMSCs during adipogenic differentiation at days 4, 6, 8, 12, and 16 of induction in the absence (NT) or presence of the indicated treatments: 5 mM NAD+, 1 nM FK866, or 50 μM EX527. Low fB_NADH (blue colors) corresponds to a cellular glycolytic phenotype, while high fB_NADH (red colors) corresponds to an OXPHOS phenotype. Quantification of fraction of bound NADH in each culture condition was performed from n = 14 single cells. Experiments were conducted per triplicate. Data are presented by mean ± SEM. * AD vs. NAD+; $ AD vs. EX527; # AD vs. FK866; + NAD+ vs. FK866; ° NAD+ vs. EX527. (B) Representative images of intensity and fB_NADH of hMSCs, pre-adipocytes (AD), and cells treated with NAD+ during adipogenic induction (AD_NAD+) imaged at day 8 of differentiation, show different spatial distributions of fraction of bound NADH in different cell compartments such as mitochondria, nucleus, and cytoplasm. (C–E) Quantification of fB_NADH in single cells at day 8 from hMSC (MSC), pre-adipocyte (AD), and cells treated with the indicated compounds during adipogenic differentiation. Quantification from n = 63–125 cells was performed in the whole cell (C), or the mitochondrial (D) and nuclear/cytoplasmic (E) subcellular compartment. Two-way ANOVA followed by Tukey’s post-test. *P < 0.05, **P < 0.01, ***P < 0.001.
Figure S4.
Figure S4.
Metabolic trajectories assessed by 2P-FLIM on NADH. (A) Schematic representation of cellular metabolism. Glucose breakdown through glycolysis and the TCA cycle generates reduced NADH and FADH2. Quiescent cells have a basal rate of glycolysis, converting glucose to pyruvate, which is then oxidized in the TCA cycle. As a result, the majority of ATP is generated by OXPHOS. Non-proliferating, differentiated cells are characterized by a low NADH/NAD+ ratio. During proliferation, the large increase in glycolytic flux rapidly generates ATP in the cytoplasm. Most of the resulting pyruvate are converted into lactate by lactate dehydrogenase A, which regenerates NAD+ from NADH. Proliferating cells are characterized by a high NADH/NAD+ ratio. Rotenone blocks the respiratory chain through complex I while H2O2 increase the NAD+:NADH ratio. (B) Metabolic trajectory between free NADH and bound NADH indicates a shift from a glycolytic to a OXPHOS cellular phenotype as free/bound NADH ratio corresponds to NAD+:NADH ratio. The fB_NADH of the experimental point is graphically calculated from the location of free NADH. (C) Representative images of intensity, fB_NADH, and Phasor plot of hMSCs with different treatments: control, rotenone (respiratory chain inhibitor), and H2O2 (induces oxidative stress). Accumulation of reduced NADH by blocking the respiration chain shifts the cellular metabolic signature toward free NADH, while oxidative stress shifts the cellular metabolic signature toward bound NADH. (D) Quantification of fraction of bound NADH in an ROI with different metabolic treatments. One-way ANOVA followed by Tukey’s post-test. **P < 0.01. (E) Quantification of fraction of bound NADH during adipogenic differentiation at with (black) or without adipogenic culture medium (dark green). (F) Data are presented as mean ± SEM. Quantification of fB_NADH in mitochondria (green) and in nucleus/cytoplasm (blue) in single cells at day 8 of adipogenic differentiation in the absence (AD) or in the presence of the indicated treatments. hMSC (UD) were also assessed. n = 63–125 cells; ***P < 0,001, Student’s t test.
Figure S5.
Figure S5.
hMSC characterization and experimental setup. (A) Expression cell markers in MSCs was determined by flow cytometry; data correspond to mean percentage of cells positive to each marker ± SD, n = 3 biological replicates. (B) hMSCs stained with toluidine blue (top left); adipogenic differentiation was determined by the presence of lipid vacuoles positive to ORO (top right); osteogenic differentiation was determined by alkaline phosphatase assay (bottom left); and chondrogenic differentiation was assessed by matrix positive to alcian blue in cryosections of micromasses (bottom right). n = 3 biological replicates. (C) Scheme of the experimental setup used for this work. (D) Principles of two-photon excitation fluorescence (2PEF) and THG. Two-photon excitation of NADH is performed at 740 nm with emission collected with band-pass filters centered at 460 nm, which resulted primarily from NADH. THG is performed at 1,100 nm, and the signal collected with a band-pass filter centered at 377 nm. (E) The multi-exponential fluorescence intensity decay in every pixel of the image is transformed with an FFT; the real (g) and imaginary (s) parts are plotted in the graphical Phasor plot. (F) Example of fluorescence intensity decay of fluorescein and free and bound NADH in solution and their locations in the Phasor plot.

Comment in

References

    1. Aguilar-Arnal, L., Ranjit S., Stringari C., Orozco-Solis R., Gratton E., and Sassone-Corsi P.. 2016. Spatial dynamics of SIRT1 and the subnuclear distribution of NADH species. Proc. Natl. Acad. Sci. USA. 113:12715–12720. 10.1073/pnas.1609227113 - DOI - PMC - PubMed
    1. Alonzo, C.A., Karaliota S., Pouli D., Liu Z., Karalis K.P., and Georgakoudi I.. 2016. Two-photon excited fluorescence of intrinsic fluorophores enables label-free assessment of adipose tissue function. Sci. Rep. 6:31012. 10.1038/srep31012 - DOI - PMC - PubMed
    1. Aprile, M., Ambrosio M.R., D'Esposito V., Beguinot F., Formisano P., Costa V., and Ciccodicola A.. 2014. PPARG in human adipogenesis: Differential contribution of canonical transcripts and dominant negative isoforms. PPAR Res. 2014:537865. 10.1155/2014/537865 - DOI - PMC - PubMed
    1. Bäckesjö, C.M., Li Y., Lindgren U., and Haldosén L.A.. 2006. Activation of Sirt1 decreases adipocyte formation during osteoblast differentiation of mesenchymal stem cells. Cells Tissues Organs. 189:93–97. 10.1159/000151744 - DOI - PubMed
    1. Berry, R., and Rodeheffer M.S.. 2013. Characterization of the adipocyte cellular lineage in vivo. Nat. Cell Biol. 15:302–308. 10.1038/ncb2696 - DOI - PMC - PubMed

Publication types