. 2022 Dec 5;221(12):e202203127.
doi: 10.1083/jcb.202203127. Epub 2022 Oct 5.

Membrane compartmentalization of Ect2/Cyk4/Mklp1 and NuMA/dynein regulates cleavage furrow formation

Affiliations

Membrane compartmentalization of Ect2/Cyk4/Mklp1 and NuMA/dynein regulates cleavage furrow formation

Shrividya Sana et al. J Cell Biol. .

Abstract

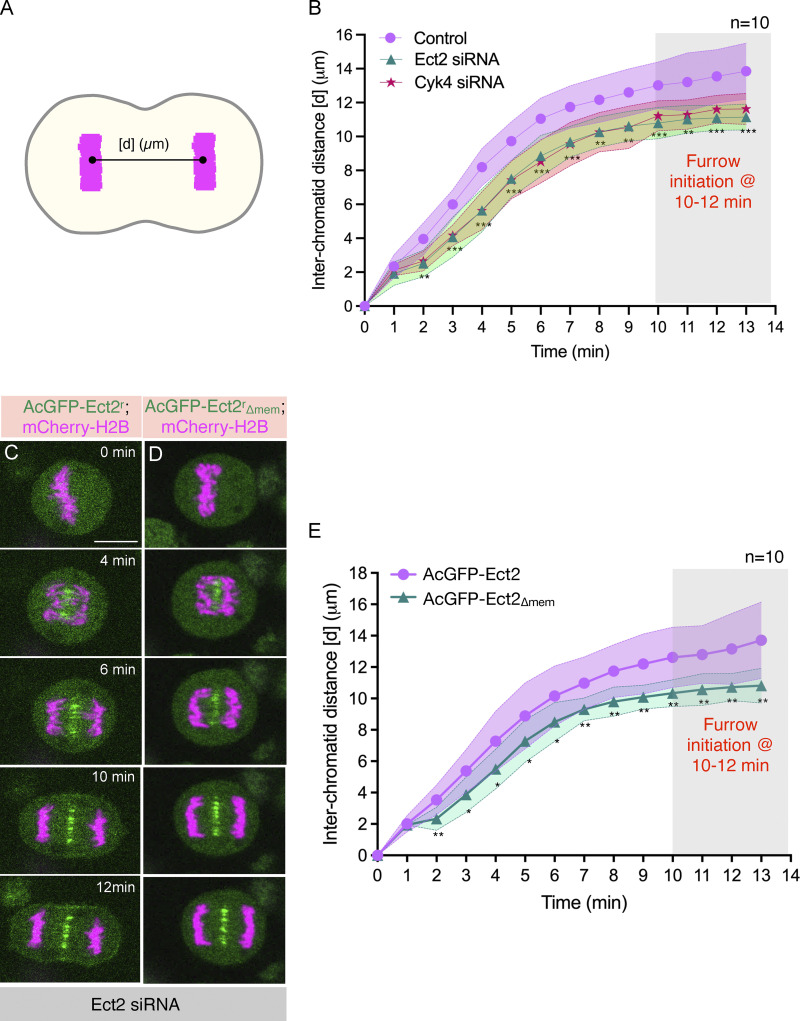
In animal cells, spindle elongation during anaphase is temporally coupled with cleavage furrow formation. Spindle elongation during anaphase is regulated by NuMA/dynein/dynactin complexes that occupy the polar region of the cell membrane and are excluded from the equatorial membrane. How NuMA/dynein/dynactin are excluded from the equatorial membrane and the biological significance of this exclusion remains unknown. Here, we show that the centralspindlin (Cyk4/Mklp1) and its interacting partner RhoGEF Ect2 are required for NuMA/dynein/dynactin exclusion from the equatorial cell membrane. The Ect2-based (Ect2/Cyk4/Mklp1) and NuMA-based (NuMA/dynein/dynactin) complexes occupy mutually exclusive membrane surfaces during anaphase. The equatorial membrane enrichment of Ect2-based complexes is essential for NuMA/dynein/dynactin exclusion and proper spindle elongation. Conversely, NuMA-based complexes at the polar region of the cell membrane ensure spatially confined localization of Ect2-based complexes and thus RhoA. Overall, our work establishes that membrane compartmentalization of NuMA-based and Ect2-based complexes at the two distinct cell surfaces restricts dynein/dynactin and RhoA for coordinating spindle elongation with cleavage furrow formation.


Figures

Figure 1.
Figure 1.
Centralspindlin (Cyk4/Mklp1) and Ect2 are required for NuMA/p150Glued exclusion from the equatorial membrane. (A) Immunofluorescence (IF) analysis of HeLa cells in anaphase. Cells were fixed and costained using anti-RhoA (green) and anti-NuMA (red) antibodies, as indicated. In this and other IF-analysis panels, DNA is shown in blue unless specified. More than 30 cells were visually analyzed from three independent experiments, and the representative cell is shown here. Scale bar in this and for the following panels represent 10 μm. (B and C) Schematic representation of line scan analysis (B) and the outcome (C) of such analysis for RhoA and NuMA normalized intensity (in arbitrary unit [au]) for the specified membrane region (in orange). (n = 5 cells were used for this quantification as depicted; shaded region indicates SEM). (D) Schematic representation of an evolutionarily conserved pathway required for RhoA activation in metazoans. (E–I) IF analysis of HeLa cells that are either transfected with control siRNA (E) or siRNA-against Cyk4 (F), Mklp1 (G), Ect2 (H), or Anillin (I). Cells were fixed after 36 h of siRNA transfection and stained with anti-p150Glued antibodies (green). Multinucleation percentage (%) is shown for each siRNA condition (n > 500 cells each from three independent experiments). Knockdown efficiency was also determined by immunoblot analysis (see Fig. S1, A–D). (J and K) Schematic representation of line scan analysis (J) and quantification method (K) used for analyzing equatorial membrane enrichment of NuMA fluorescence intensity. bkgd., eq. mem., and cyt. represent background, equatorial membrane, and cytoplasmic intensity, respectively. (L–P) IF analysis of HeLa cells transfected with control siRNA (L) or siRNA against- Cyk4 (M), Mklp1 (N), Ect2 (O), or Anillin (P). Cells were fixed after 36 h of siRNA transfection and thereafter costained with anti-NuMA (green) and anti-p150Glued (red) antibodies. The percentage on the figure panels represents the fraction of anaphase cells that show equatorial NuMA enrichment for each condition as analyzed by visual quantification (n > 100 cells from three independent experiments). Yellow arrowheads depict NuMA localization at the equatorial membrane. Line scan analysis on the right represents NuMA fluorescence intensity as indicated in J. Red asterisk represents intensity at the equatorial membrane. (Q) Quantification of equatorial membrane NuMA intensity in cells transfected with control siRNA or siRNA against- Cyk4, Mklp1, Ect2, or Anillin as indicated in Figure panel K (n = 25 cells for all conditions, as listed; error bars: SD). ns, P > 0.05; ***, P < 0.001 as determined by two-tailed unpaired Student’s t test. (R and S) Confocal live-imaging analysis of HeLa Kyoto cells stably coexpressing AcGFP-NuMA (green) and mCherry-H2B (magenta) that are transfected with control siRNA (R) or siRNA against Ect2 (S). The recording was initiated 26 h post-transfection for control and Ect2 siRNA. “0 min” time-point represents metaphase to anaphase transition. Yellow arrowheads depict NuMA localization at the equatorial membrane. (T) Quantification of equatorial membrane AcGFP-NuMA intensity as described in K. ns, P > 0.05; **, P < 0.01; ***, P < 0.001 as determined by two-tailed unpaired Student’s t test. n = 10 cells for control siRNA, and n = 15 for Ect2 siRNA transfected cells; error bars: SD.
Figure S1.
Figure S1.
Formin, Rock, and Myosin II are not critical for NuMA exclusion from equatorial membrane. (A–D) Assessing the depletion efficiency of siRNA against Cyk4, Mklp1, Ect2, or Anillin by immunoblot analysis. Mitotically synchronized protein extracts made from HeLa Kyoto cells were either transfected with control siRNA or siRNA-against above-mentioned genes for 60 h. The resulting blot was probed with antibodies directed against Cyk4 (A), Mklp1 (B), Ect2 (C), or Anillin (D). Antibodies against β-actin were used for loading control. In this and other Figure panels for immunoblot analysis, the molecular mass is indicated in kilodaltons (kD) and is shown on the left. (E–H) Immunofluorescence (IF) analysis of HeLa cells that were either transfected with control siRNA (E) siRNA-against mDia (Formin; F) for 60 h, treated with DMSO (Control; G), or with Y-27632 (H) for 12 h to inactivate Rho-associated protein kinase (Rock). Cells were fixed thereafter and stained with anti-p150Glued antibodies (green). In this, and other IF-analysis panels DNA is shown in blue. Multinucleation percentage (%) is shown in the figure panel. (n > 500 cells were analyzed from two independent experiments). The scale bar in this panel and the following panels represent 10 μm. (I–L) HeLa cells transfected with control siRNA (I), siRNA against mDia (J) for 60 h, treated with DMSO (Control; K), or treated with Y-27632 (L) for 1 h to inactivate Rock in anaphase. Cells were fixed and thereafter costained with anti-NuMA (green) and anti-p150Glued (red) antibodies. More than 50 cells from two independent experiments were analyzed, and the representative cells are shown here. (M) Synchronization scheme for myosin II inactivation using PNBB to analyze cells in anaphase for NuMA and p150Glued localization, and after 12 h for assessing cytokinesis failure. (N and O) IF analysis of mitotically synchronized populations of HeLa cells that were either treated with DMSO (Control; N) or PNBB (O) for 12 h. Thereafter, cells were fixed and stained with anti-p150Glued antibodies (green). Multinucleation percentage (%) is shown in the figure panel. (n > 500 cells were analyzed from two independent experiments). (P–S) HeLa cells in telophase (P and Q) or during early anaphase (R and S) that were either treated with DMSO (Control) or PNBB for 30 min. Cells were fixed and costained with anti-NuMA (green) and anti-p150Glued (red) antibodies. Please note that during telophase (P and Q), NuMA has localized to the nucleus, but the cleavage furrow has not formed because of myosin II inactivation. n > 50 cells, from two independent experiments, and the representative cells are shown here. (T and U) Confocal live-imaging analysis of HeLa Kyoto cells stably expressing GFP-DHC1 that were transfected with control siRNA (T) or siRNA against Ect2 (U). The recording was started 26 h post-transfection for control and Ect2 siRNA. “0 min” time-point represents metaphase to anaphase transition. Yellow arrowheads depict GFP-DHC1 localization at the equatorial membrane. Representative images from the time-lapse recording are shown here (n > 10 cells). Source data are available for this figure: SourceData FS1.
Figure 2.
Figure 2.
NuMA/p150Glued localization at the equatorial membrane is not due to failure in cell elongation. (A and B) Confocal live-imaging analysis of HeLa Kyoto cells stably coexpressing AcGFP-NuMA (green) and mCherry-H2B (magenta) that are transfected with control siRNA (A) or siRNA against Ect2 (B). The recording was started 26 h post-transfection for control and Ect2 siRNA transfected cells. “0 min” time-point represents metaphase to anaphase transition, and the images were acquired every minute. Yellow arrowheads depict NuMA localization at the equatorial membrane. The scale bar in this and for the following panels represents 10 μm. (C and D) Schematic representation of quantification method used for analyzing equatorial membrane enrichment of AcGFP-NuMA fluorescence intensity and for computing cell length (d [μm]) (C). Quantification of equatorial membrane enrichment of NuMA, along with the cell length (D) as described pictorially in C. Bar graph represents the cell length for cells that are either transfected with control siRNA (blue), or siRNA against Ect2 (green). The line plot graph represents the equatorial NuMA membrane intensity in cells transfected with control siRNA (violet) or Ect2 siRNA (pink). Time (in min) is shown on the x-axis, and NuMA equatorial intensity together with the cell length is plotted on the y-axis. ns, P > 0.05; *, P < 0.05; **, P < 0.01; ***, P < 0.001 as determined by two-tailed unpaired Student’s t test. n > 10 cells as listed; error bars: SEM. (E and F) IF analysis of HeLa cells that were either control siRNA transfected and treated with Cdk1 inhibitor RO-3306 (E) or transfected with siRNA-against Ect2 and treated with RO-3306 (F) for 5 min. Cells were fixed and costained using anti-NuMA (green) and anti-p150Glued (red) antibodies. Yellow arrowheads depict NuMA localization at the equatorial membrane. More than 30 cells were visually analyzed, and the representative cells are shown here. The experiments were repeated three times. (G) Visual quantification of the cortical NuMA distribution in RO-3306 or in Ect2 siRNA plus RO-3306 treated cells. The stacked blue bar, and brown bar represent the percentage of the cells that show cortical NuMA distribution at the polar cortical region and equatorial and polar cortical region, respectively. ***, P < 0.001 as determined by two-tailed unpaired Student’s t test. n > 30 cells/experiment, from three independent experiments; error bars: SD.
Figure S2.
Figure S2.
Centralspindlin component Cyk4 robustly localizes to the spindle midzone in cells treated with Cdk1 inhibitor RO-3306. (A and B) IF analysis of HeLa cells that were either control siRNA transfected and treated with RO-3306 (A) or transfected with siRNA-against Ect2 and treated with RO-3306 (B) for 5 min. Cells were fixed and costained using anti-NuMA (green) and anti-Cyk4 (red) antibodies. Yellow arrowheads depict NuMA localization at the equatorial membrane. The scale bar represents 10 µm. More than 30 cells were analyzed from three independent experiments, and the representative cells are shown here.
Figure 3.
Figure 3.
Central spindle localized Aurora B is not essential for NuMA exclusion from the equatorial membrane. (A) Synchronization method for inactivation of Aurora B using ZM447439 to analyze cells in anaphase for NuMA and p150Glued localization, and after 12 h for assessing cytokinesis failure. (B and C) IF analysis of mitotically synchronized populations of HeLa cells as mentioned above either treated with DMSO (Control; B) or ZM447439 (C) for 12 h. Thereafter, cells were fixed and stained with anti-p150Glued antibodies (green). The scale bar in the panel and following panels represent 10 µm. Multinucleation percentage (%) is shown in the figure panel. (n > 500 cells were analyzed each from two independent experiments). (D and E) IF analysis of mitotically synchronized populations of HeLa cells that were either treated with DMSO (Control; D) or ZM447439 (E) for 30 min. Cells were fixed and costained with anti-NuMA (green) and anti-p150Glued (red) antibodies. More than 50 anaphase cells were analyzed from two independent experiments, and the representative cells are shown here. (F and G) IF analysis of HeLa cells in interphase that were either transfected with control siRNA (F) or siRNA-against Mklp2 (G). Cells were fixed after 40 h of siRNA transfection and stained with anti-p150Glued antibodies (green). Multinucleation percentage (%) is shown for each siRNA condition. (n > 500 cells from two independent experiments). (H and I) IF analysis of HeLa cells during anaphase that were either transfected with control siRNA (H) or siRNA-against Mklp2 (I). Cells were fixed after 40 h of siRNAs transfection and thereafter stained with anti-Aurora B antibodies (red). More than 30 anaphase cells were analyzed from two independent experiments, and the representative cells are shown here. (J and K) IF analysis of HeLa cells in anaphase that were either transfected with control siRNA (Control; J) or siRNA-against Mklp2 (K). Cells were fixed after 40 h of siRNA transfection and costained with anti-NuMA (green) and anti-p150Glued (red) antibodies. More than 50 anaphase cells were analyzed from two independent experiments, and the representative cells are shown here.
Figure 4.
Figure 4.
Equatorial localization of NuMA-based complexes impacts proper chromosomes separation during anaphase. (A and B) Schematic representation for the calculation of the distance (d [μm]) between inter chromatids in cells undergoing metaphase to anaphase transition at various time intervals (A). Quantification of inter chromatids distance in HeLa Kyoto cells that are stably coexpressing AcGFP-NuMA and mCherry-H2B and are transfected with either control siRNA, siRNA-against Ect2, or siRNA-against Cyk4 (B). Note that Ect2 or Cyk4 siRNA transfected cells that show no cleavage furrow, and thus 100% penetrance of the siRNA were analyzed for quantification of inter chromatids distance. ns, P > 0.05; **, P < 0.01; ***, P < 0.001 as determined by two-tailed unpaired Student’s t test. n = 10 cells from two independent experiments as depicted in the figure panel; error bars: SD shown by shaded region-pink: control; green: Ect2 depletion; red: Cyk4 depletion. (C–E) Confocal live-imaging analysis of HeLa Kyoto cells expressing AcGFP-Ect2r (C), or AcGFP-Ect2rΔmem (D), with mCherry-H2B, and the quantification of inter chromatids distance in these cells (E). In these cells, endogenous Ect2 was depleted by siRNA targeting endogenous copy of the mRNA, but not ectopically expressed transgene. The recording was initiated 26 h post-transfection of Ect2 siRNA. “0 min” time-point represents metaphase to anaphase transition. ns, P > 0.05; *, P < 0.05; **, P < 0.01 as determined by two-tailed unpaired Student’s t test. n = 10 cells as depicted in the figure panel; error bars: SD represented by the shaded region-pink: cells coexpressing AcGFP-Ect2r and mCherry-H2B; green: cells coexpressing AcGFP-Ect2rΔmem and mCherry-H2B.
Figure S3.
Figure S3.
NuMA exclusion from the equatorial membrane is not merely dependent on Ect2 interaction with the membrane phosphoinositides. (A) Schematic representation of AcGFP (Aequorea coerulescens GFP), and mono FLAG -tagged siRNA-resistant Ect2 full-length (referred to as AcGFP-Ect2r), Ect2 without its membrane binding (PH and PBC) domain (referred to as AcGFP-Ect2rΔmem), and mCherry-tagged C-terminus of Ect2 with membrane binding (PH and PBC) domains together with mutations in the DH domain (referred to as mCherry-Ect2CTGEF4A) that impair GDP/GTP exchange activity but not its membrane binding (see panel C, and Materials and methods, and Su et al., 2011). (B and C) Confocal live-imaging analysis of HeLa Kyoto cells stably expressing AcGFP-NuMA (B) or AcGFP-NuMA cells that are transiently transfected with phosphoinositides binding C-terminus of Ect2 fragment (mCherry-Ect2CTGEF4A). “0 min” time-point represents metaphase to anaphase transition. The scale bar in this panel and the following panels represent 10 µm. (D) Schematic representation of quantification method used for analyzing polar membrane enrichment of AcGFP-NuMA fluorescence intensity. (E) Polar membrane quantification for AcGFP-NuMA in untransfected control cells or in cells expressing mCherry-Ect2CTGEF4A. ns, P > 0.05 as determined by two-tailed unpaired Student’s t test. n = 10 cells; error bars: SD. (F and G) Confocal live-imaging analysis of HeLa Kyoto cells stably expressing AcGFP- Ect2r (F) or AcGFP-Ect2rΔmem (G). The recording was started 26 h post-transfection for Ect2 siRNA targeting endogenous Ect2. “0 min” time-point represents metaphase to anaphase transition. Maximum intensity projected images are shown for each time point. (H) Schematic representation of quantification method used for analyzing midzone enrichment of AcGFP fluorescence intensity in cells stably expressing AcGFP-Ect2r, or AcGFP-Ect2rΔmem and are depleted for endogenous Ect2. (I) Quantification of midzone enrichment of AcGFP signal in cells expressing either AcGFP-Ect2r, or AcGFP-Ect2rΔmem and are depleted for endogenous Ect2. “0 min” time-point represents metaphase to anaphase transition. ns, P > 0.05 as determined by two-tailed unpaired Student’s t test. n = 15 cells; error bars: SD.
Figure 5.
Figure 5.
Ect2/Cyk4/Mklp1-based complexes are localized to the equatorial membrane during anaphase. (A) Schematic representation of siRNA-resistant Ect2 construct with AcGFP (Aequorea coerulescens GFP)-tag and mono FLAG-tag at the N-terminus (referred to as AcGFP-Ect2r). (B) Immunoblot analysis of mitotically synchronized protein extracts made from HeLa Kyoto cells, or Kyoto cells that were stably expressing AcGFP-Ect2r. These extracts were prepared 60 h post-transfection with control siRNA (−) or siRNA against Ect2 (+). The resulting blot was probed with antibodies directed against Ect2 and β-actin. As mentioned, transgenic AcGFP-Ect2r and endogenous (Endo.) Ect2 were detected on this immunoblot. In this and other panels, the molecular mass is indicated in kilodaltons (kD) and is shown on the left. (C–E) IF analysis of the Kyoto cells that are transfected with control siRNA (C), siRNA against Ect2 (D), or Kyoto cells stably expressing AcGFP-Ect2r after transfection with siRNA against Ect2 (E) for 60 h. Cells were fixed and stained using anti-α-tubulin (green) antibodies. DNA is shown in gray. Multinucleation percentage (%) is shown for each siRNA condition. (n > 500 cells each from three independent experiments). The scale bar in the panel and the following panels represent 10 μm. (F) Experimental protocol for chemically induced anaphase onset of mitotically synchronized HeLa Kyoto (Control), or HeLa Kyoto cells that are stably expressing AcGFP-Ect2r by acute Cdk1 inactivation using RO-3306. (G–L) IF analysis of HeLa Kyoto cells (Control) that are either treated with proteasome inhibitor MG132 (G and I) or MG132 and Cdk1 inhibitor RO-3306 (H and J) to synchronize them in the anaphase-like state as explained in F. Cells were fixed and stained using either anti-Plk1 (G and H; green) or anti-Mklp1 (I and J; red) antibodies. The experiment was repeated twice, and the representative cells are shown here. Quantification on the right represents midzone enrichment for Plk1 (K) and Mklp1 (L) in cells treated with MG132 or MG132+RO-3306. ***, P < 0.001 as determined by a two-tailed unpaired Student’s t test. n ≥ 12 cells, error bars: SD. (M) Co-immunoprecipitation (IP) by GFP-Trap in lysates from the AcGFP-Ect2r expressing cells that are chemically induced in the anaphase-like state. The resulting blots were probed for Cyk4, Mklp1, p150Glued, and GFP as indicated. IN (1% of total), IP: 20% of the total. Please note that for GFP detection in the IP fraction, only 3% of IP fraction was loaded. Note that AcGFP-Ect2r interacts with Cyk4, and Mklp1 (centralspindlin complex), but not with dynein interacting dynactin subunit p150Glued. (N) Schematic representation of quantification method used for analyzing equatorial membrane enrichment of AcGFP-Ect2r fluorescence intensity. (O–Q) Images from confocal live-imaging analysis of HeLa Kyoto cells stably expressing AcGFP-Ect2r (green) that are transfected with control siRNA (O) or siRNA against Cyk4 (P) or Mklp1 (Q). The signal intensity of AcGFP-Ect2r is also specified by the pseudocolor gradient on the right side of the image. (R) Equatorial membrane quantification for AcGFP-Ect2r for control siRNA, Cyk4 siRNA, or Mklp1 siRNA was performed as described in N. ***, P < 0.001 as determined by a two-tailed unpaired Student’s t test. n > 12 cells, error bars: SD. (S–U) The membrane localization of AcGFP (green) in HeLa Kyoto cells that are either expressing AcGFP-Ect2r (S) or AcGFP-NuMA (T). The signal intensity of AcGFP-Ect2r or AcGFP-NuMA is also specified by the pseudocolor gradient on the right side of the image. The linescan analysis of the membrane AcGFP intensity for the region (in orange) is depicted in (U). For such measurements, one quadrant of an anaphase cell from the equatorial cell membrane to the polar region of the cell membrane was analyzed to calculate the normalized intensity (U). Source data are available for this figure: SourceData F5.
Figure 6.
Figure 6.
The membrane tethering of Ect2-based complexes is essential for NuMA exclusion from the equatorial membrane. (A) Schematic representation of AcGFP (Aequorea coerulescens GFP), and mono FLAG -tagged siRNA-resistant Ect2 full-length (referred to as AcGFP-Ect2r), and Ect2 without its membrane binding (PH and PBC) domain (referred to as AcGFP-Ect2rΔmem). (B) Immunoblot analysis of mitotically synchronized protein extracts made from HeLa Kyoto cells, Kyoto cells that were stably expressing either AcGFP-Ect2r or AcGFP- Ect2rΔmem. The resulting blot was probed with anti-GFP or anti-β-actin antibodies. (C–F) IF analysis of the HeLa Kyoto cells transfected with either control siRNA (C), siRNA against Ect2 (D), HeLa Kyoto cells stably expressing AcGFP-Ect2r and transfected with Ect2 siRNA (E), or HeLa Kyoto cells stably expressing AcGFP- Ect2rΔmem and transfected with Ect2 siRNA (F) for 48 h. Cells were fixed and stained with anti-α-tubulin (green) antibodies. DNA is shown in gray. % on each panel marks the cytokinesis failure as calculated by analyzing the occurrence of binucleated and multinucleated cells (n > 500 cells each from three independent experiments). The scale bar in the panel and following panels represent 10 μm. (G and H) Confocal live-imaging analysis of HeLa Kyoto cells stably expressing AcGFP-Ect2r (G) or AcGFP-Ect2rΔmem (H), which are transiently transfected with mCherry-NuMA and are depleted for endogenous Ect2 by siRNA. The recording was started 26 h post-transfection for control and Ect2 siRNA targeting endogenous Ect2. “0 min” time-point represents metaphase to anaphase transition. Yellow arrowheads depict NuMA localization at the equatorial membrane. (I) Schematic representation of quantification method used for analyzing equatorial membrane enrichment of mCherry-NuMA fluorescence intensity. (J) Equatorial membrane quantification for mCherry-NuMA in cells expressing either AcGFP-Ect2r or AcGFP-Ect2rΔmem and are depleted for endogenous Ect2 as described in I. ns, P > 0.05; **, P < 0.01; ***, P < 0.001 as determined by two-tailed unpaired Student’s t test. n = 10 cells; error bars: SD. Source data are available for this figure: SourceData F6.
Figure 7.
Figure 7.
NuMA and Prc1 co-depletion impact RhoA accumulation at the equatorial membrane. (A–D) IF analysis of HeLa Kyoto cells that are either transfected with control siRNA (A) or siRNA-against NuMA (B), Prc1 (C), or Prc1 and NuMA (DCat.A and DCat.B). Cells were fixed 60 h post siRNA transfection and stained with anti-RhoA (gray) and anti-NuMA (red) antibodies. A minimum of 60 cells from three independent experiments were visually analyzed for RhoA based on their interchromatid distance during anaphase and representative images are shown in the Figure panel. The relative frequency of these category are mentioned in F. Note that NuMA and Prc1 co-depleted cells either show weak (Cat. A) or no RhoA (Cat. B) enrichment at the equatorial membrane. Also, note that Cat. B cells do not show cytokinetic furrow despite significant inter chromatid distance. In Prc1 depleted cells, in addition to its usual membrane localization, NuMA mislocalizes next to the DNA, possibly because of the absence of an intact spindle midzone. The scale bar in the panel and following panels represent 10 μm. (E and F) Schematic representation of the visual quantification of equatorial RhoA membrane intensity (E), and the % of cells based on such visual quantification in various siRNA transfected conditions (F). For such analysis, cells were grouped into four categories: strong (depicted in blue), as in control siRNA transfected cells, reduced (depicted in pink), as in NuMA siRNA, weak (depicted in orange) as in NuMA and Prc1 siRNA Cat. A, and absent (depicted in brown) as in NuMA and Prc1 siRNA Cat. B. (n = 109 cells for control siRNA; n = 81 cells for NuMA siRNA; n = 96 cells for Prc1 siRNA, and n = 60 cells for NuMA and Prc1 siRNA transfected cells from three independent experiments). (G and H) Schematic representation of line scan analysis (G) and the outcome (H) of this analysis for Rho A intensity at the equatorial membrane (depicted in blue) and polar membrane (shown in orange) in different siRNA transfected conditions. Please note a decrease in RhoA equatorial intensity in NuMA siRNA (P < 0.0001) as well as NuMA and Prc1 siRNA (P < 0.0001) transfected cells. Also, note a marginal increase in RhoA intensity at the polar membrane surface in cells transfected with either NuMA siRNA (P = 0.0018) or NuMA and Prc1 siRNA (Cat A: P < 0.04; Cat B: P < 0.0001). The RhoA intensity in Prc1 depleted cells at the polar membrane is non-significant (P = 0.108). n = 15 representative cells from all siRNA conditions were used for this quantification; the shaded region indicates SEM; the intensity value at the peak of each line scan curve has been compared to that of control to measure the P value by two-tailed unpaired Student’s t test. (I and J) Schematic representation of the quantification method (I), and the outcome of such analysis for equatorial membrane enrichment of RhoA fluorescence intensity (J). Please note a significant decrease in equatorial membrane RhoA intensity in cells depleted for NuMA, or NuMA and Prc1. The distribution for the RhoA intensity for all the cells depleted for NuMA and Prc1 is shown in the inset. Note that ∼30% of cells show the ratio of a selected region at the equatorial membrane to that of a similar area at the polar membrane is ∼1 (shown as red dots in the inset). ns, P > 0.05; ***, P < 0.001 as determined by two-tailed unpaired Student’s t test. n = 25 cells for control siRNA, NuMA siRNA, or Prc1 siRNA, and n = 27 cells for NuMA and Prc1 siRNA transfected cells were taken from three independent experiments; error bars: SD. (K–R) IF analysis of the central spindle localization of Prc1 (K and O), Cyk4 (L and P), Mklp1 (M and Q), or Ect2 (N and R) in HeLa Kyoto cells that are transfected with either control siRNA or siRNA against Prc1. Yellow-line represents the area that was used for computing the line scan intensity (in the arbitrary unit, au) on the right of each panel. n = 5 cells in each condition, as depicted; error bars: SD. (S) Immunoblot analysis of mitotically synchronized protein extracts made from HeLa Kyoto cells that were either transfected with control siRNA or siRNA against Prc1, NuMA, or Prc1 and NuMA for 60 h. The resulting blot was probed with anti-NuMA, Anti-Prc1, anti-Ect2, anti-Cyk4, and anti-RhoA antibodies. Anti-β-actin antibodies were used to analyze the equal loading of the samples. The values below the Ect2, Cyk4, and RhoA represent the band intensity, normalized to the intensity value from the respective β-actin control. Please note that we have run various % of SDS-PAGE to detect proteins with distinct molecular weight (MW). For instance, NuMA (MW ∼238kD) is detected by running a 6% gel, and for RhoA (MW ∼22 kD) detection, we have run the samples on 12% gel. Source data are available for this figure: SourceData F7.
Figure S4.
Figure S4.
Spindle midzone and astral microtubules are not affected by NuMA depletion. (A) Schematic representation of quantification method used for analyzing midzone microtubule fluorescence intensity. (B and C) IF analysis of HeLa cells that were either transfected with control siRNA (B), or siRNA directed against NuMA (C) for 60 h, were fixed and stained with antibodies directed against ⍺-tubulin (in green). The scale bar in the panel and following panels represent 10 μm. More than 30 anaphase cells were analyzed from two independent experiments, and the representative cells are shown here. (D) Midzone microtubule fluorescence intensity quantification for control siRNA, or NuMA siRNA was performed as described in A. ns- P > 0.05 as determined by two-tailed unpaired Student’s t test. n = 15 cells, error bars: SD. (E) Schematic representation of quantification method used for analyzing midzone enrichment for Cyk4 (F and G) or Ect2 (I and J). (F–K) IF analysis of HeLa cells that were either transfected with control siRNA (F and I), or siRNA directed against NuMA (G and J) for 60 h, were fixed and stained with antibodies directed against Cyk4 or Ect2 (in green) as indicated. More than 30 anaphase cells were analyzed from two independent experiments, and the representative cells are shown here. Quantification on the right represent midzone enrichment for Cyk4 (H) or Ect2 (K) for control siRNA, or NuMA siRNA as described in E. ns, P > 0.05 as determined by two-tailed unpaired Student’s t test. n = 15 cells, error bars: SD. (L) A schematic representation of anaphase cell and highlighting the midzone microtubules bundles created by Prc1 (Protein Regulator of Cytokinesis 1) homodimer. (M and N) IF analysis of HeLa cells that were either transfected with control siRNA (M), or siRNA directed against Prc1 (N) for 36 h were fixed and stained with antibodies directed against ⍺-tubulin (in green). More than 30 anaphase cells were analyzed from two independent experiments, and the representative cells are shown here. (O and P) Schematic representation of quantification method (O) used to determine the RhoA zone (in gray) and outcome of such analysis in cells transfected with control siRNA (P). n = 25 cells; error bars: SD. (Q and R) Schematic representation of quantification method (Q) used to determine the cytoplasmic RhoA intensity in arbitrary unit (au), and outcome of such analysis in cells transfected with control siRNA, NuMA siRNA, Prc1 siRNA, or NuMA and Prc1 siRNA (R). ns, P > 0.05 as determined by two-tailed unpaired Student’s t test. n = 10 cells in each condition; error bars: SD. (S and T) Representative IF image of HeLa Kyoto cell in anaphase fixed and stained with α-tubulin antibodies (gray). The areas used to analyze relative astral microtubules intensity is shown (S). Quantification of relative astral microtubule intensity in cells transfected with control siRNA (control), Prc1 siRNA, NuMA siRNA or NuMA and Prc1 siRNA (T). The intensities of the spindle (Ispindle) and the total cell (Itotal) were determined with ImageJ software. Relative astral MT intensity was calculated by ([Itotal−Ispindle]/Ispindle). ns, P > 0.05 as determined by two-tailed unpaired Student’s t test. n = 11 cells in each condition; error bars: SD.
Figure 8.
Figure 8.
Co-depletion of NuMA and Prc1 affect cytokinetic furrow initiation. (A–D) Confocal live-imaging analysis in combination with differential interphase contrast (DIC) microscopy images of HeLa Kyoto cells stably expressing mCherry-H2B, and were either transfected with control siRNA (A; Video 1), siRNA against NuMA (B; Video 2), siRNA against Prc1 (C; Video 3), or siRNA against Prc1 and NuMA (D(i); Video 4 and D(ii); Video 5). D(i) represents cells where the cytokinetic furrow was initiated but did not fully ingress and regress back before complete ingression (∼20% of the cells). In contrast, D(ii) represents cells where no cytokinetic furrow initiation was observed (∼10% of the cells). The recording was started 50 h post-transfection. “0 min” time-point represents metaphase to anaphase transition. The white arrowhead represents appearance of cytokinetic furrow. The yellow asterisk depicts cytokinesis failure (binucleated cell) in Prc1 siRNA transfected cell after complete furrow ingression, followed by regression. The scale bar in these panels represents 10 μm. (E) Quantification of various cytokinetic phenotypes as indicated in HeLa Kyoto cells stably expressing mCherry-H2B that were transfected with Prc1 siRNA or Prc1 and NuMA siRNA (n > 50 cells from three independent experiments). The recording was started 50 h post-transfection. “0 min” time-point represents metaphase to anaphase transition, and for every cell time-lapse, movies were recorded till 70 min from time 0 min. Since control siRNA transfected cells, and NuMA siRNA transfected cells do not reveal any furrow regression and cytokinesis failure within 70 min of time-lapse movies acquisition, their data are not included in the graph. (Total cells analyzed for Prc1 siRNA and for NuMA and Prc1 siRNA transfected cells were 51 and 87, respectively). (F–J) Schematic representation of anaphase cell depicting the method of measurements of the cytokinetic furrow width (d [µm]) from time-lapse confocal live imaging obtained for A–D and F. Furrow width measurements in cells stably expressing mCherry-H2B that were transfected with control siRNA (G), siRNA against NuMA (H), siRNA against Prc1 (I), and siRNA against Prc1 and NuMA (J). Please note that in contrast to Prc1 siRNA transfected cells, 10% of cells transfected with NuMA and Prc1 siRNA do not initiate cytokinetic furrow ingression, while 20% of these cells do not fully ingress cytokinetic furrow and proceed with furrow regression in time <35 min from time “0 min” that indicates metaphase to anaphase transition. (a minimum of 16 cells were used for such analysis for each siRNA condition, as depicted on the figure panels).
Figure 9.
Figure 9.
Membrane compartmentalization of Ect2 and NuMA-based complexes ensure proper chromosome separation and cytokinetic furrow formation. Model for localization of Ect2/Cyk4/Mklp1 and NuMA/dynein/dynactin at the equatorial and polar membrane regions, respectively. During anaphase, the spindle midzone assembly ensures efficient localization of centralspindlin (2Cyk4:2Mklp1) together with its interacting component Ect2 enrichment at the spindle midzone and at the equatorial membrane region. On the contrary, NuMA/dynein/dynactin complexes are enriched at the spindle poles and at the polar membrane surface. Inset (i) highlights the equatorial membrane region where Ect2, because of its ability to directly associate with the membrane phosphoinositides (shown in violet), ensures constant flux of Ect2/Cyk4/Mklp1-based complexes at the equatorial membrane in the proximity of spindle midzone. This regulates sufficient levels of RhoA for proper cytokinesis. In the absence of such robust flux (for instance, in Prc1 [siRNA]), RhoA localization and cleavage furrow ingression is not affected because of the occupancy of NuMA/dynein/dynactin complexes at the polar region of the membrane (inset ii). This polarization between Ect2/Cyk4/Mklp1 and NuMA/dynein/dynactin ensures proper chromosome separation and the formation of the cytokinetic furrow. Violet and orange lipids represent phosphoinositides and other phospholipids, respectively.

Similar articles

Cited by

References

    1. Basant, A., and Glotzer M.. 2018. Spatiotemporal regulation of RhoA during cytokinesis. Curr. Biol. 28:R570–r580. 10.1016/j.cub.2018.03.045 - DOI - PMC - PubMed
    1. Basant, A., Lekomtsev S., Tse Y.C., Zhang D., Longhini K.M., Petronczki M., and Glotzer M.. 2015. Aurora B kinase promotes cytokinesis by inducing centralspindlin oligomers that associate with the plasma membrane. Dev. Cell. 33:204–215. 10.1016/j.devcel.2015.03.015 - DOI - PMC - PubMed
    1. Bement, W.M., Benink H.A., and von Dassow G.. 2005. A microtubule-dependent zone of active RhoA during cleavage plane specification. J. Cell Biol. 170:91–101. 10.1083/jcb.200501131 - DOI - PMC - PubMed
    1. Bement, W.M., Miller A.L., and von Dassow G.. 2006. Rho GTPase activity zones and transient contractile arrays. BioEssays. 28:983–993. 10.1002/bies.20477 - DOI - PMC - PubMed
    1. Bergstralh, D.T., Dawney N.S., and St Johnston D.. 2017. Spindle orientation: A question of complex positioning. Development. 144:1137–1145. 10.1242/dev.140764 - DOI - PubMed

Publication types

MeSH terms