

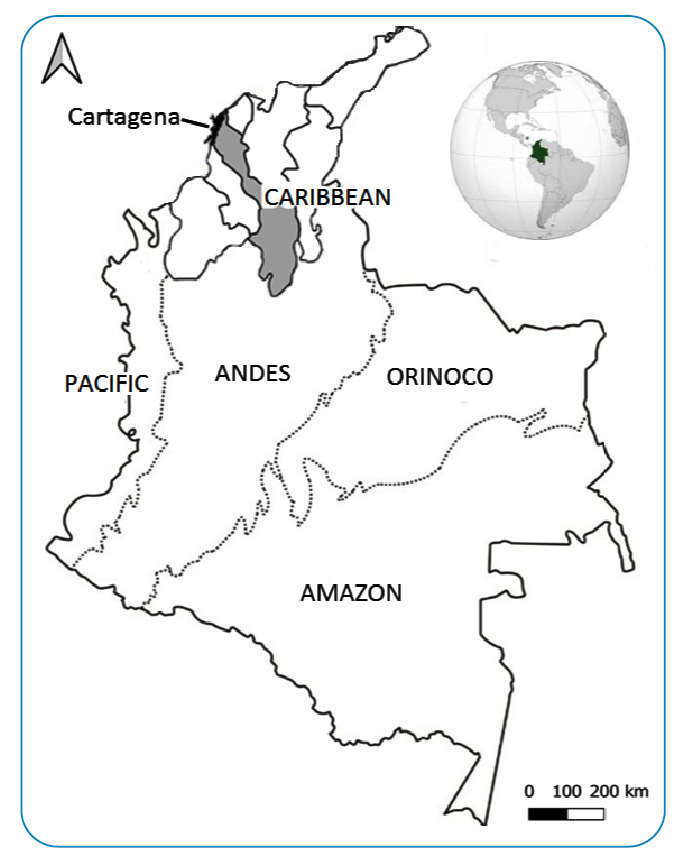
Climatic factors and the incidence of dengue in Cartagena, Colombian Caribbean Region
- PMID: 36197377
- PMCID: PMC9536800
- DOI: 10.1590/0037-8682-0072-2022
Climatic factors and the incidence of dengue in Cartagena, Colombian Caribbean Region
Abstract
Background: The influence of climate on the epidemiology of dengue has scarcely been studied in Cartagena.
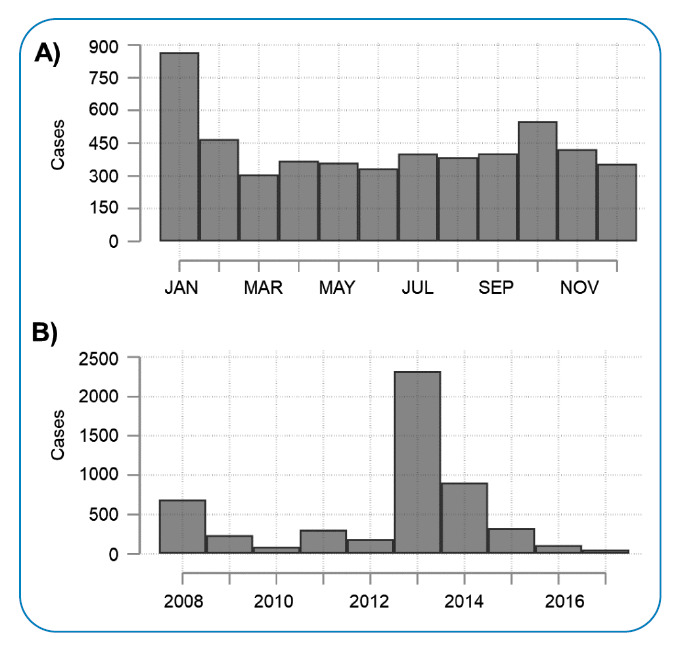
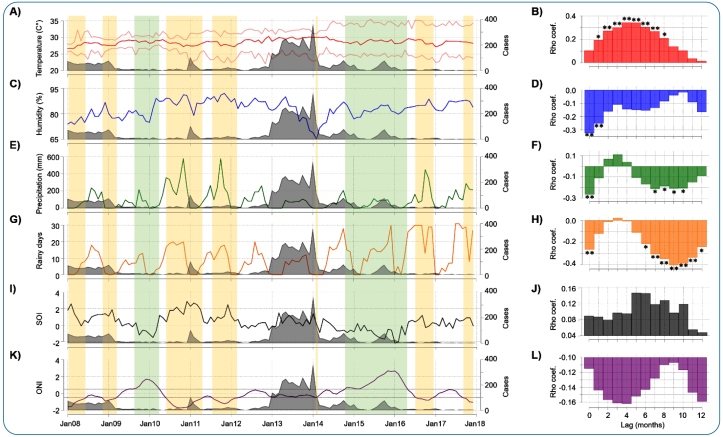
Methods: The relationship between dengue cases and climatic and macroclimatic factors was explored using an ecological design and bivariate and time-series analyses during lag and non-lag months. Data from 2008-2017 was obtained from the national surveillance system and meteorological stations.
Results: Cases correlated only with climatic variables during lag and non-lag months. Decreases in precipitation and humidity and increases in temperature were correlated with an increase in cases.
Conclusions: Our findings provide useful information for establishing and strengthening dengue prevention and control strategies.
Conflict of interest statement
Figures
Similar articles
-
Climatic Variability and Human Leptospirosis Cases in Cartagena, Colombia: A 10-Year Ecological Study.Am J Trop Med Hyg. 2021 Dec 6;106(3):785-791. doi: 10.4269/ajtmh.21-0890. Am J Trop Med Hyg. 2021. PMID: 34872058 Free PMC article.
-
Time series analysis of dengue incidence in Guadeloupe, French West Indies: forecasting models using climate variables as predictors.BMC Infect Dis. 2011 Jun 9;11:166. doi: 10.1186/1471-2334-11-166. BMC Infect Dis. 2011. PMID: 21658238 Free PMC article.
-
Role of climatic factors in the incidence of dengue in Port Sudan City, Sudan.East Mediterr Health J. 2019 Dec 29;25(12):852-860. doi: 10.26719/emhj.19.019. East Mediterr Health J. 2019. PMID: 32003443
-
A Retrospective Study of Climate Change Affecting Dengue: Evidences, Challenges and Future Directions.Front Public Health. 2022 May 27;10:884645. doi: 10.3389/fpubh.2022.884645. eCollection 2022. Front Public Health. 2022. PMID: 35712272 Free PMC article.
-
Modeling and projection of dengue fever cases in Guangzhou based on variation of weather factors.Sci Total Environ. 2017 Dec 15;605-606:867-873. doi: 10.1016/j.scitotenv.2017.06.181. Epub 2017 Jul 3. Sci Total Environ. 2017. PMID: 28683431 Review.
Cited by
-
Knowledge, Attitudes, and Practices for the Prevention and Vector Control of Dengue in a Colombian Rural Population: A Mixed Method Study.SAGE Open Nurs. 2025 Feb 25;11:23779608241302713. doi: 10.1177/23779608241302713. eCollection 2025 Jan-Dec. SAGE Open Nurs. 2025. PMID: 40013006 Free PMC article.
-
Skin mycosis distribution, and burden of visits over a decade in Colombia: ecological study.IJID Reg. 2024 Aug 20;13:100432. doi: 10.1016/j.ijregi.2024.100432. eCollection 2024 Dec. IJID Reg. 2024. PMID: 39308787 Free PMC article.
-
Spatial and temporal trends of dengue infections in Curaçao: A 21-year analysis.Parasite Epidemiol Control. 2024 Jan 26;24:e00338. doi: 10.1016/j.parepi.2024.e00338. eCollection 2024 Feb. Parasite Epidemiol Control. 2024. PMID: 38323192 Free PMC article.
References
-
- Muñoz E, Poveda G, Arbeláez MP, Vélez ID. Spatiotemporal dynamics of dengue in Colombia in relation to the combined effects of local climate and ENSO. Acta Trop. 2021;224:106136–106136. - PubMed
-
- Meza-Ballesta A, Gónima L. Influencia del clima y de la cobertura vegetal en la ocurrencia del Dengue (2001-2010) Rev Salud Pública. 2014;16:293–306. - PubMed
-
- Departamento Administrativo Distrital de Salud . Análisis de la situación de salud con el modelo de determinantes sociales de salud del distrito de Cartagena de indias. 2019. https://www.minsalud.gov.co/sites/rid/Lists/BibliotecaDigital/RIDE/VS/ED...
MeSH terms
LinkOut - more resources
Full Text Sources
Medical
