. 2022 Oct 5;18(10):e1010418.
doi: 10.1371/journal.pgen.1010418. eCollection 2022 Oct.

miR-275/305 cluster is essential for maintaining energy metabolic homeostasis by the insulin signaling pathway in Bactrocera dorsalis

Affiliations

miR-275/305 cluster is essential for maintaining energy metabolic homeostasis by the insulin signaling pathway in Bactrocera dorsalis

Junfei Xie et al. PLoS Genet. .

Abstract

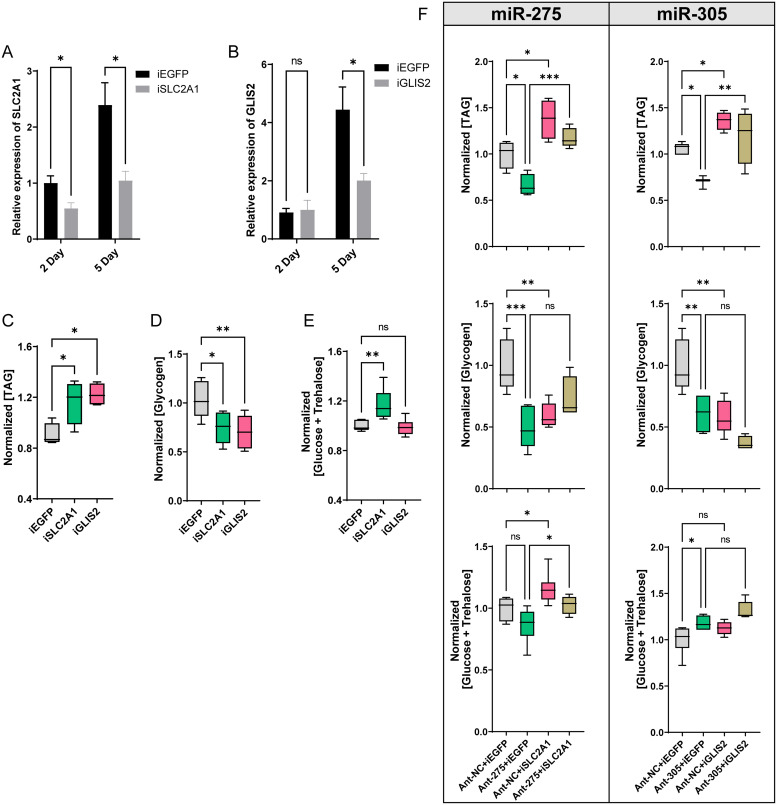
Increasing evidence indicates that miRNAs play crucial regulatory roles in various physiological processes of insects, including systemic metabolism. However, the molecular mechanisms of how specific miRNAs regulate energy metabolic homeostasis remain largely unknown. In the present study, we found that an evolutionarily conserved miR-275/305 cluster was essential for maintaining energy metabolic homeostasis in response to dietary yeast stimulation in Bactrocera dorsalis. Depletion of miR-275 and miR-305 by the CRISPR/Cas9 system significantly reduced triglyceride and glycogen contents, elevated total sugar levels, and impaired flight capacity. Combined in vivo and in vitro experiments, we demonstrated that miR-275 and miR-305 can bind to the 3'UTR regions of SLC2A1 and GLIS2 to repress their expression, respectively. RNAi-mediated knockdown of these two genes partially rescued metabolic phenotypes caused by inhibiting miR-275 and miR-305. Furthermore, we further illustrated that the miR-275/305 cluster acting as a regulator of the metabolic axis was controlled by the insulin signaling pathway. In conclusion, our work combined genetic and physiological approaches to clarify the molecular mechanism of metabolic homeostasis in response to different dietary stimulations and provided a reference for deciphering the potential targets of physiologically important miRNAs in a non-model organism.


Conflict of interest statement

The authors have declared that no competing interests exist.

Figures

Fig 1
Fig 1. Dietary yeast may influence metabolic status via miRNA.
The female of B. dorsalis were fed with or without dietary yeast for 4 days. Whole bodies of flies were homogenized in PBST solution, and then the contents of TAG (A), glycogen (B) or total sugar content (glucose plus trehalose) (C) were detected. The results were normalized to the total protein content. Boxplots show the data of seven independent biological replicates (n = 5 flies for each replicate). Asterisks indicate significant differences by Student’s t-test (****, P < 0.0001; *, P < 0.05). (D-D’) Nile-red staining of the lipid droplets in the fat body of females. Pictures were obtained with a Leica SP8 confocal microscope (Scale bar: 20 μm), and the lipid droplet size was quantified using ImageJ. “yeast-” and “yeast+” indicate the absence and presence of yeast in the diet, respectively. (E) RNAi efficiency of miRNA biosynthesis pathway-related genes AGO1 and DCR1 at 48 h post dsRNA microinjection. Data are expressed as means ± SEM of four independent replicates (***, P < 0.001; **, P < 0.01). (F-H) Effects of AGO1 and DCR1 RNAi on the metabolic content. (G) TAG content. (H) glycogen content. (I) total sugar content (glucose plus trehalose).
Fig 2
Fig 2. Identification of miRNAs potentially involved in energy metabolism in B. dorsalis.
(A) Hierarchical clustering analysis of the differentially expressed miRNAs in response to dietary yeast stimulation. Heatmap showed two separated clades with up-regulated miRNAs in one clade and down-regulated miRNAs in the other clade. The color scale indicates the Log2-transformed expression values in the heatmap. (B) Expression levels of up-regulated miRNAs in the abdomens of B. dorsalis treated with three different dietary regimens, namely, yeast-free diet (yeast-), yeast-rich diet (yeast+), and 4-day yeast-free diet followed by 2-day yeast-rich diet (refed). Data are expressed as means ±SEM. ****, P< 0.0001; ***, P < 0.001; **, P < 0.01. (C-D) Relative expression levels of miR-275 and miR-305 during the larvae-pupa-adult developmental stages (C) and different tissues isolated at 5 day post eclosion (DPE) of the adult female (D). The smooth curve was fitted using the LOWESS spline method with GraphPad Prism to visualize the dynamic expression of miRNA. Different lowercase letters above bars denote significant differences (P < 0.05) according to Tukey’s test (one-way ANOVA).
Fig 3
Fig 3. Targeted mutation of miR-275 and miR-305 impaired physiological metabolism.
(A-B) Relative expression levels of mature miR-275 (A) and miR-305 (B) in homozygote (-/-), heterozygote (+/-), and wild-type flies. (C-E) Effects of miRNA mutation on energy substrate metabolism in heterozygote. (C) TAG content. (D) glycogen content. (E) total sugar content (glucose plus trehalose). Data were normalized to total protein content. Data represent seven to ten biological replicates with three technical replicates. *, P < 0.05; **, P < 0.01; ***, P < 0.001, and ****, P < 0.0001 (Student’s t-test). (F-F’) Nile Red staining of lipid droplets. The fat body was obtained from miR-275-/-, miR-305-/-, and wild-type females at 5 DPE. Red, Nile Red staining for neutral lipids; and blue, DAPI staining for nuclei. Lipid droplets were visualized and imaged with a Leica SP8 confocal microscope (Scale bar: 10 μm.), and the size was quantified using ImageJ.
Fig 4
Fig 4. miR-275 and miR-305 maternal loss-of-function mutants exhibited impaired flight capability, decreased hatching rate and survival rate.
(A) Negative flip duration of heterozygous mutants and wild-type flies. (B) Effect of miRNA mutation on the cumulative flight distance. The flight mill system was used to compute the flight performance of heterozygote mutant and wild-type females at 10 DPE. (C) Embryo hatchability of the heterozygous mutants and wild-type flies. Flies with depleted miR-275 and miR-305 showed only 55.48% and 50.28% mean hatching rates, whereas wild-type flies showed an 87.74% mean hatching rate. Each treatment contained 200 eggs and 8 biological replicates. (D) Survival curves of heterozygous mutant and wild-type adult female flies. The survival rate was monitored for 40 days after genotype identification. Survival curves indicated that the survival rate of miR-275+/- and miR-305+/- was significantly lower than wild-type flies (P = 0.0002 and P = 0.037, respectively, n = 60, Gehan-Breslow-Wilcoxon test). The data are expressed as mean ± SEM. ***, P < 0.001.
Fig 5
Fig 5. SLC2A1 and GLIS2 are the direct targets of miR-275 and miR-305, respectively.
(A) Heatmap of relative expression levels of candidate targets in antagomiR groups (Ant-275 or Ant-305) and the negative control (Ant-NC). The number in each cell represents the mean value of the relative expression. Solid and hollow circles indicate significantly up-regulated and down-regulated target genes upon antagomiR treatment, respectively (P < 0.05). (B-C) Validation of candidate target genes by yeast-refeeding strategy. (B) miR-275. (C) miR-305. “yeast-” and “yeast+” indicate the absence and presence of yeast in the diet for 6 days, respectively, while “refed” indicates a 4-day yeast-free diet followed by a 2-day yeast-rich diet (refed). ANOVA: *, P < 0.05; **, P < 0.01; ***, P < 0.001. (D) Luciferase reporter assays of candidate targets (LOC6469, SLC2A1, MUC5AC, KCTD151, GLIS2, and SV2A) in vitro. (E-F) Abolishment of repression effect by binding site mutation. (E) miR-275-SLC2A1 binding site mutation. (F) miR-305-GLIS2 binding site mutation. (G-H) Immunoprecipitation (RIP) of miRNA and their target genes in vivo. (G) RIP of miR-275 and SLC2A1. (H) RIP of miR-305 and GLIS2. Fold enrichment was quantitated relative to IgG control. (I-J) Relative expression of SLC2A1 and GLIS2 in the heterozygous mutant and wild-type flies. Data are expressed as means ± SEM. *, P < 0.05; **, P < 0.01; ***, P < 0.001; and ****, P < 0.0001 (Student’s t-test).
Fig 6
Fig 6. Tissue-specific expression profile of target genes and RNA in situ hybridization.
(A-B) Tissue-specific expression patterns of SLC2A1 (A) and GLIS2 (B) with 5-day-old females. Data are expressed as mean ± SEM from five biological replicates. The lowercase letters above bars indicate significant differences by one-way ANOVA followed by Tukey’s multiple comparisons test. (C-D) RNA-FISH detection of miR-275/miR-305 (Red) and SLC2A1/GLIS2 (Green) in the fat body (C) and gut (D) of wild-type flies. The images were visualized using Leica TCS SP8 confocal laser scanning microscope (Zeiss, Germany) at a magnification of 40 x. Scale bar: 50 μm.
Fig 7
Fig 7. Knockdown of SLC2A1/GLIS2 partially rescues metabolic phenotype defects in antagomiR-treated flies.
(A-B) RNAi knockdown efficiency of SLC2A1 and GLIS2 at 2 days and 5 days post dsRNA injection by qRT-PCR. (C-E) Effects of dsRNA treatment on the contents of TAG (C), glycogen (D), and total sugar (glucose plus trehalose) (at 5 days post-injection) (G). (F) Metabolic phenotypes of antagomiR-treated flies in rescue experiments. The experiments were performed by co-injecting dsRNA and antagomiR with co-injection of dsEGFP and the antagomiR-control (Ant-NC) as a negative control. Left panel represents the rescue for miR-275 deletion, and right panel for miR-305 deletion. Data represent 10 biological replicates for each sample. One-way ANOVA was performed to determine statistically significant differences. *, P < 0.05; **, P < 0.01; ***, P < 0.001, NS, not significant.
Fig 8
Fig 8. The insulin pathway is involved in the regulation of the miRNA-target axis.
(A-D) Effects of enhanced insulin activity on the miRNA-target axis under yeast-rich conditions (yeast+). (A) The relative transcription levels of InR and 4EBP at 24 h post insulin injection. (B) ELISA was employed to quantify the relative insulin content, including the sum of exogenous insulin and insect-produced insulin. (C-D) The relative expression levels of miRNAs (C) and target genes (D) following insulin microinjection. (E-H) Effects of inhibiting the insulin signaling pathway gene IRS on the miRNA-target axis. (E) The relative expression levels of IRS and 4EBP at 2 day post dsIRS treatment. (F) The endogenous insulin titers were detected by ELISA. (G-H) Effects of dsRNA treatment on miRNAs (G) and target genes (H) transcript levels in whole bodies. (I-L) The role of the TOR pathway in the miRNA-target axis. (I) Consumption of yeast-rich foods increases TOR transcription. (J-L) Relative expressions of TOR (J), miRNAs (K), and target genes (L) in the whole bodies at 2 day post dsTOR injection. Data are expressed as means ± SEM. *, P < 0.05; **, P < 0.01; ***, P < 0.001 (Student’s t-test).
Fig 9
Fig 9. Schematic diagram of miR-275/305 cluster role in modulating dietary yeast-dependent metabolic homeostasis.
Our proposed model summarizes the mechanism by which miR-275/305 targets SLC2A1/GLIS2 to regulate energy metabolic homeostasis. In the presence of dietary yeast, the activation of the insulin signaling pathway is followed by the activation of the miR-275/305 cluster expression, which in turn inhibits SLC2A1/GLIS2 transcription via binding their 3’UTR region. Meanwhile, TOR can directly act on target genes without affecting miRNAs. This cascade regulation finally ensures normal metabolic physiology. Dietary yeast may contribute to the activation of the miR-275/305 cluster through an unknown pathway (indicated by dashed lines and question marks). Under yeast deprivation conditions, either the activity of insulin or the TOR signaling pathway was low, and the expression of SLC2A1/GLIS2 was derepressed, thus ensuring the basal metabolism needed. Arrows and T-shaped symbols represent activation and inhibition, respectively. Dashed arrows denote the unknown pathway, the components that are less active or inactive are shown in grey, while red crosses indicate shut-down pathways.

Similar articles

Cited by

References

    1. Fanson BG, Weldon CW, Pérez-Staples D, Simpson SJ, Taylor PW. Nutrients, not caloric restriction, extend lifespan in Queensland fruit flies (Bactrocera tryoni). AGING CELL. 2009;8(5):514–23. doi: 10.1111/j.1474-9726.2009.00497.x - DOI - PubMed
    1. Lee KP. Dietary protein:carbohydrate balance is a critical modulator of lifespan and reproduction in Drosophila melanogaster: a test using a chemically defined diet. J Insect Physiol. 2015;75:12–9. doi: 10.1016/j.jinsphys.2015.02.007 - DOI - PubMed
    1. Harwood JF, Chen K, Muller HG, Wang JL, Vargas RI, Carey JR. Effects of diet and host access on fecundity and lifespan in two fruit fly species with different life history patterns. PHYSIOL ENTOMOL. 2013;38(1):81–8. doi: 10.1111/phen.12006 - DOI - PMC - PubMed
    1. Skorupa DA, Dervisefendic A, Zwiener J, Pletcher SD. Dietary composition specifies consumption, obesity, and lifespan in Drosophila melanogaster. AGING CELL. 2008;7(4):478–90. doi: 10.1111/j.1474-9726.2008.00400.x - DOI - PMC - PubMed
    1. Kaspi R, Mossinson S, Drezner T, Kamensky B, Yuval B. Effects of larval diet on development rates and reproductive maturation of male and female Mediterranean fruit flies. PHYSIOL ENTOMOL. 2002;27(1):29–38. doi: 10.1046/j.1365-3032.2001.00264.x - DOI

Publication types