. 2022 Oct 5;14(665):eadc9967.
doi: 10.1126/scitranslmed.adc9967. Epub 2022 Oct 5.

Assessment of cholesterol homeostasis in the living human brain

Affiliations

Assessment of cholesterol homeostasis in the living human brain

Achi Haider et al. Sci Transl Med. .

Abstract

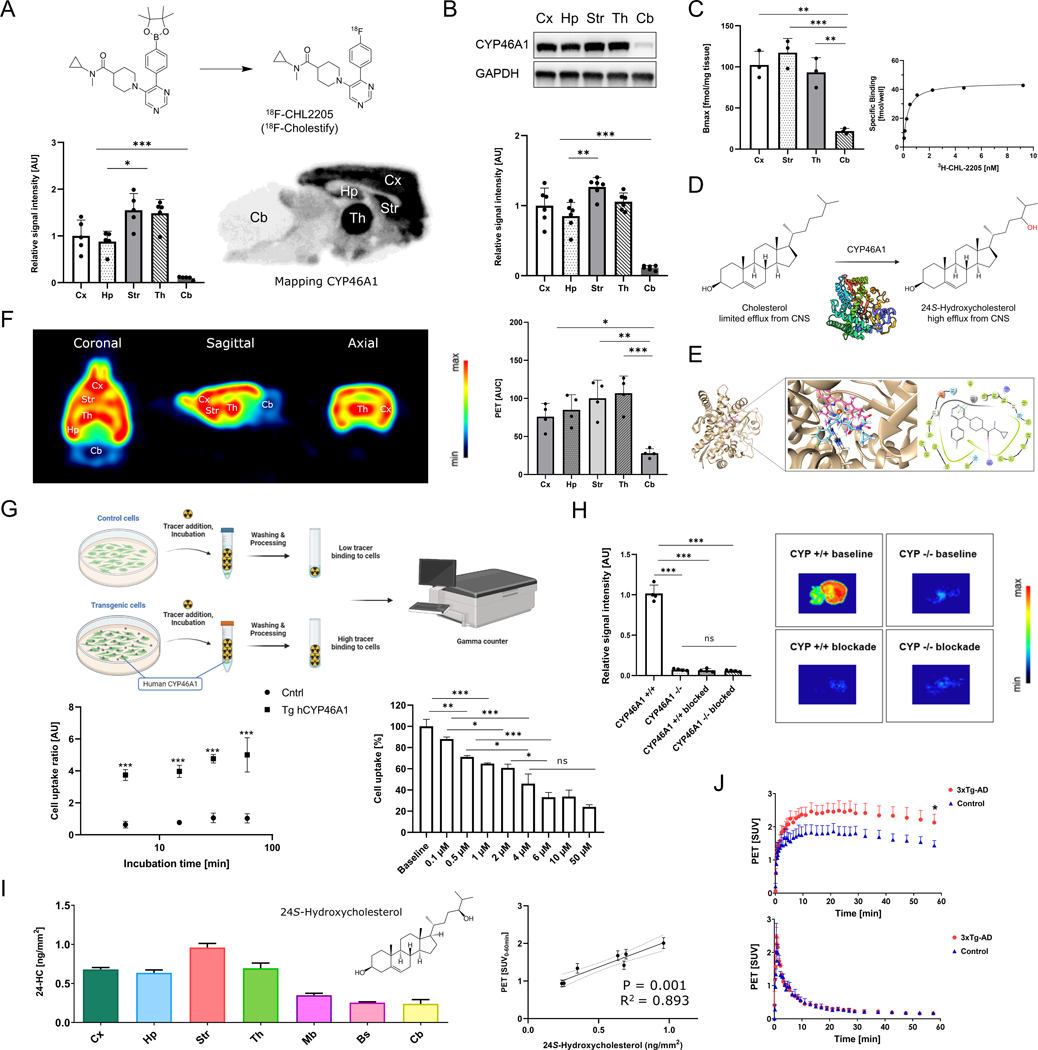
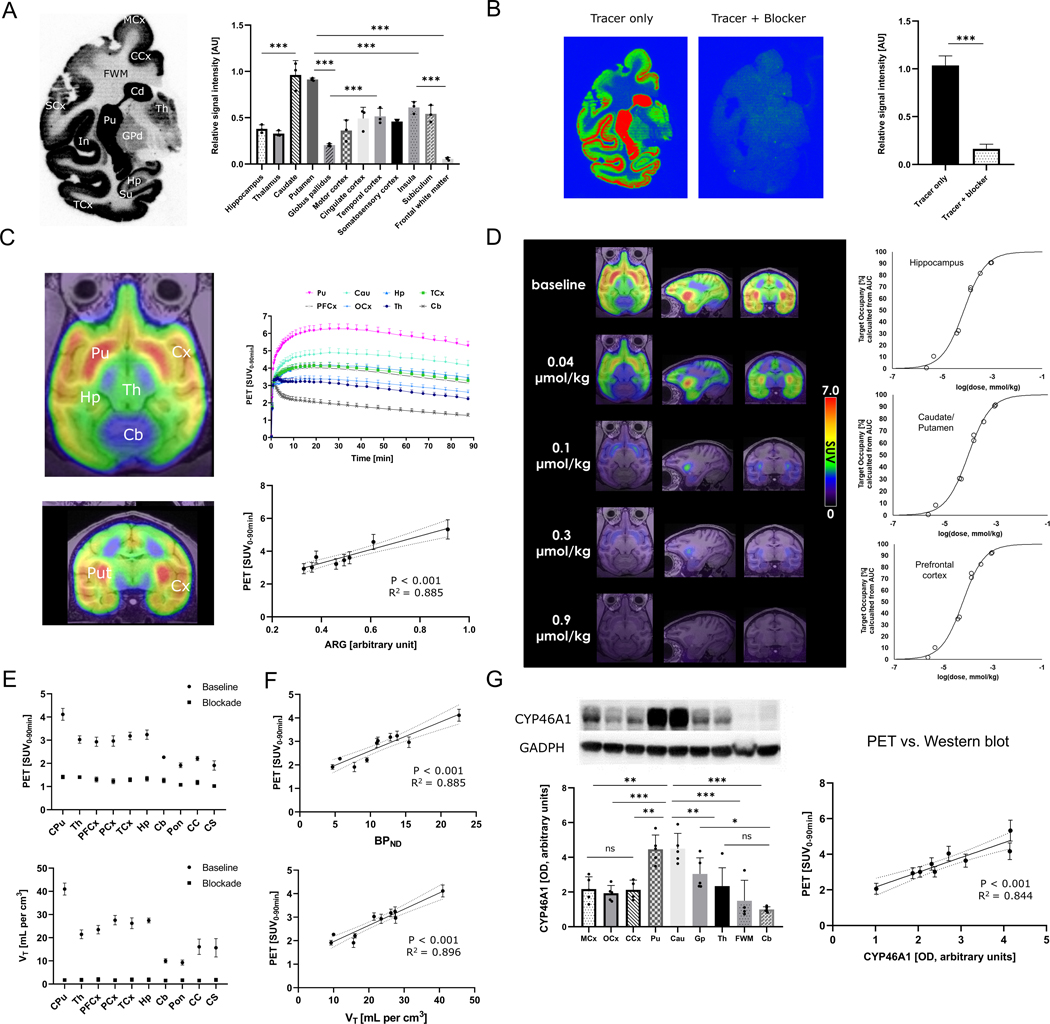
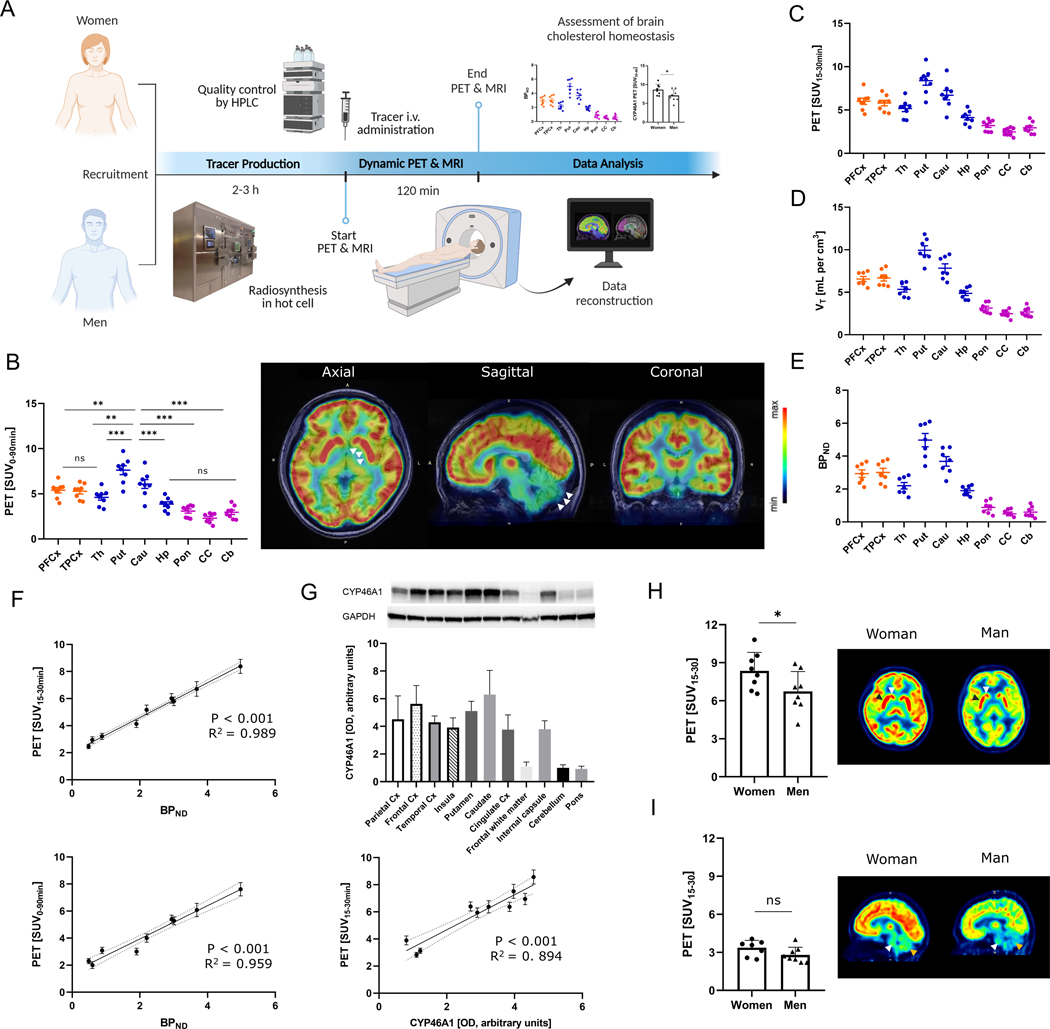
Alterations in brain cholesterol homeostasis have been broadly implicated in neurological disorders. Notwithstanding the complexity by which cholesterol biology is governed in the mammalian brain, excess neuronal cholesterol is primarily eliminated by metabolic clearance via cytochrome P450 46A1 (CYP46A1). No methods are currently available for visualizing cholesterol metabolism in the living human brain; therefore, a noninvasive technology that quantitatively measures the extent of brain cholesterol metabolism via CYP46A1 could broadly affect disease diagnosis and treatment options using targeted therapies. Here, we describe the development and testing of a CYP46A1-targeted positron emission tomography (PET) tracer, 18F-CHL-2205 (18F-Cholestify). Our data show that PET imaging readouts correlate with CYP46A1 protein expression and with the extent to which cholesterol is metabolized in the brain, as assessed by cross-species postmortem analyses of specimens from rodents, nonhuman primates, and humans. Proof of concept of in vivo efficacy is provided in the well-established 3xTg-AD murine model of Alzheimer's disease (AD), where we show that the probe is sensitive to differences in brain cholesterol metabolism between 3xTg-AD mice and control animals. Furthermore, our clinical observations point toward a considerably higher baseline brain cholesterol clearance via CYP46A1 in women, as compared to age-matched men. These findings illustrate the vast potential of assessing brain cholesterol metabolism using PET and establish PET as a sensitive tool for noninvasive assessment of brain cholesterol homeostasis in the clinic.


Figures

Figure 1:
Figure 1:. PET tracer co-localizes with CYP46A1 and 24-hydroxycholersterol in the rodent brain.
A) Radiosynthesis and autoradiographic distribution of the probe, 18F-CHL-2205 (named 18F-Cholestify), on the healthy rat brain (n=4) B) Western blot analysis of CYP46A1 expression in selected regions of the rat brain (n=6). C) Representative probe saturation binding kinetics and Bmax determinations in selected rat brain regions. D) CYP46A1-mediated hydroxylation of cholesterol to 24S-hydroxycholesterol in the central nervous system (CNS). E) Molecular docking of CHL-2205 (blue) to CYP46A1 (PDB:3MDM). Binding within the cavity was primarily composed of hydrophobic interactions, as well as one T-shaped pi-pi stacking with the protoporphyrin ring (pink) and a hydrogen bond between the carbonyl group and R226 (arrow). F) Representative PET images of the rat brain reflecting CYP46A1-rich brain regions, averaged from 0–60 min post tracer injection and presented in coronal, sagittal and axial view. Quantitative data is depicted as area under the curve (AUC) from respective time activity curves (n=4). G) Cell uptake studies in transfected human embryonic kidney (HEK) cells overexpressing human CYP46A1 and respective controls at the incubation time of 5, 15, 30 and 60 min, respectively (n=4). Dose-response study was conducted with escalating concentrations of soticlestat. Data is presented as percentage, whereas the average of the baseline (no soticlestat) samples was used as a reference. H) Autoradiographic assessment of 18F-CHL-2205 binding to the brains of Cyp46A1 knock out mice and respective controls (n=4). I) Left: Regional quantification of major cholesterol metabolite, 24-hydroxycholesterol, in the CNS. Right: correlation of PET signal with the extent to which cholesterol was metabolized to 24-hydroxycholesterol. J) PET scans of the validated Alzheimer’s disease mouse model, 3xTg-AD, and respective control animals (n=4). Upper panel shows time-activity curves (TACs) under baseline conditions, where only the tracer is administered. Lower panel shows TACs under blockade conditions, where the tracer is administered together with an excess of non-radioactive CHL-2205 to diminish the number of enzymes that are available for tracer-CYP46A1 interactions. Abbreviations: Bs, brain stem; Cb, cerebellum; Cx, cortex; Hp, hippocampus; Mb, midbrain; Str, striatum; Th, thalamus; AUC, area under the curve; CYP +/+, wild-type mouse; CYP−/−, Cyp46A1 knock out mouse, SUV, standardized uptake value. * p<0.05, ** p<0.01, *** p<0.001.
Figure 2:
Figure 2:. Targeted PET predicts CYP46A1 abundancy and allows the quantification of drug-CYP46A1 interactions in the brains of non-human primates.
A) Autoradiographic distribution of the probe, 18F-CHL-2205, on the healthy non-human primate brain (n=3). B) Baseline vs. blockade study with excess non-radioactive CYP46A1 inhibitor, soticlestat (n=3). C) PET images and respective time-activity curves (TACs) in non-human primates (n=4). Correlation between in vitro autoradiography and in vivo PET. D) Target occupancy study in which the probe was used to estimate the extent of target engagement by clinical drug candidate, soticlestat, at different doses and in distinct brain regions. E) Calculation of averaged standardized uptake values from 0–90 min post tracer injection (SUV0–90) and volumes of distribution (VT) from kinetic modeling for different brain regions (n=3). F) Correlation (VT) and binding potentials with PET signal in assessed brain regions. G) left: Western blot analysis of post-mortem non-human primate brain specimens (n=5). Right: correlation of PET signal with Western blot analysis. Abbreviations: PCx, parietal cortex; PFCx, prefrontal cortex; MCx, motor cortex; OCx, occipital cortex; CCx, cingulate cortex; SCx, somatosensory cortex; TCx, temporal cortex; CPu, caudate/putamen; Th, thalamus; In, insula; Su, subiculum; GPd, globus pallidus; Pu, putamen; Cau, caudate; FWM, frontal white matter; Hp, hippocampus; Cb, cerebellum; Pon, pons; CC, corpus callosum; AUC, area under the curve; SUV, standardized uptake value. Dashed lines indicate 95% confidence intervals. * p<0.05, ** p<0.01, *** p<0.001.
Figure 3:
Figure 3:. Quantitative assessment of cholesterol metabolism in the living human brain.
A) Study design. B) Representative PET images of the human brain reflecting CYP46A1-rich brain regions, averaged from 0–90 min post tracer injection and presented in axial, sagittal and coronal view. CPu (CYP46A1-rich region on axial image) and Cb (CYP46A1-poor region on sagittal image) are highlighted with white arrows. Quantitative data is depicted as standardized uptake values (SUVs) from respective individual scans (n=8). C) Distribution of 18F-CHL-2205 in the human brain presented as standardized uptake values from 15 to 30 min post injection (SUV15–30) for the respective individual scans (n=8). D) Kinetic modeling assessment of tissue volumes of distribution (VT) for 18F-CHL-2205 in the human brain. E) Kinetic modeling assessment of non-displaceable binding potentials (BPND) for 18F-CHL-2205 in the human brain. For B to E, cortical regions are depicted in orange, whereas subcortical regions are shown in blue. Regions with low CYP46A1 expression are shown in purple. F) Correlation of PET signal averaged from 15–30 min (upper panel) and 0–90 min (lower panel) post tracer injection with non-displaceable binding potentials in selected brain regions. G) Western blot analysis of post-mortem human brain specimens. Correlation of PET signal with Western blot analysis in selected brain regions. H) Female vs. male brain cholesterol metabolism in the high CYP46A1 regions, caudate (n=4, white arrow) and putamen (n=4, black arrow), respectively. I) Female vs. male brain cholesterol metabolism in the low CYP46A1 regions, cerebellum (n=4, brown arrow) and brain stem (n=4, white arrow), respectively. Results are presented as standardized uptake values averaged from 15 to 30 min post tracer injection (SUV15–30). PFCx, prefrontal cortex; TPCx, temporal cortex; Th, thalamus; Pu, putamen; Cau, caudate; Hp, hippocampus; Cb, cerebellum; Pon, pons; CC, corpus callosum; AUC, area under the curve; SUV, standardized uptake value; PET, positron emission tomography; MRI, magnetic resonance imaging. Dashed lines indicate 95% confidence intervals. * p<0.05, ** p<0.01, *** p<0.001.

References

    1. Dietschy JM, Turley SD, Cholesterol metabolism in the brain. Curr Opin Lipidol 12, 105–112 (2001). - PubMed
    1. Di Paolo G, Kim T-W, Linking lipids to Alzheimer’s disease: cholesterol and beyond. Nature Reviews Neuroscience 12, 284–296 (2011). - PMC - PubMed
    1. Mauch DH, Nägler K, Schumacher S, Göritz C, Müller EC, Otto A, Pfrieger FW, CNS synaptogenesis promoted by glia-derived cholesterol. Science 294, 1354–1357 (2001). - PubMed
    1. Barres BA, Smith SJ, Neurobiology. Cholesterol--making or breaking the synapse. Science 294, 1296–1297 (2001). - PubMed
    1. Lund EG, Guileyardo JM, Russell DW, cDNA cloning of cholesterol 24-hydroxylase, a mediator of cholesterol homeostasis in the brain. Proc Natl Acad Sci U S A 96, 7238–7243 (1999). - PMC - PubMed

Publication types