. 2022 Oct 5;14(665):eabh2369.
doi: 10.1126/scitranslmed.abh2369. Epub 2022 Oct 5.

NOS1 mutations cause hypogonadotropic hypogonadism with sensory and cognitive deficits that can be reversed in infantile mice

Affiliations

NOS1 mutations cause hypogonadotropic hypogonadism with sensory and cognitive deficits that can be reversed in infantile mice

Konstantina Chachlaki et al. Sci Transl Med. .

Abstract

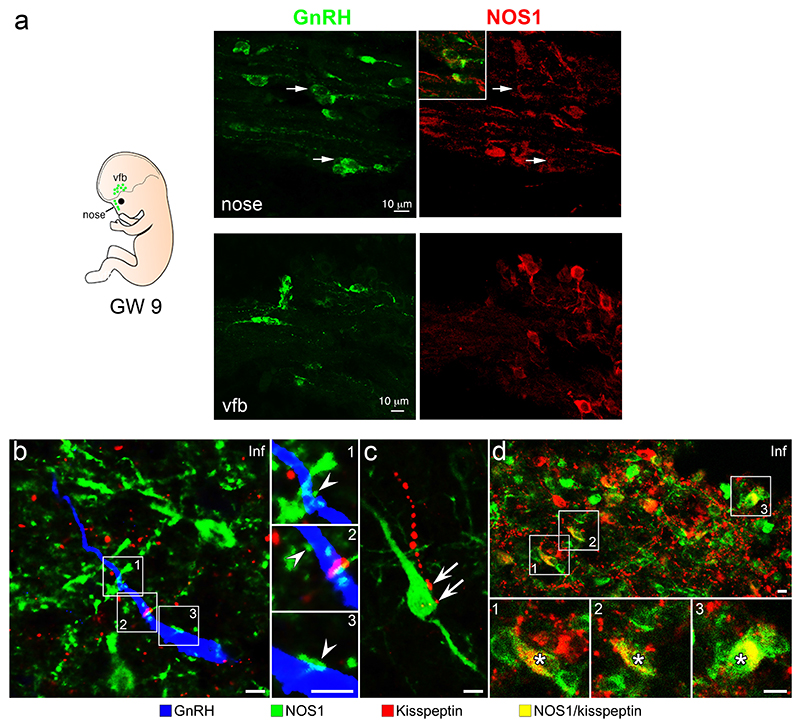
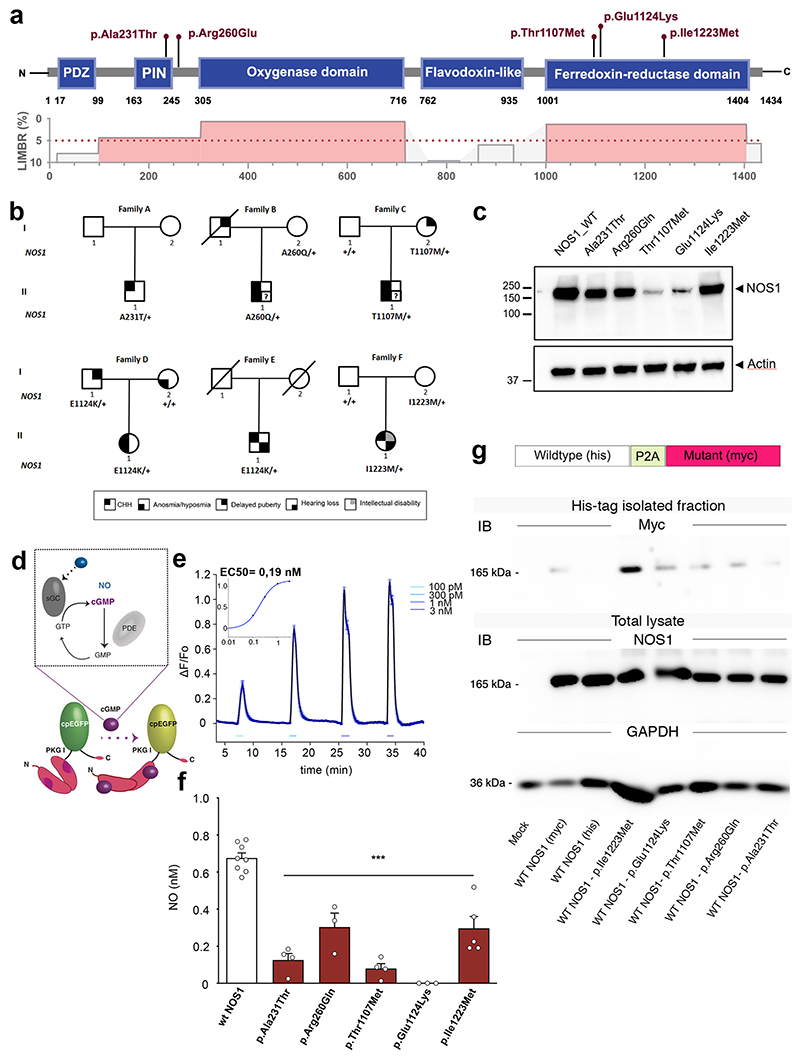
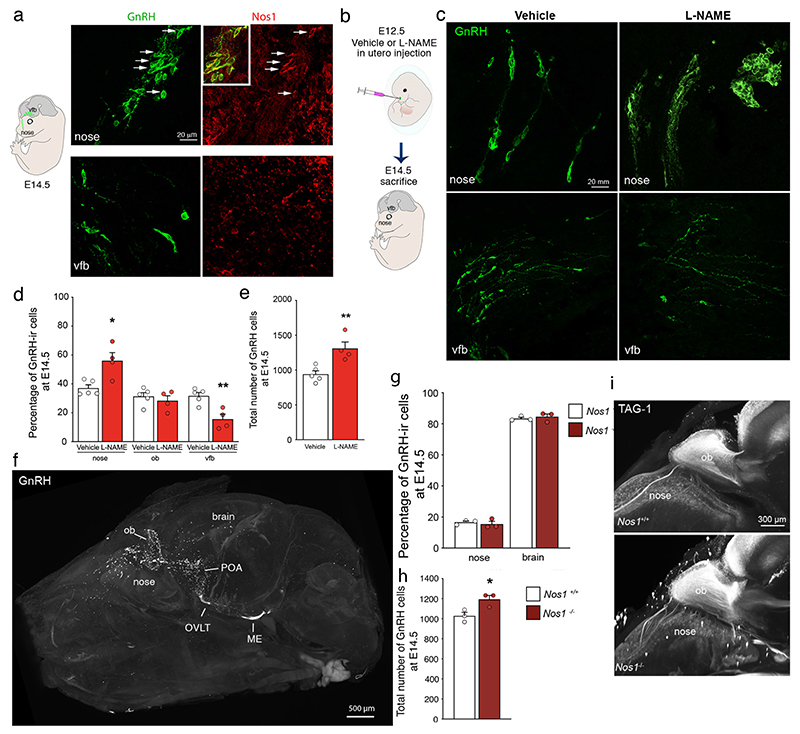
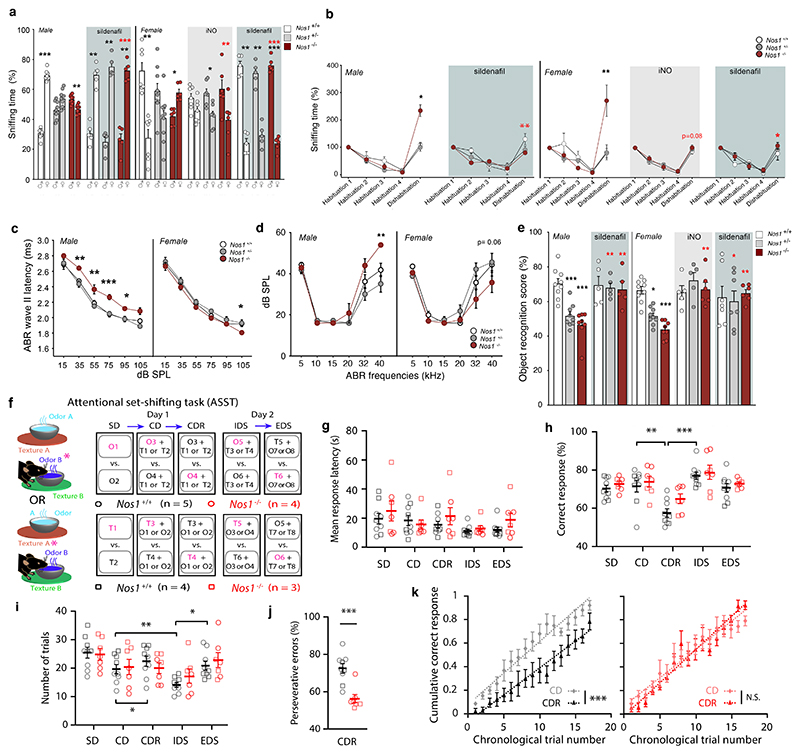
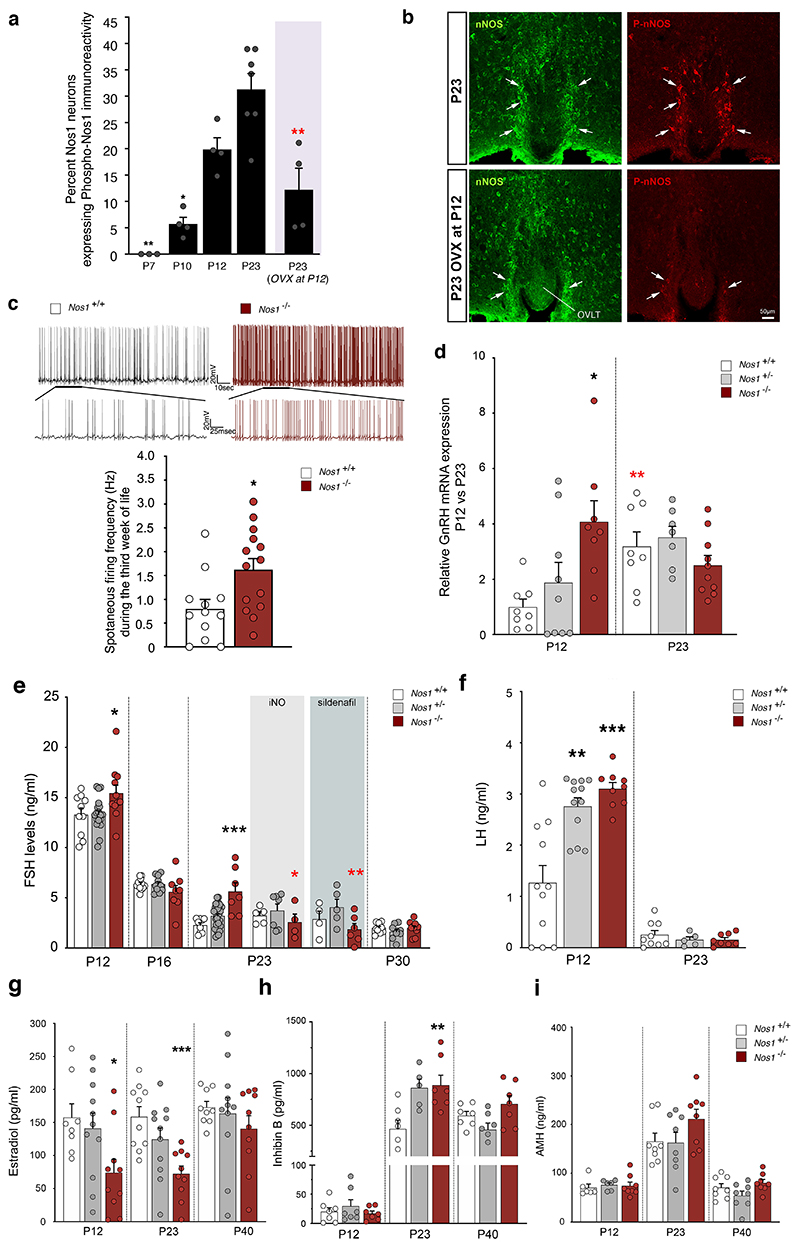
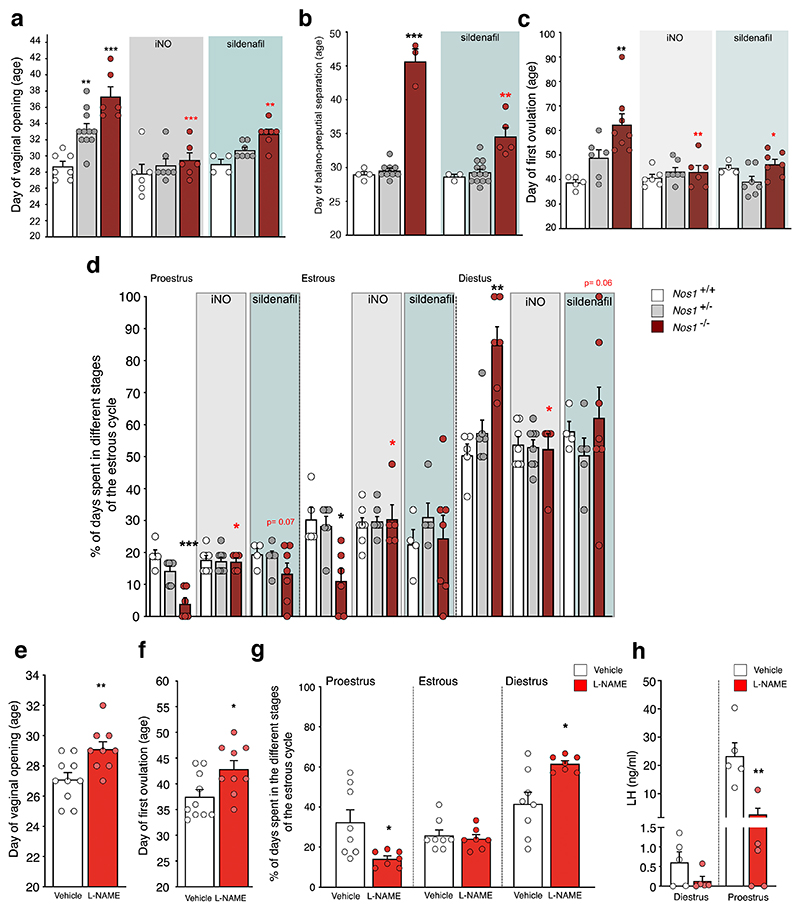
The nitric oxide (NO) signaling pathway in hypothalamic neurons plays a key role in the regulation of the secretion of gonadotropin-releasing hormone (GnRH), which is crucial for reproduction. We hypothesized that a disruption of neuronal NO synthase (NOS1) activity underlies some forms of hypogonadotropic hypogonadism. Whole-exome sequencing was performed on a cohort of 341 probands with congenital hypogonadotropic hypogonadism to identify ultrarare variants in NOS1. The activity of the identified NOS1 mutant proteins was assessed by their ability to promote nitrite and cGMP production in vitro. In addition, physiological and pharmacological characterization was carried out in a Nos1-deficient mouse model. We identified five heterozygous NOS1 loss-of-function mutations in six probands with congenital hypogonadotropic hypogonadism (2%), who displayed additional phenotypes including anosmia, hearing loss, and intellectual disability. NOS1 was found to be transiently expressed by GnRH neurons in the nose of both humans and mice, and Nos1 deficiency in mice resulted in dose-dependent defects in sexual maturation as well as in olfaction, hearing, and cognition. The pharmacological inhibition of NO production in postnatal mice revealed a critical time window during which Nos1 activity shaped minipuberty and sexual maturation. Inhaled NO treatment at minipuberty rescued both reproductive and behavioral phenotypes in Nos1-deficient mice. In summary, lack of NOS1 activity led to GnRH deficiency associated with sensory and intellectual comorbidities in humans and mice. NO treatment during minipuberty reversed deficits in sexual maturation, olfaction, and cognition in Nos1 mutant mice, suggesting a potential therapy for humans with NO deficiency.


Conflict of interest statement

Declaration of interests: Authors do not have any competing interests.

Figures

Figure 1
Figure 1. NOS1 expression in the GnRH neuronal system in humans
(a) 9-week old human fetus immunolabeling showing migrating GnRH neurons (green) coexpressing NOS1 protein (red) in the nose (arrows upper panels), but not in the ventral forebrain (vfb; lower panels). (b) NOS1 (green), GnRH (blue) and Kisspeptin (red) triple-immunofluorescence in the infundibulum (Inf) of adult human hypothalami. White arrowheads: contacts between NOS1-immunoreactive processes and GnRH neurons. (c) Kisspeptin fibers (red) innervating (white arrows) NOS1 cells. (d) A subpopulation of the kisspeptin neurons (asterisks) co-expressing NOS1 in the infundibulum. Scale bars: 15 μm.
Figure 2
Figure 2. Identification and characterization of NOS1 mutations in CHH probands
(a) Lollipop plot illustrating the distribution of identified mutations in functional domains (blue boxes) of the human NOS1 protein (upper panel) and in highly constrained sub-regions (LIMBR score < 5%; lower panel in red). (b) Pedigrees of CHH probands harboring NOS1 mutations. Phenotypes are indicated by symbols as shown in the legend (bottom). (c) Representative western blot showing ectopic expression of NOS1 protein (Anti-Myc tag) in HEK293 cells 48h after transfection with WT or mutant NOS1 constructs. (d) Mode of action of NO on the fluorometric probe (FlincG3) used to quantify NO production from NOS1 isoforms using live-cell imaging in transfected HEKGC/PDE5 cells (i.e. NO detector cells) and (e) calibrating the dose-response curve. sGC, soluble guanylate cyclase; PDE, phosphodiesterase; EGFP, enhanced green fluorescent protein; F, fluorescence. (f) NO concentration upon endogenous stimulation of the NO signaling pathway in NO-detector cells expressing the WT or mutated NOS1 protein (one-way ANOVA with Dunnett’s post-hoc test; n=8,4,3,4,3,5). ***P<0.001. Values indicate means ± SEM. N>3 independent experiments using technical replicates. (g) Representative Western blots showing co-immunoprecipitation of Myc-tagged NOS1 mutants with His-tagged WT NOS1.
Figure 3
Figure 3. A role for Nos1 in GnRH neuron migration and number
(a) Immunolabeling of a mouse embryo on embryonic day (E) 14.5 showing migrating GnRH neurons (green) and Nos1 protein expression (red) in the nose (upper panels) and the ventral forebrain (vfb) (lower panels). (b) Schematic showing in utero injections of L-NAME into the nose of mouse embryos at E12. (c) Immunolabeling of a mouse embryo on E14.5 injected with vehicle (left panels) or L-NAME (right panels) showing migrating GnRH neurons (green) in the nose (upper panels) and the vfb (lower panels). (d) Distribution and (e) total number of GnRH neurons at E14.5 in vehicle (white; n=5)- and L-NAME-treated (red; n=4) embryos in the nose, olfactory bulb (ob) and vfb. (f) Transparentized whole head and immunofluorescence for GnRH (white) in a Nos1-/- mouse at P0. ME, median eminence; ob, olfactory bulb; OVLT, organum vasculosum laminae terminalis; POA, preoptic region. (g) Distribution (Kruskal-Wallis followed by Dunn’s multiple comparisons), and (h) total number of the GnRH neurons in newborn Nos1+/+ (black; n=3)- and Nos1-/- (brown; n=3) mice. (i) Representative 3D images of TAG-1 immunoreactive olfactory fibers projecting into the brain in Nos1+/+ and Nos1-/- littermates at P0. Values indicate means ± SEM. N≥3 independent litters. Unpaired t-test, *P<0.05, **P<0.01.
Figure 4
Figure 4. Behavioral tests in Nos1-deficient mice: olfaction, cognition and hearing.
(a) Social olfactory preference test in male and female Nos1+/+, Nos1+/- and Nos1-/- mice treated or not with iNO (grey-shaded area) or Sildenafil (blue-shaded area) during the infantile period from P10 to P23. Black asterisks indicate the preference of each group for male versus female odor (paired t-test; males: untreated, n= 8,10,10; Sildenafil-treated, n=5,5,5; females: untreated n=7,10,6; Sildenafil-treated, n=5,5,6; iNO-treated, n=7,7,6). Red asterisks: comparison between mice of the same sex and genotype but subjected to different treatments [Nos1-/- Females: Kruskal-Wallis followed by Dunn’s multiple comparisons test; Nos1-/- males: Mann-Whitney U test]. (b) Non-social olfactory preference test in male and female Nos1+/+, Nos1+/- and Nos1-/- mice treated or not with iNO (grey-shaded area), or Sildenafil (blue-shaded area) during the infantile period from P10 to P23. Values for Nos1+/+ mice during the dishabituation stage are compared to those of Nos1+/- and Nos1-/- mice for each treatment group [Kruskal-Wallis followed by Dunn’s multiple comparisons test; males: untreated, n=6,5,5; Sildenafil-treated, n=5,5,5; females: untreated, n=7,8,7; Sildenafil-treated, n= 5,5,5; iNO-treated, n=6,5,6] (c, d) Hearing assessed by measuring (c) latencies at the level of the cochlear nucleus (distortion-product otoacoustic emissions were identical in all mice), and (d) auditory brainstem-evoked response (ABR) thresholds in Nos1+/+, Nos1+/- and Nos1-/- male (n=8,8,6) and female mice (n=9,9,9). Nos1+/+ values are compared to those of Nos1+/- and Nos1-/- mice for each group of measurements (two-way ANOVA with Dunnett’s post-hoc test). (e) Recognition memory test in Nos1+/+, Nos1+/- and Nos1-/- male and female mice treated or not (untreated males, n=9,9,8 and females, n=9,9,8) with iNO (grey-shaded area; females, n=6,5,6) or Sildenafil (blue-shaded area; males, n=5,5,5; females, n=5,5,6) during the infantile period. Nos1+/+ values are compared to those of Nos1+/- and Nos1-/- mice for each group of measurements (Kruskal-Wallis test with Dunn’s post-hoc test). Red asterisks: comparison between mice of the same genotype but subjected to different treatments (Mann-Whitney test for males and Kruskal-Wallis test with Dunn’s post-hoc test for females). (f-k) Attentional-set formation and reversal learning in Nos1+/+ (n=9) and Nos1-/- male mice (n=7). (f) Schematics of the attentional set-shifting task (ASST). Half the mice started the task with olfactory cues being informative (top, purple letters, circles) whereas the other half started with tactile cues being informative (bottom, squares) (see methods for details). (g) Mean response latency during the ASST according to genotype (two-way repeated-measures ANOVA, P = 0.6) and group (one-way repeated-measures ANOVA, Nos1+/+: P= 0.12; Nos1-/-: P=0.35). (h) Percentage of correctly completed trials according to genotype (two-way repeated-measures ANOVA, P=0.15) and group (one-way repeated-measures ANOVA, Nos1+/+: P=0.0002; Nos1-/-: P=0.015). (i) Number of trials performed for each block of the ASST according to genotype (two-way repeated-measures ANOVA, P=0.5327) and group (one-way repeated-measures ANOVA followed by post-hoc test including 5% false discovery rate, Nos1+/+: P=0.0028; Nos1-/-: P=0.21y). (Number of trials done during the CDR block for Nos1+/+ vs. Nos1-/- mice, paired t-test; P=0.78). (j) Percentage of perseverative errors during the CDR block (Mann-Whitney U test p=0.0007). (k) Comparison of normalized cumulative correct response rate as a function of the trial chronological order between the CD and CDR block. Dotted lines indicate linear regressions (slope: P=0.055 and P=0.11, elevation: *P<10-7 and P=0.39 for Nos1+/+ and Nos1-/- mice, respectively). Values indicate means ± SEM. N>3 independent litters. *P<0.05; **P<0.01; ***P<0.001.
Figure 5
Figure 5. Nos1 activity controls infantile GnRH neuronal function.
(a) Progressive phosphorylation of Nos1 during postnatal development in the organum vasculosum laminae terminalis (OVLT) in intact female mice and females ovariectomized (OVX) on postnatal day 12 (P12). Bar graphs represent the mean ratio of Nos1-immunoreactive pixels to P-Nos1-immunoreactive pixels. P-Nos1 levels are compared across developmental stages (one-way ANOVA with Tukey’s post-hoc test, n=3,4,4,7). The values after ovariectomy at P12 are independently compared to P23 values (unpaired t-test, n=7,4). (b) Immunolabeling for Nos1 (green) and p-Nos1 (red) at P23 in the OVLT of intact (upper panel) of ovariectomized female mice (OVX at P12; bottom panel) showing migrating GnRH neurons (green) and Nos1 protein expression (red). N>3 independent litters. (c) Electrophysiological recordings of the spontaneous activity of preoptic area GnRH neurons in late infantile (P14-P21) Gnrh::Gfp; Nos1+/+ and Gnrh::Gfp; Nos1-/- bigenic mice. Upper panels: representative trace of spontaneous firing in a GnRH neuron from a Nos1+/+ (left panel) and a Nos1-/- (right panel) animal. The bottom trace shows an expansion of a small region of the top trace. Bottom panel: quantification of spontaneous firing frequency in GnRH neurons from Gnrh::Gfp; Nos1+/+ and Gnrh::Gfp; Nos1-/- mice (unpaired t-test, n=12,14 cells, N=5,6 mice). (d) RT-PCR analysis of Gnrh expression in FACS-isolated GnRH-GFP neurons from Gnrh::Gfp; Nos1+/+, Gnrh::Gfp; Nos1+/- and Gnrh::Gfp; Nos1-/- bigenic mice at P12 (n=8,9,8) and P23 (n=8,7,10). Gnrh::Gfp; Nos1+/+ values are compared to those of Gnrh::Gfp; Nos1+/- and Gnrh::Gfp; Nos1-/- mice (Kruskal-Wallis test with Dunn’s post-hoc test at P12 and one-way ANOVA with Dunnett’s post-hoc test at P23) * P < 0.05; ** P < 0.01. Red asterisks: comparison between mice of the same genotype at P12 and P23 (Mann Whitney U test). (e) FSH levels at P12, P16, P23 and P30 in Nos1+/+, Nos1+/- and Nos1-/- female mice treated or not with iNO (grey-shaded area) or Sildenafil (blue-shaded area) during the infantile period. FSH values for Nos1+/+ are compared to those of Nos1+/- and Nos1-/- mice for each group of measurements (one-way ANOVA with Dunnett’s post-hoc test; P12: n=10,19,11; P16: n=11,11,8; P23: untreated, n=9,29,7; Sildenafil-treated, n=4,5,6; iNO-treated, n=5,7,4; P30: n=10,9,10; Kruskal-Wallis test with Dunn’s post-hoc test at P23). Red asterisks: comparison between mice of the same genotype but subjected to different treatments (one-way ANOVA with Dunnett’s post-hoc test). (f) LH levels at P12 (n=11,9,9) and P23 (n=12,5,8) in Nos1+/+, Nos1+/- and Nos1-/- female mice. Nos1+/+ LH values are compared to those of Nos1+/- and Nos1-/- mice for each age (P12: Kruskal-Wallis test with Dunn’s post-hoc test; P23: one-way ANOVA with Dunnett’s post-hoc test). *** P<0.001. Values indicate means ± SEM. N=4-8 independent litters. (g-i) Estradiol, (g) inhibin B (h) and AMH (i) levels at P12, P23 and P40 in Nos1+/+, Nos1+/- and Nos1-/- female mice. P12: n=8,10,10 (g); n=7,7,7 (h); n=6,6,8 (i). P23: n=10,11,10 (g); n=7,5,7 (h); n=8,8,8 (i). P40: n=9,11,10 (g); n=7,7,7 (h); n=8,8,8 (i). Nos1+/+ LH values are compared to those of Nos1+/- and Nos1-/- mice for each group of measurements (g,h: one-way ANOVA with Dunnett’s post-hoc test; i: Kruskal-Wallis test with Dunn’s post-hoc test). Values indicate means ± SEM. N=3-8 independent litters. *P<0.05; **P<0.01; *** P<0.001.
Figure 6
Figure 6. The action of NO during the critical infantile period is required for establishing a sexually mature phenotype.
(a) Age at vaginal opening or (c) puberty and (d) adult estrous cyclicity in Nos1+/+, Nos1+/- and Nos1-/- female mice untreated (a: n=7,11,6; c: n=5,6,8; d: n=5,6,6) or treated with iNO (grey-shaded area, a: n=6,7,6; c: n=6,7,6; d: n=7,8,5) or Sildenafil (blue-shaded area, a: n=4,7,7; c: n=4,7,7; d: n=4,5,7) during the infantile period. Nos1+/+ values are compared to those of Nos1+/- and Nos1-/- mice for each group of measurements [one-way ANOVA with Dunnett’s post-hoc test for a (untreated) or Kruskal-Wallis with Dunn’s post-hoc test were used as detailed in Table S2]. Red asterisks: comparison between mice of the same genotype but subjected to different treatments (a: one-way ANOVA with Dunnett’s post-hoc test, b,d: Kruskal-Wallis with Dunn’s post-hoc test). (b) Age at balanopreputial separation in Nos1+/+, Nos1+/- and Nos1-/- male mice untreated (n=4,9,3) or treated with Sildenafil (blue-shaded area, n=3,13,5). Nos1+/+ values are compared to those of Nos1+/- and Nos1-/- mice for each group of measurements (Kruskal-Wallis test with Dunn’s post-hoc test). Red asterisks: comparison between mice of the same genotype but subjected to different treatments (unpaired t-test). (e-h) Age at vaginal opening (e) and puberty (f) (unpaired t-test; n=10,9), and adult estrous cyclicity (g) (Mann-Whitney U test; n=8,7) after daily injections of vehicle or L-NAME during the infantile period. (h) LH levels in diestrus and proestrus female mice subjected or not to LNAME treatment during the infantile period (Mann-Whitney U test; n=5,5). ** P = 0.008. Values indicate means ± SEM. N>3 independent litters. *P<0.05; **P<0.01; *** P<0.001.

References

    1. Boehm U, Bouloux PM, Dattani MT, de Roux N, Dode C, Dunkel L, Dwyer AA, Giacobini P, Hardelin JP, Juul A, Maghnie M, et al. Expert consensus document: European Consensus Statement on congenital hypogonadotropic hypogonadism--pathogenesis, diagnosis and treatment. Nat Rev Endocrinol. 2015;11:547–564. - PubMed
    1. Pingault V, Bodereau V, Baral V, Marcos S, Watanabe Y, Chaoui A, Fouveaut C, Leroy C, Verier-Mine O, Francannet C, Dupin-Deguine D, et al. Loss-of-function mutations in SOX10 cause Kallmann syndrome with deafness. Am J Hum Genet. 2013;92:707–724. - PMC - PubMed
    1. Aydogan U, Aydogdu A, Akbulut H, Sonmez A, Yuksel S, Basaran Y, Uzun O, Bolu E, Saglam K. Increased frequency of anxiety, depression, quality of life and sexual life in young hypogonadotropic hypogonadal males and impacts of testosterone replacement therapy on these conditions. Endocr J. 2012;59:1099–1105. - PubMed
    1. Lasaite L, Ceponis J, Preiksa RT, Zilaitiene B. Impaired emotional state, quality of life and cognitive functions in young hypogonadal men. Andrologia. 2014;46:1107–1112. - PubMed
    1. Kuiri-Hanninen T, Sankilampi U, Dunkel L. Activation of the hypothalamic-pituitary-gonadal axis in infancy: minipuberty. Horm Res Paediatr. 2014;82:73–80. - PubMed

Publication types