. 2022 Nov:90:106187.
doi: 10.1016/j.ultsonch.2022.106187. Epub 2022 Sep 30.

Temperature as a key parameter for graphene sono-exfoliation in water

Affiliations

Temperature as a key parameter for graphene sono-exfoliation in water

Amanpreet Kaur et al. Ultrason Sonochem. 2022 Nov.

Abstract

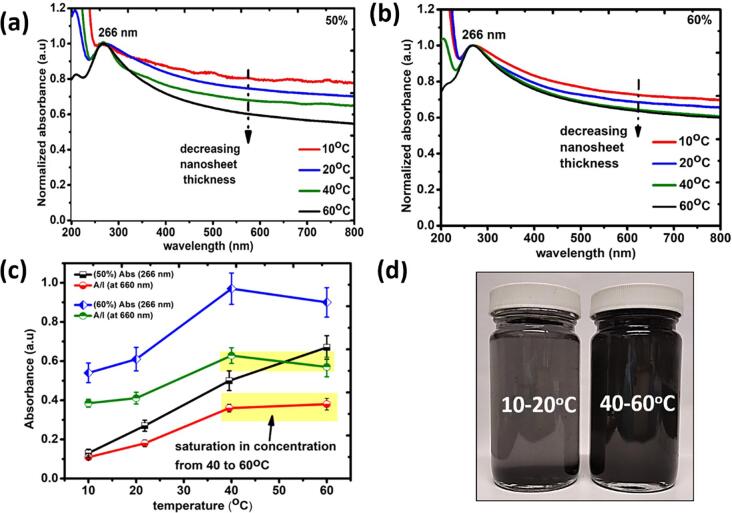
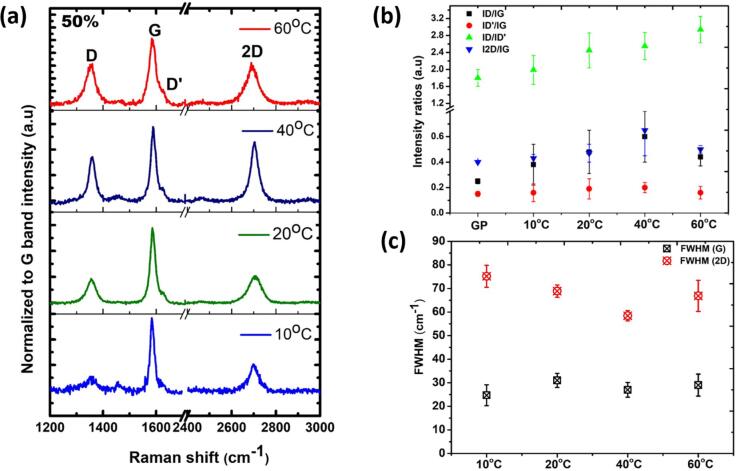
Graphene dispersions in water are highly desirable for a range of applications such as biomedicines, separation membranes, coatings, inkjet printing and more. Recent novel research has been focussed on developing a green approach for scalable production of graphene. However, one important parameter, which is often neglected is the bulk temperature of the processing liquid. This paper follows our earlier work where optimal sono-exfoliation parameters of graphite in aqueous solutions were determined based on the measured acoustic pressure fields at various temperatures and input powers. Here, we take the next step forward and demonstrate using systematic characterisation techniques and acoustic pressure measurements that sonication-assisted liquid phase exfoliation (LPE) of graphite powder can indeed produce high quality few layer graphene flakes in pure water at a specific temperature, i.e. 40 °C, and at an optimised input generator power of 50%, within 2-h of processing. UV-vis analysis also revealed that the exfoliation, stability and uniformity of dispersions were improved with increasing temperature. We further confirmed the successful exfoliation of graphene sheets with minimal level of defects in the optimized sample with the help of Raman microscopy and transmission electron microscopy. This study demonstrated that understanding and controlling processing temperature is one of the key parameters for graphene exfoliation in water which offers a potential pathway for its large-scale production.

Keywords: Cavitation bubbles; Eco-friendly; Exfoliation; Graphene; Shock waves; Ultrasonic processing; Water.


Conflict of interest statement

Declaration of Competing Interest The authors declare that they have no known competing financial interests or personal relationships that could have appeared to influence the work reported in this paper.

Figures

Fig. 1
Fig. 1
The schematic illustration for performing ULPE of graphene coupled with acoustic detection equipments.
Fig. 2
Fig. 2
(a), (b) normalized UV–vis absorption spectra obtained for graphene supernatants after ULPE at different temperatures for 50 % and 60 % input powers respectively; (c) plot featuring the trend of Abs (266 nm) and A/ℓ (660 nm) (Y-axis) as a function of processing temperature (X-axis) for both 50 % and 60 % input powers; (d) post-2 h sonication (without centrifugation) obtained slurries showing poor dispersibility at 10–20 °C (greyish transparent) in comparison to 40–60 °C (black).
Fig. 3
Fig. 3
Sedimentation plots of graphene suspension in DIW over 15 days at room temperature; (a) 50 %–40 °C, 50 %–60 °C and (b) 60 %–40 °C, 60 %–60 °C, respectively.
Fig. 4
Fig. 4
(a) Representative Raman spectra of observed flakes found in each sample processed at 50% input power featuring D, G, D’ and 2D peaks, spectra are normalized to the G band intensity; (b) Averaged intensity ratios of peaks, ID/IG (black squares), ID’/IG (red circles), ID/ID’ (green triangles) and I2D/IG (blue triangles) of registered flakes in each sample. The data for original GP is also provided alongside for reference; (c) Plot of the FWHM of G and 2D band as a function of processing temperature.
Fig. 5
Fig. 5
(a) Representative TEM image of graphene flakes exfoliated in 50 %–40 °C samples; (b) High-Resolution (HR-TEM) image of the corresponding flake; (c) average aspect ratio (<L>/<W>) and area of exfoliated flakes (with error margins).
Fig. 6
Fig. 6
Acoustic pressure measurements taken with sensors for solution temperatures of 10 °C, 20 °C, 40 °C, & 60 °C, comparing 50 % and 60 % transducer input power. FOH measurements of a) RMS pressure; b) Pmax. NH measurements of c) RMS pressure; d) Pmax. Note different Y-axes scales.
Fig. 7
Fig. 7
Schematic representation of underlying mechanism for the effect of temperature on graphene exfoliation; (a) 10–20 °C; (b) 40 °C; (c) 60 °C. Note the thickness of SW curves indicating their intensity as captured by the acoustic sensor.
Fig. 8
Fig. 8
Acoustic pressure spectrum obtained with sensors for solution temperature of 10 °C, 20 °C, 40 °C, & 60 °C, comparing 50 % and 60 % transducer input power using FOH (a & b) and NH (c & d). Note different Y-axes scales.

References

    1. Coleman J.N., Lotya M., O’Neill A., Bergin S.D., King P.J., Khan U., Young K., Gaucher A., De S., Smith R.J., Shvets I.V. Science. 2011;331:6017. doi: 10.1126/science.1194975. - DOI - PubMed
    1. K.S. Novoselov, L.Colombo, P.R. Gellert, M.G. Schwab, M.G., K. Kim, Nature. 490, 7419 (2012). DOI: 10.1038/nature11458. - PubMed
    1. Wang T., Huang D., Yang Z., Xu S., He G., Li X., Hu N., Yin G., He D., Zhang L. Nano-Micro Lett. 2016;8:2. doi: 10.1007/s40820-015-0073-1. - DOI - PMC - PubMed
    1. Liao K.H., Lin Y.S., Macosko C.W., Haynes C.L. ACS Appl Mater. Interfaces. 2011;3:7. doi: 10.1021/am200428v. - DOI - PubMed
    1. A. Boretti, S. Al-Zubaidy, M. Vaclavikova, npj Clean Water, 1, 5 (2018). DOI: 10.1038/s41545-018-0004-z.

LinkOut - more resources