. 2022 Oct 4;41(1):111444.
doi: 10.1016/j.celrep.2022.111444.

A non-canonical retina-ipRGCs-SCN-PVT visual pathway for mediating contagious itch behavior

Affiliations

A non-canonical retina-ipRGCs-SCN-PVT visual pathway for mediating contagious itch behavior

Fang Gao et al. Cell Rep. .

Abstract

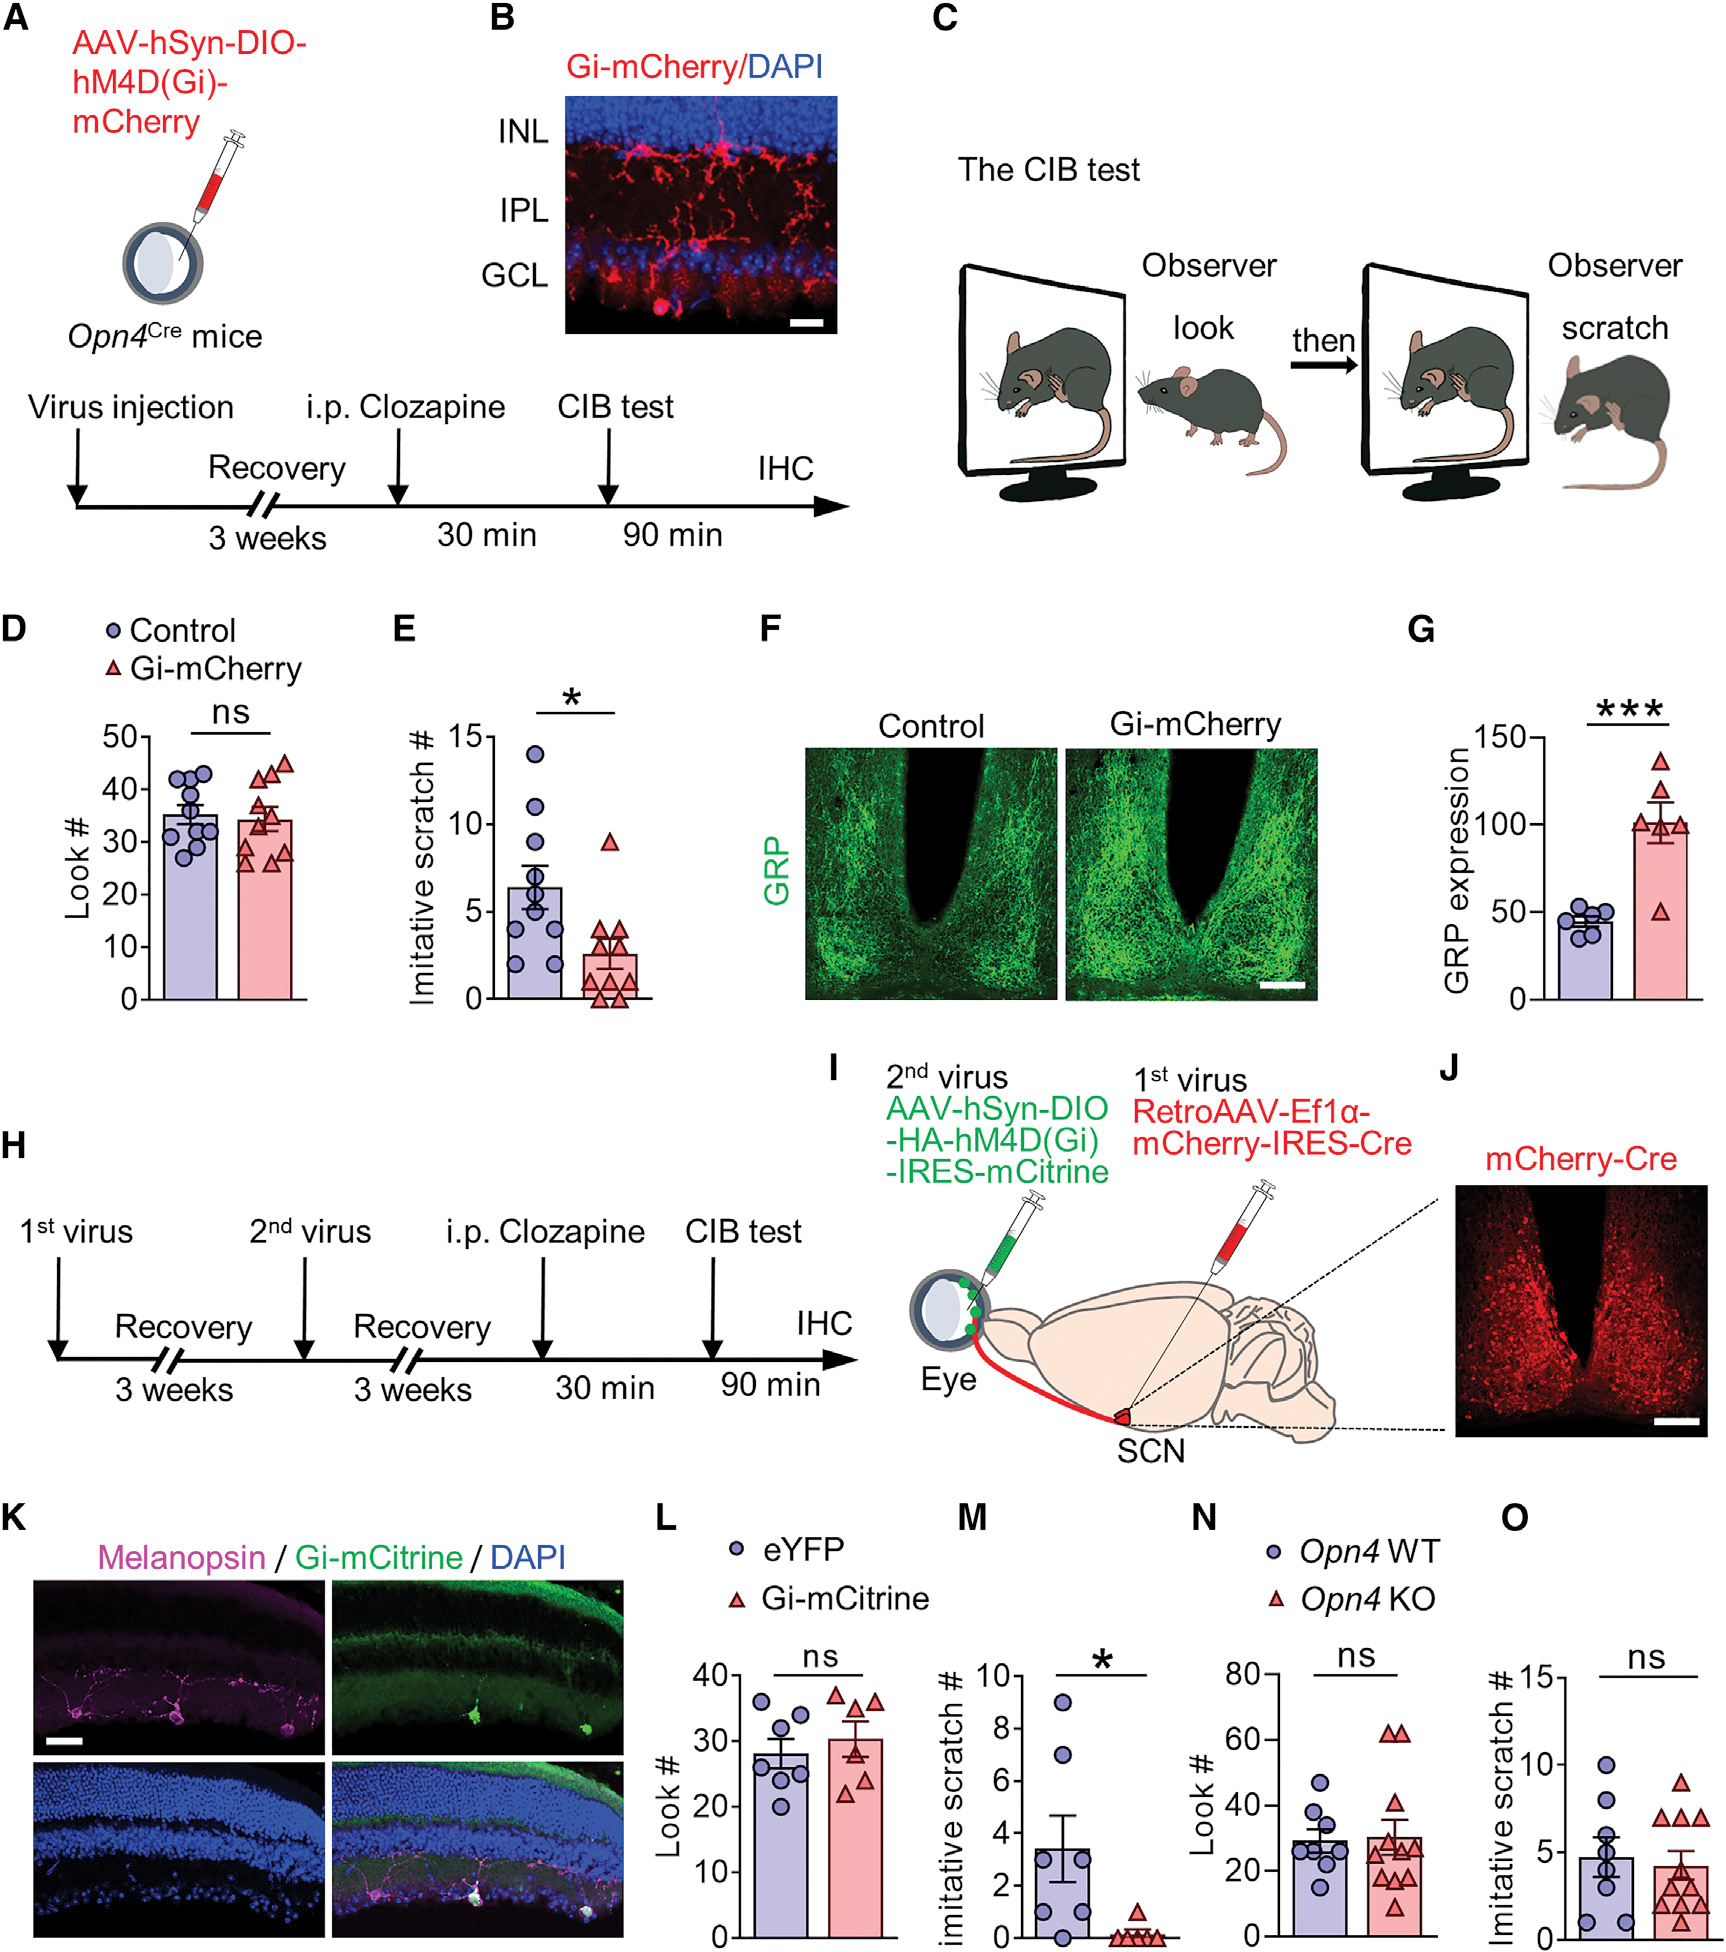
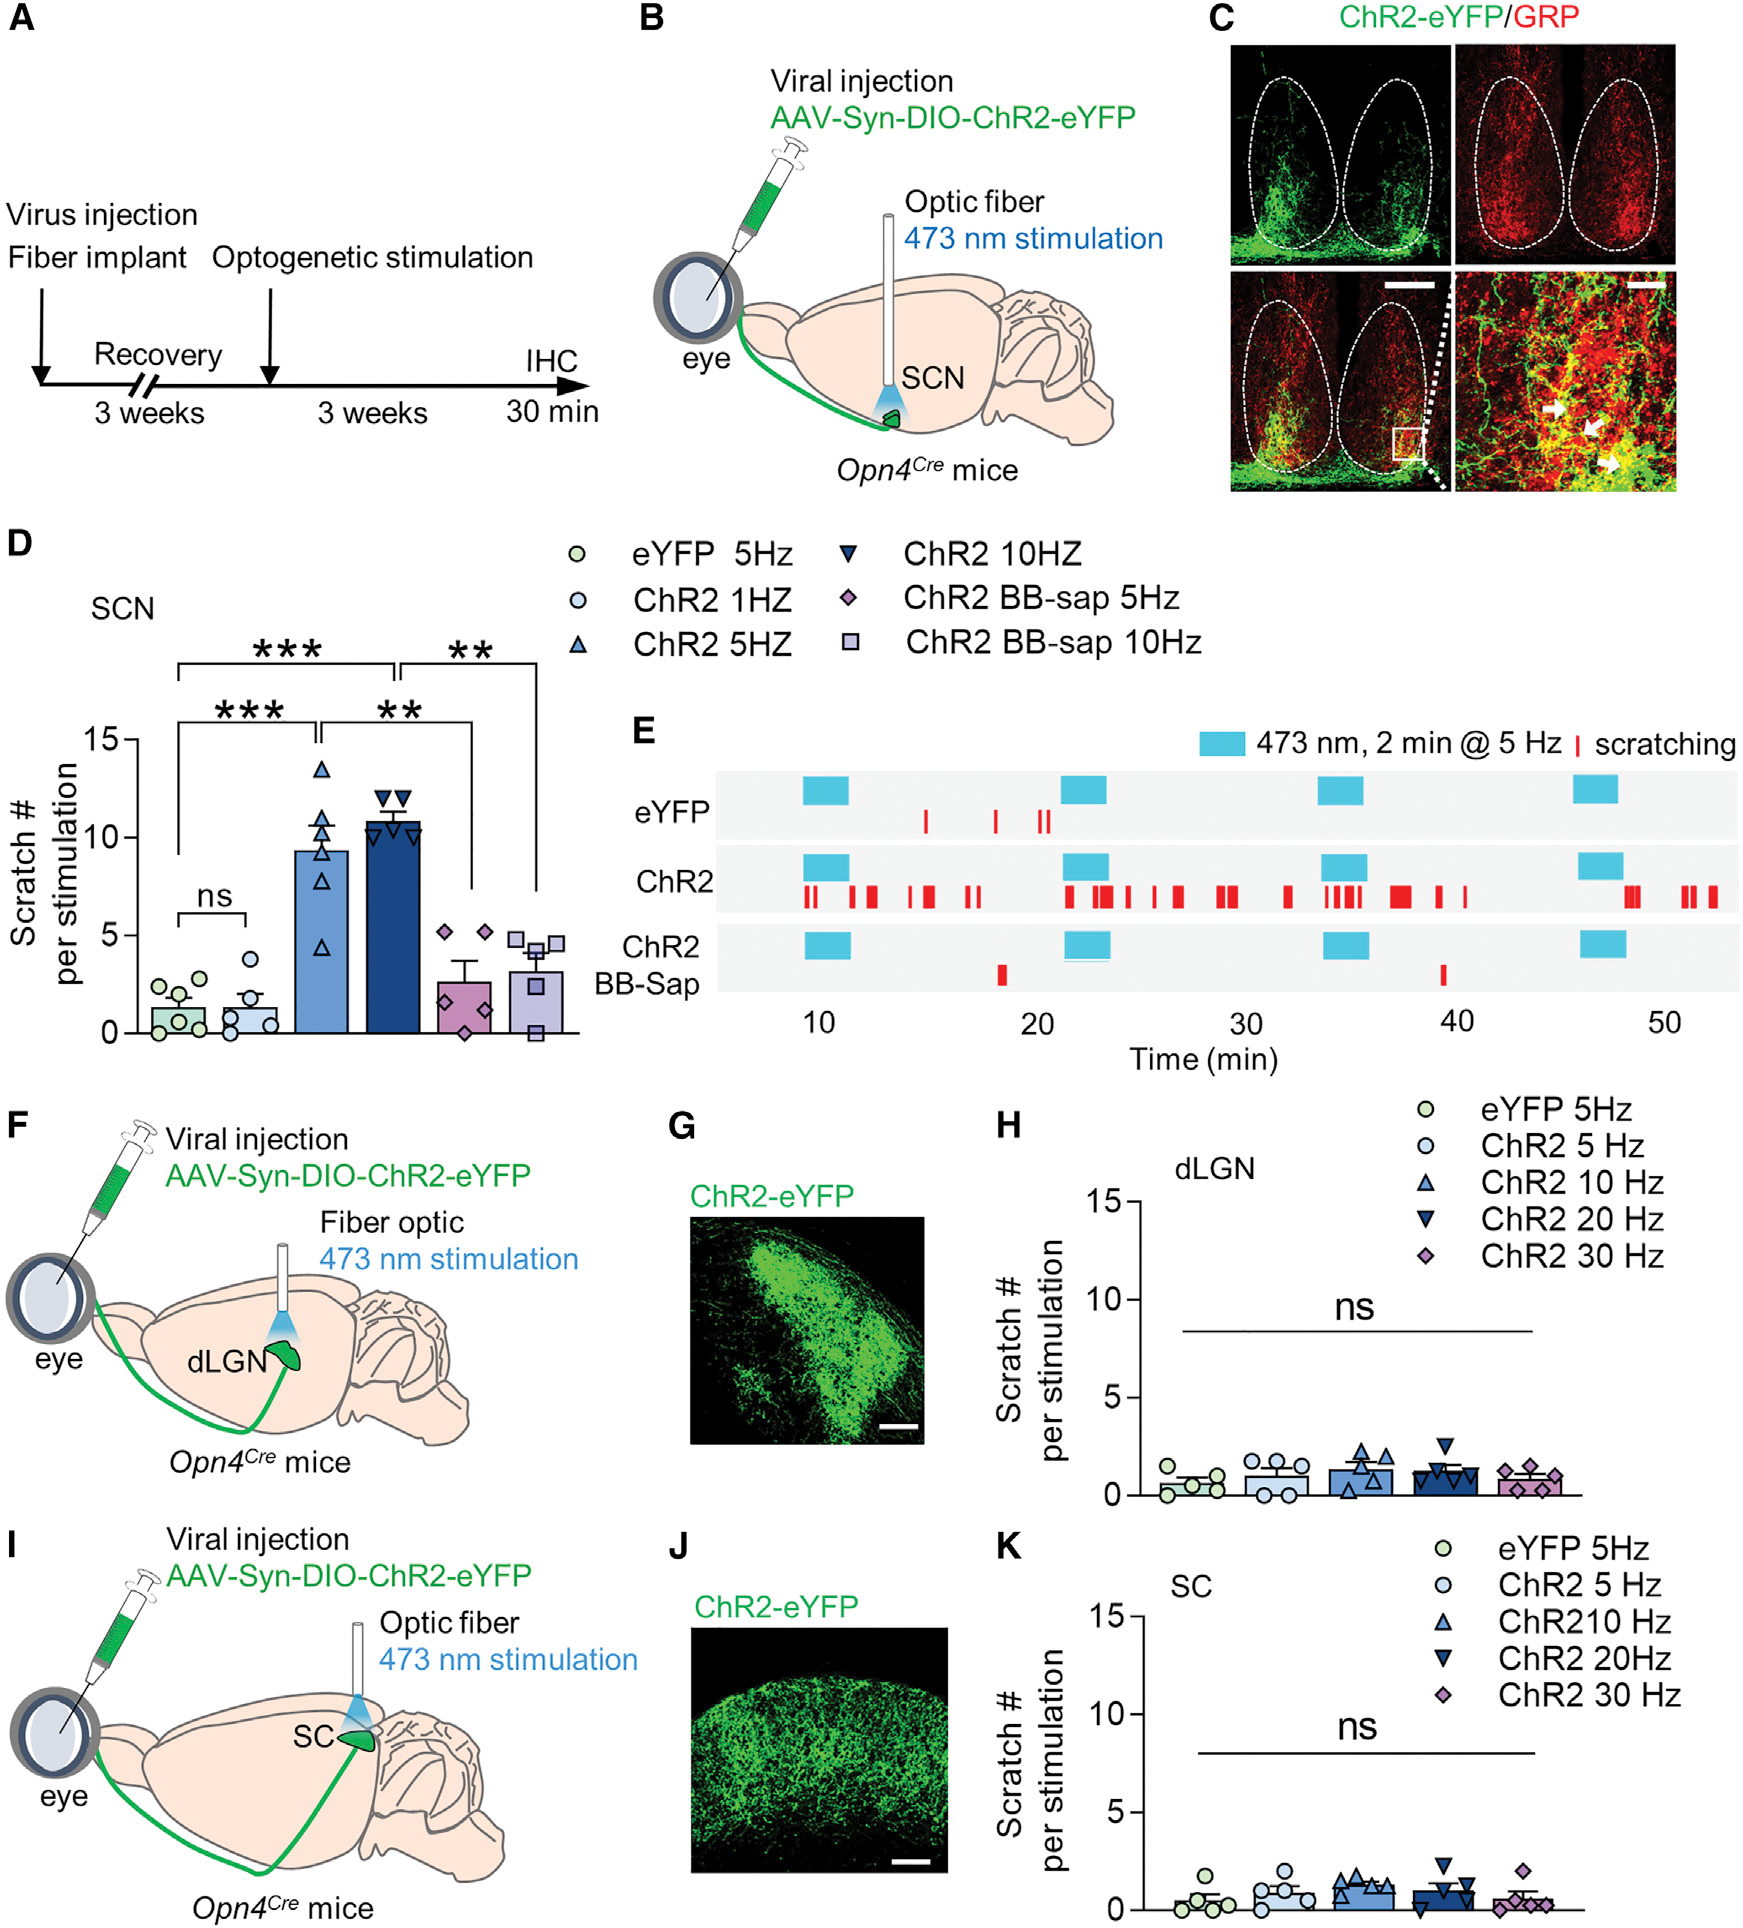
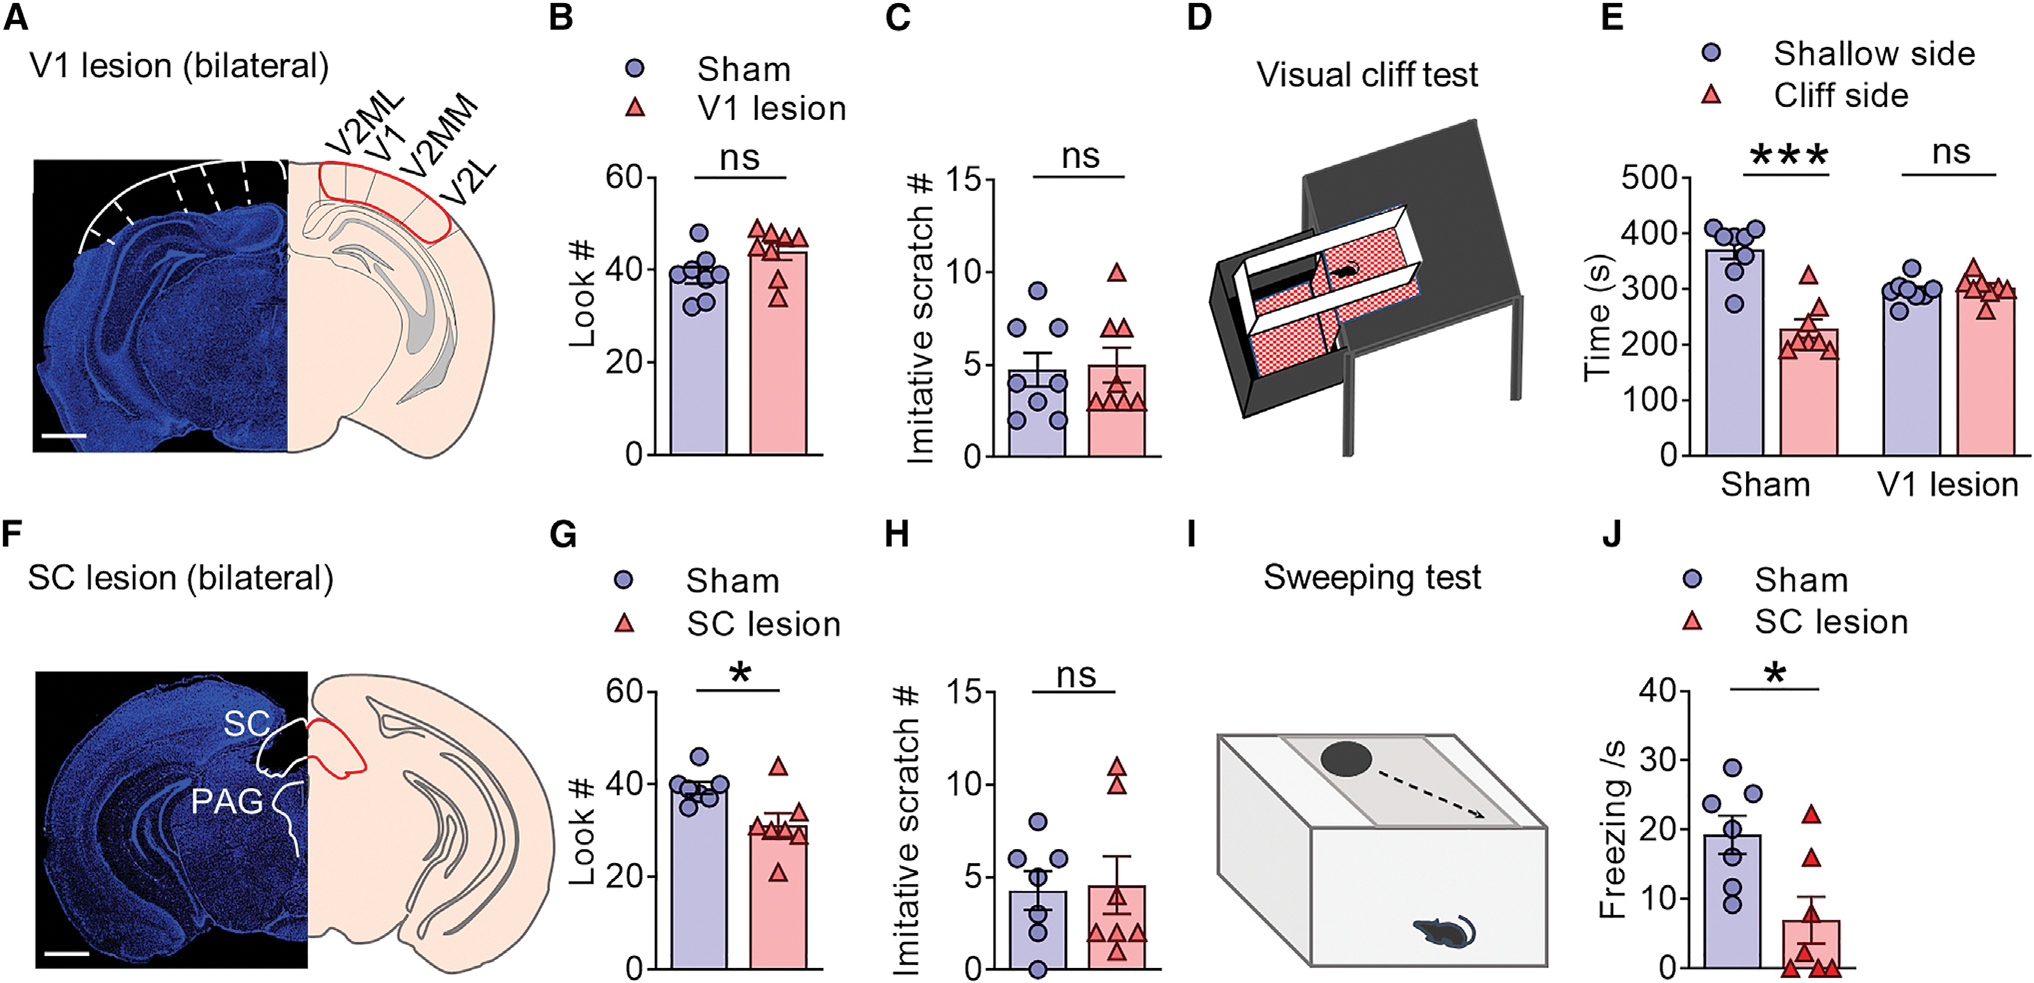
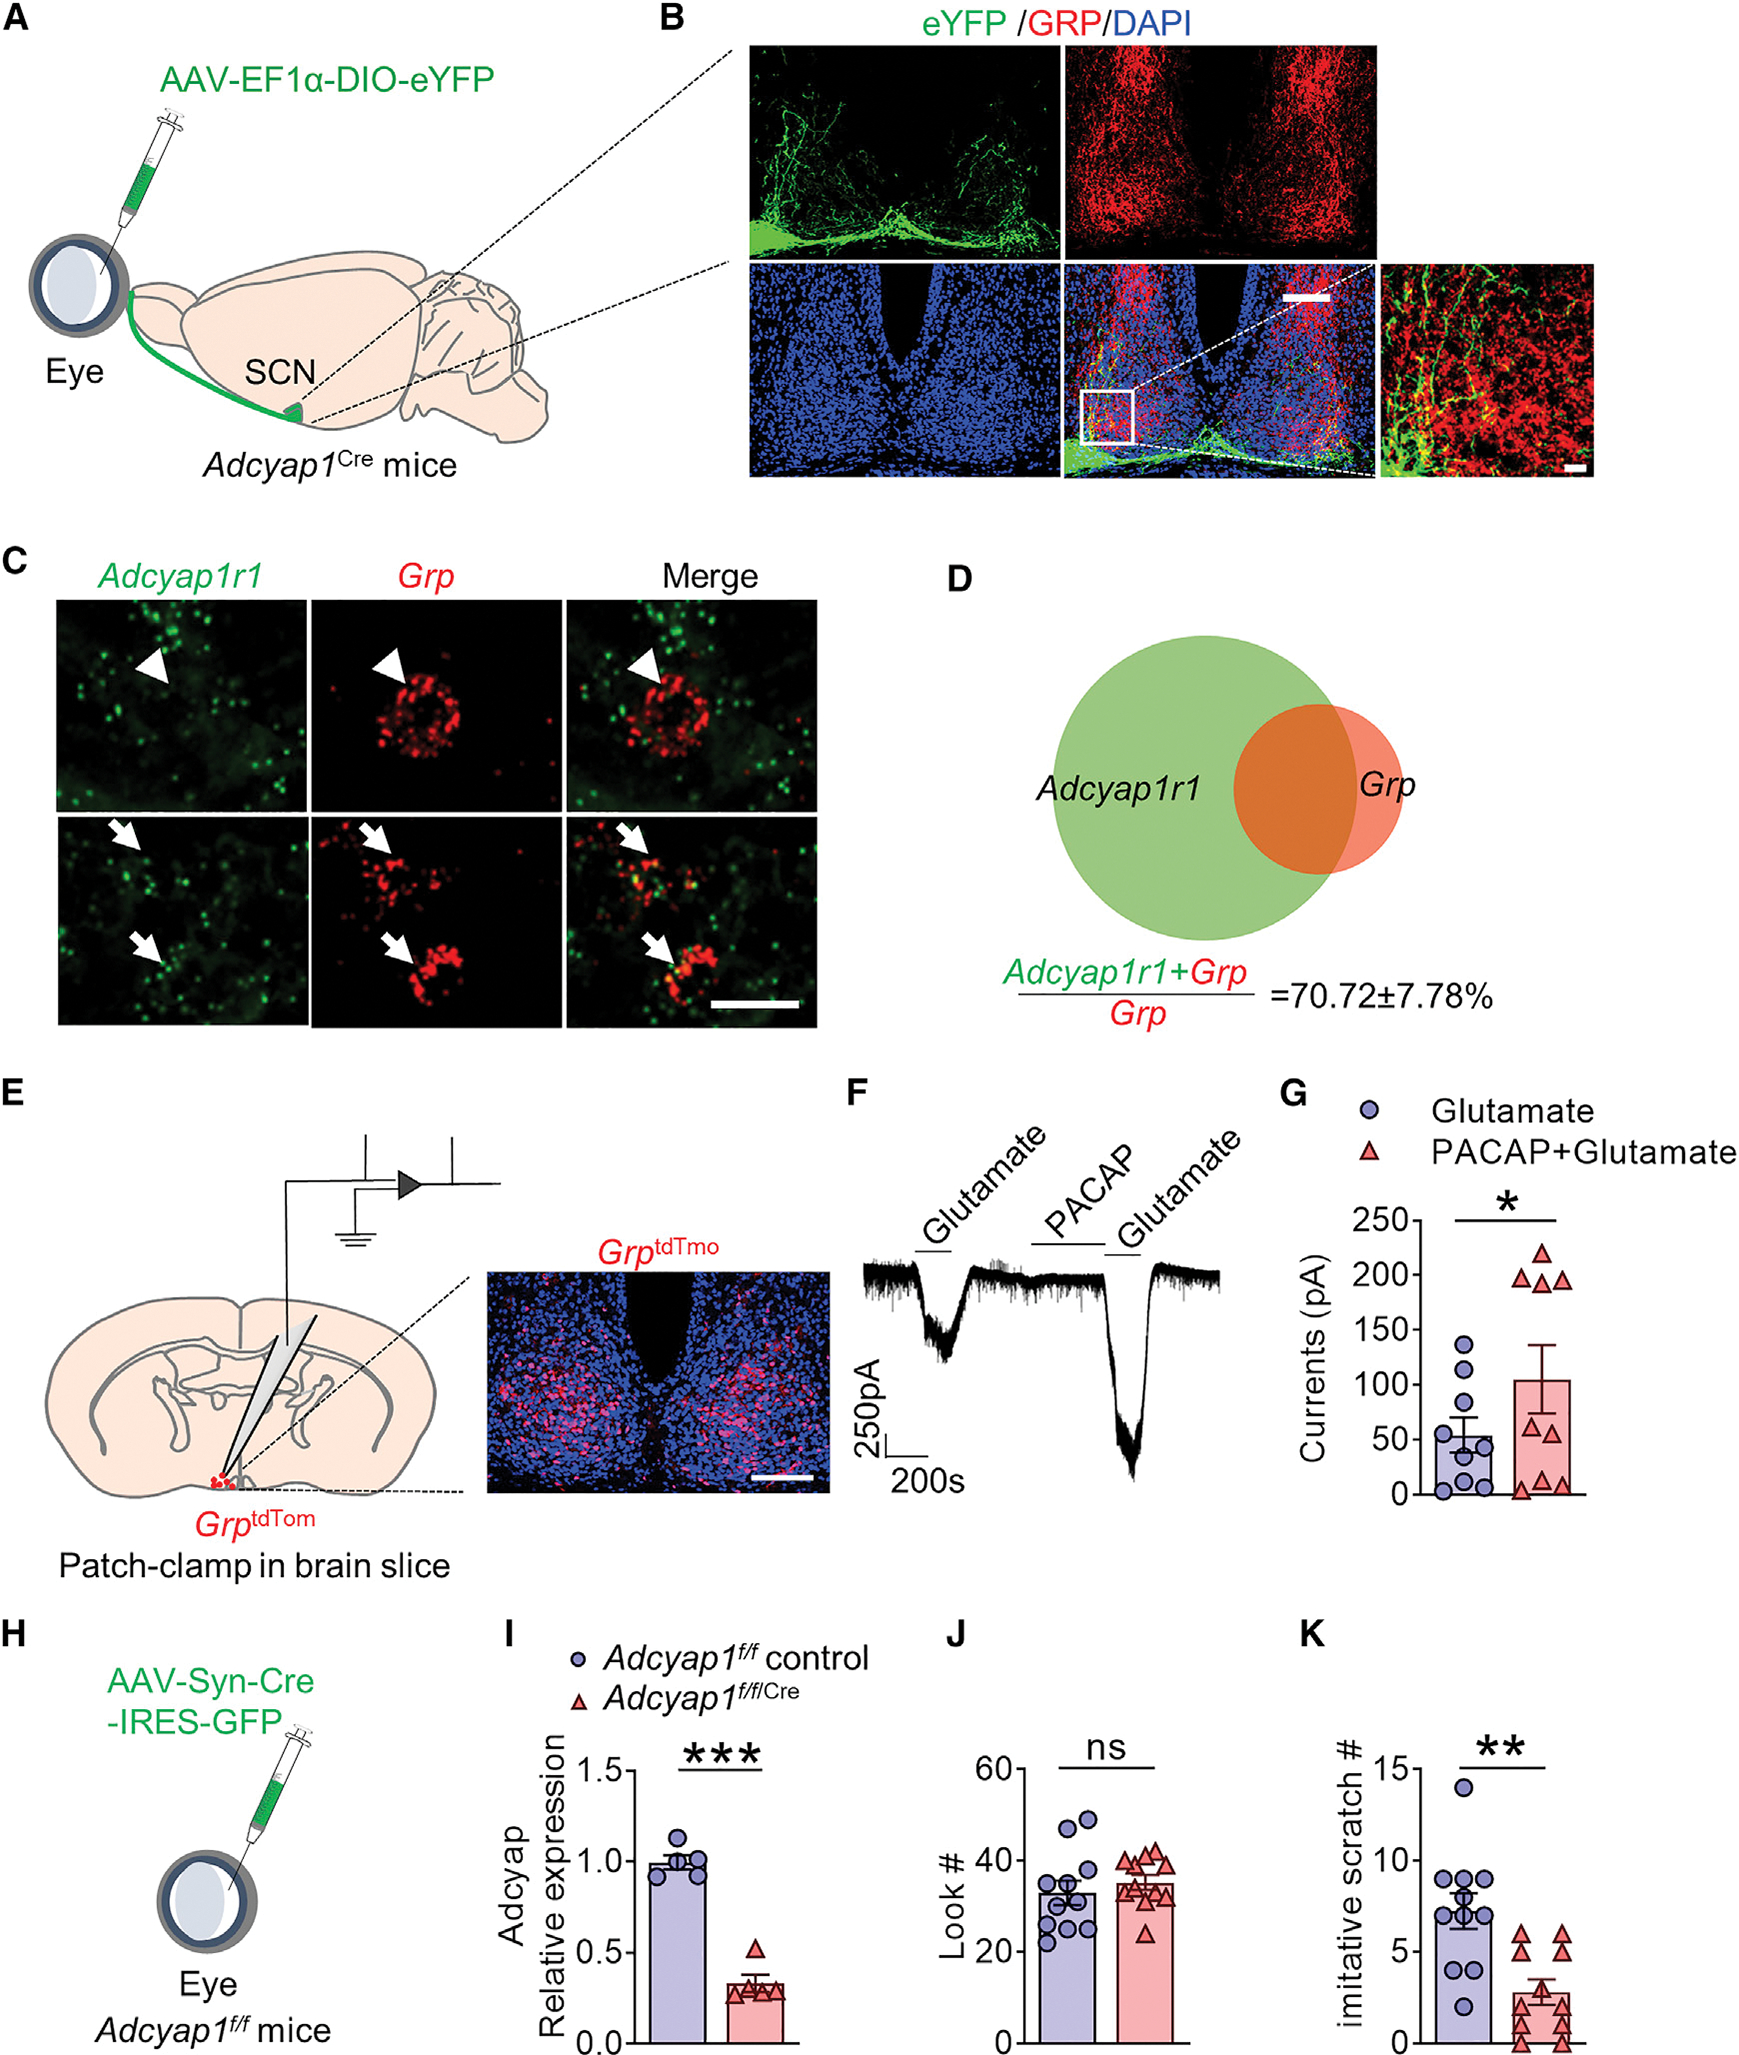
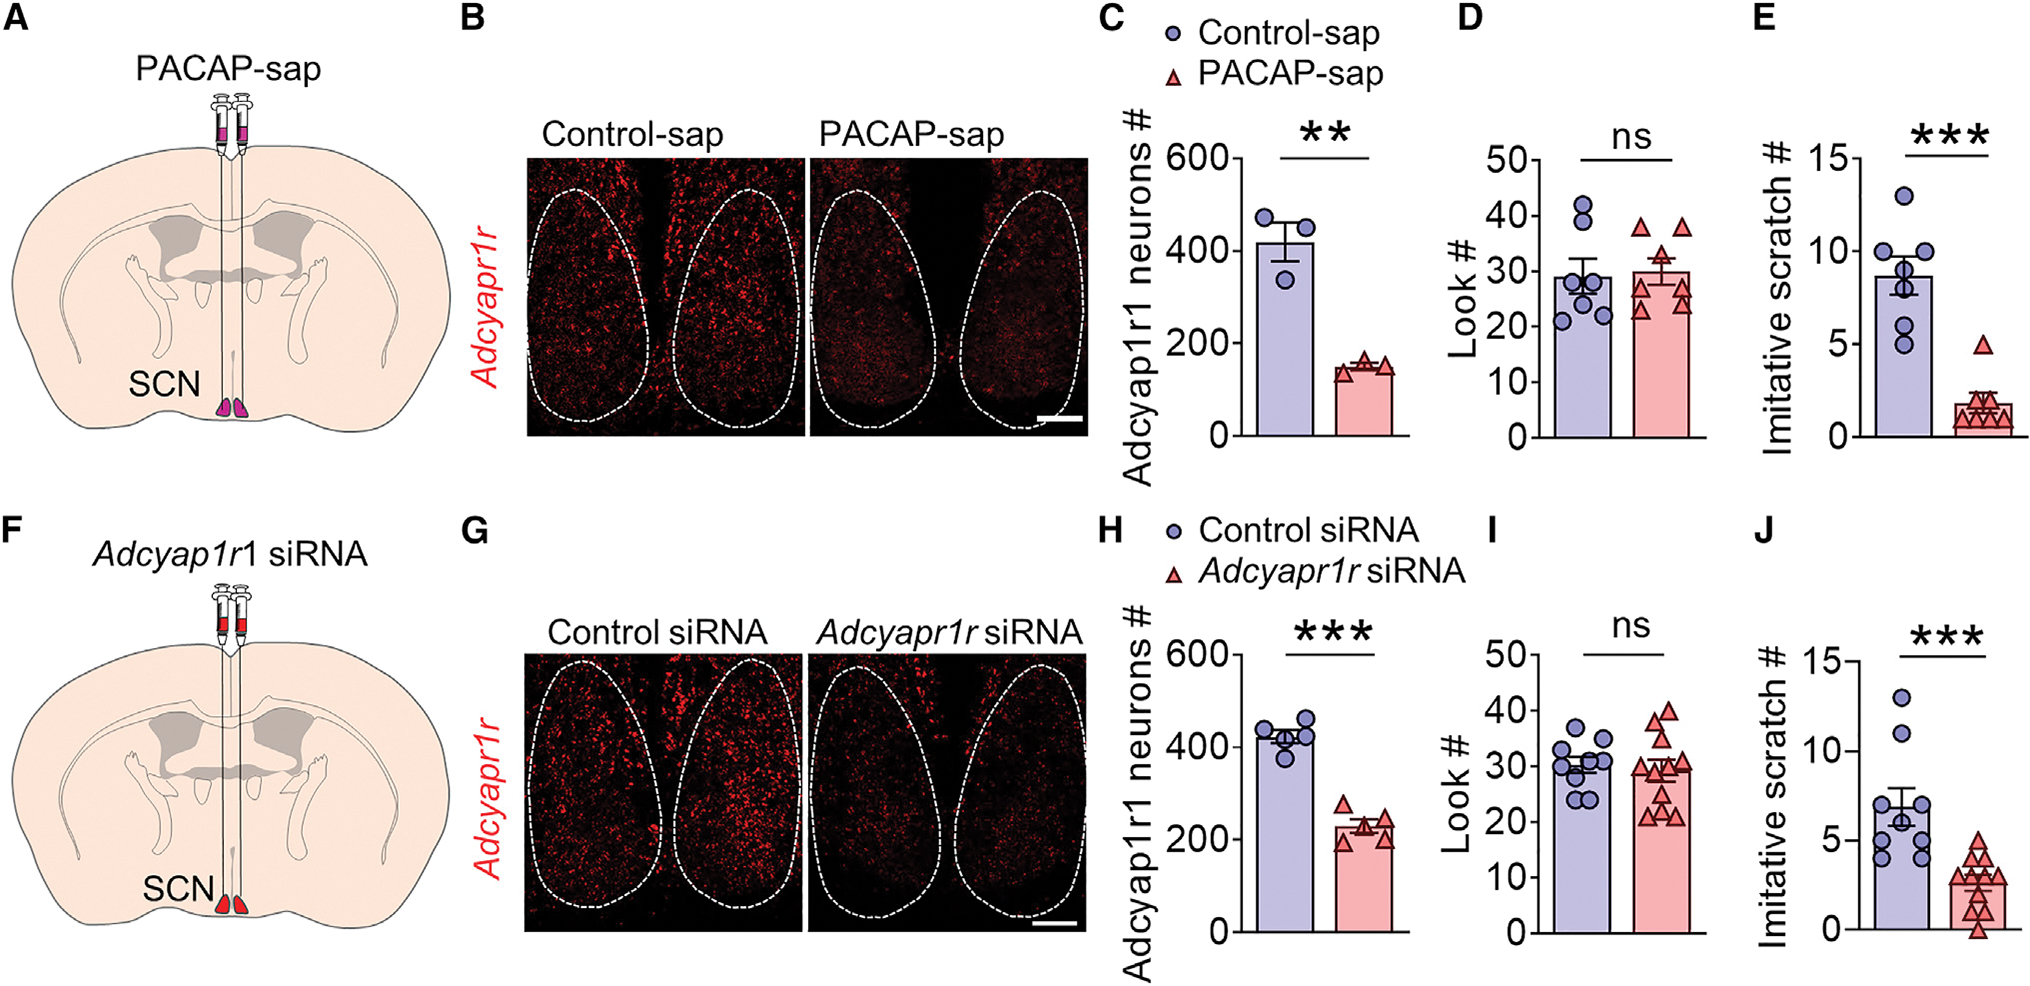
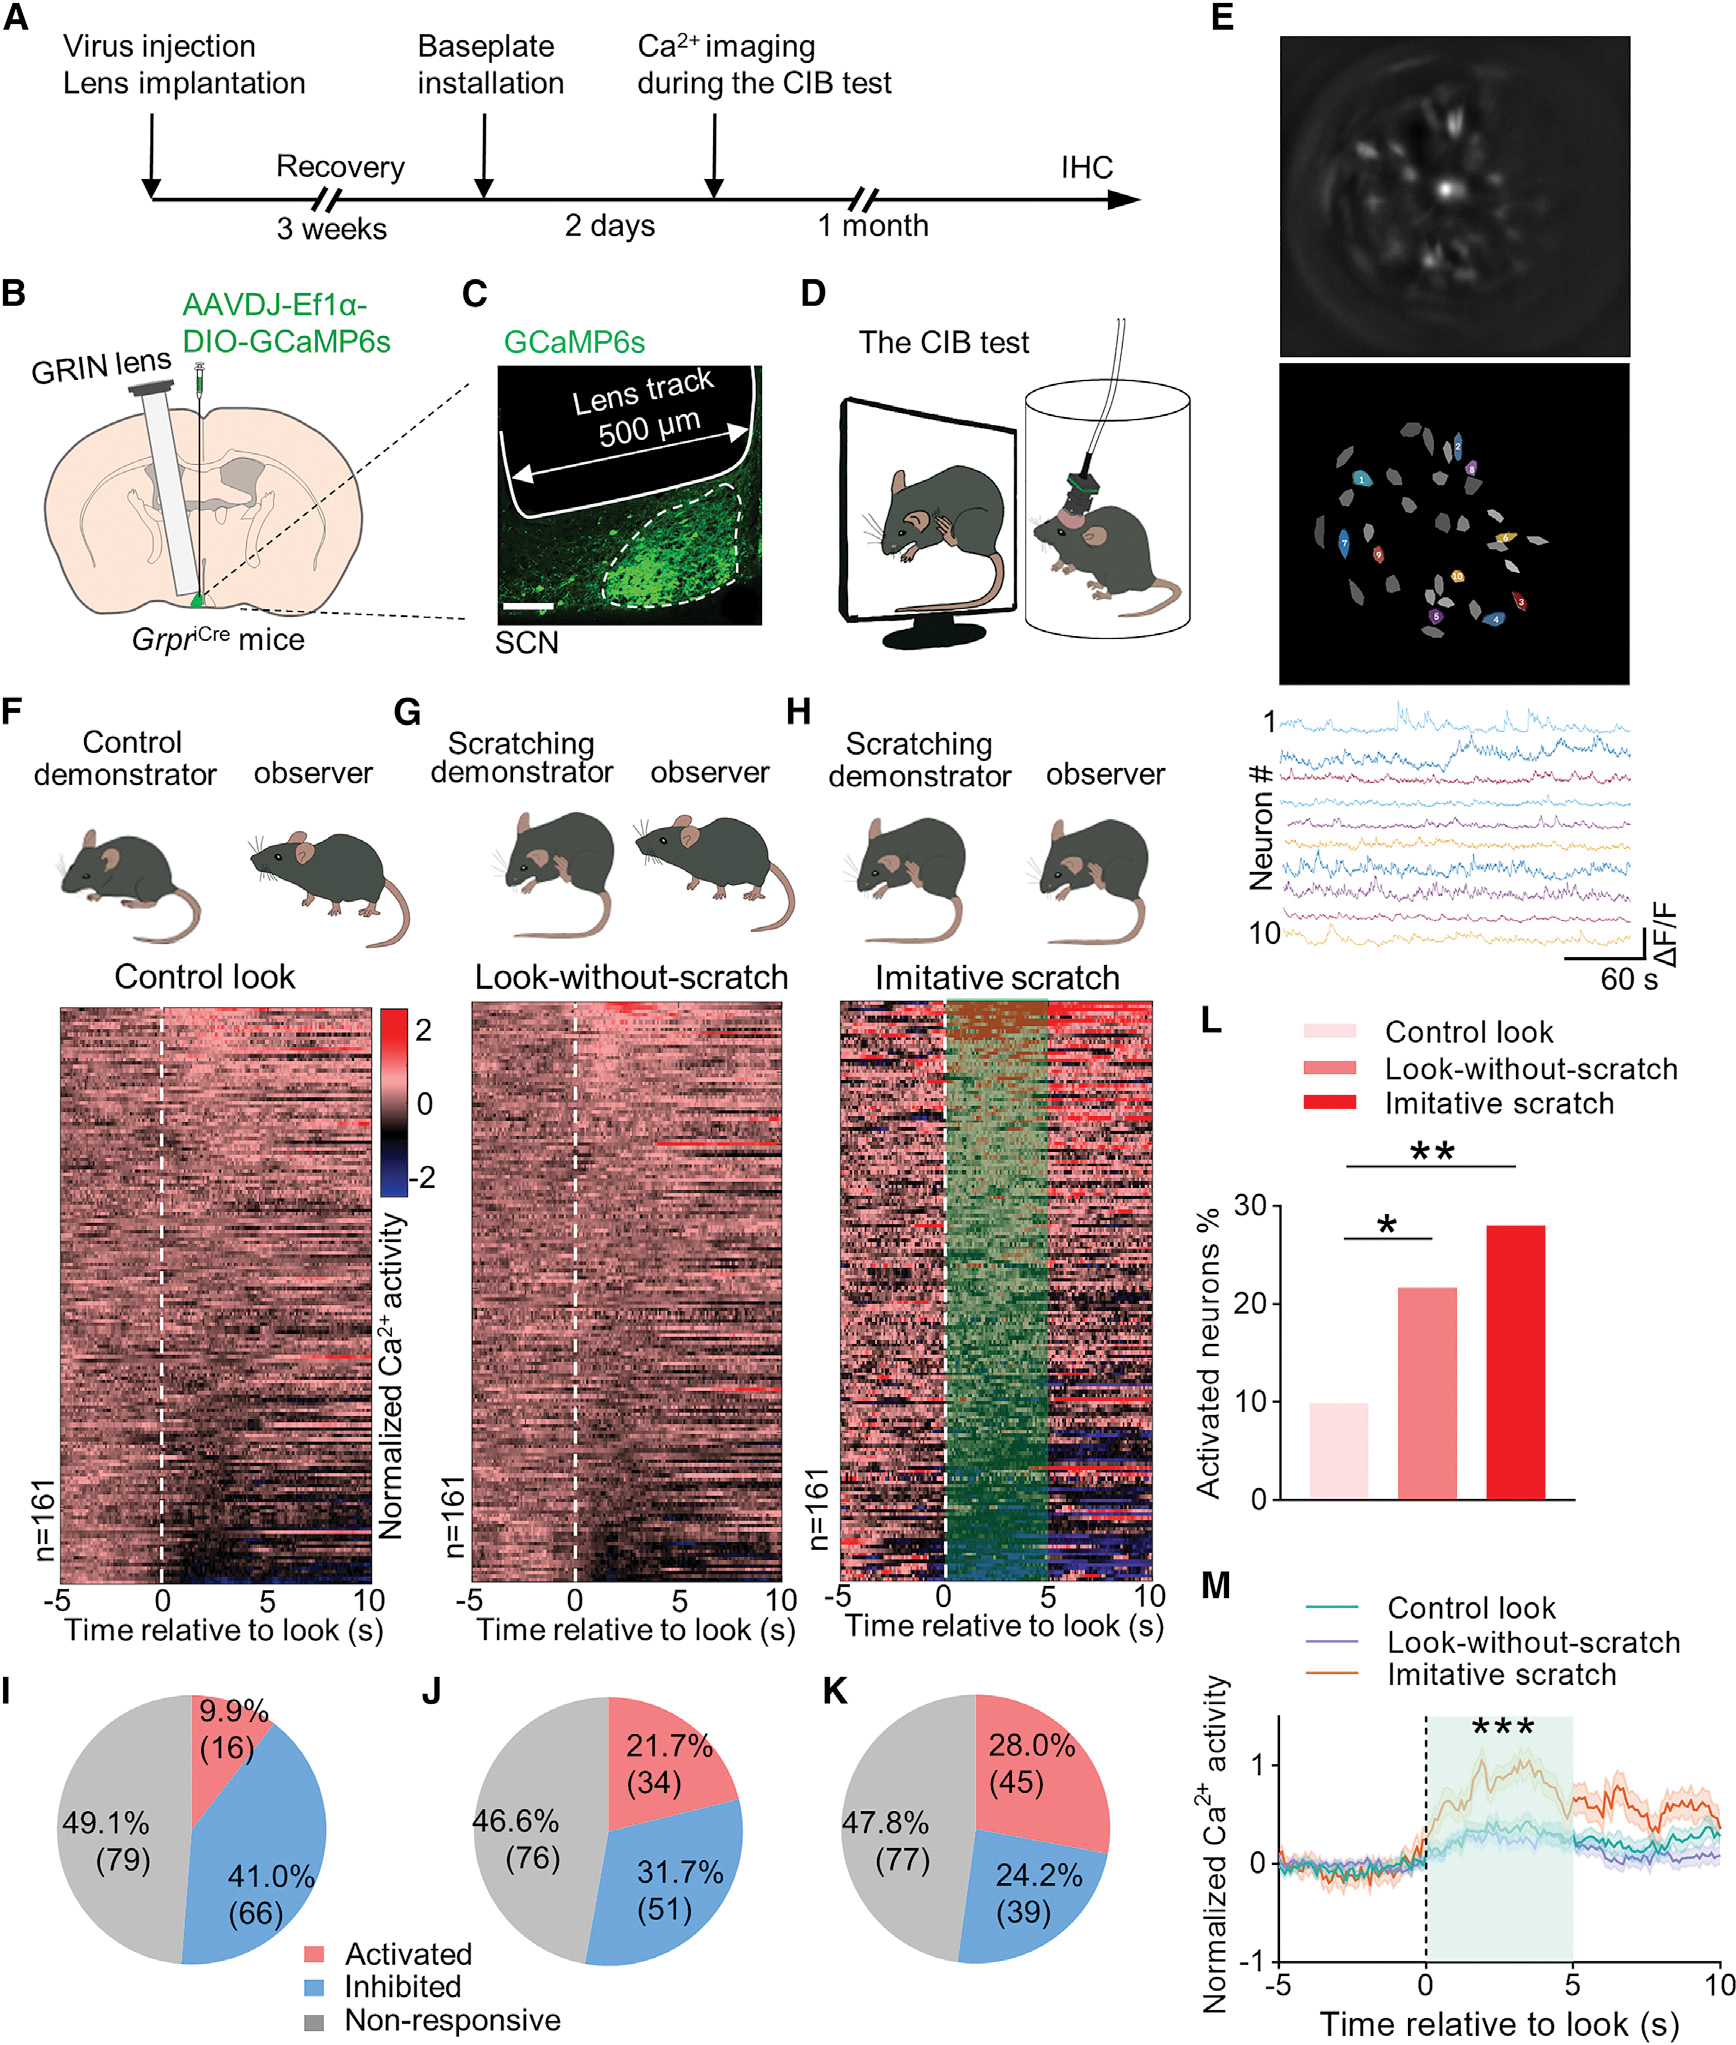
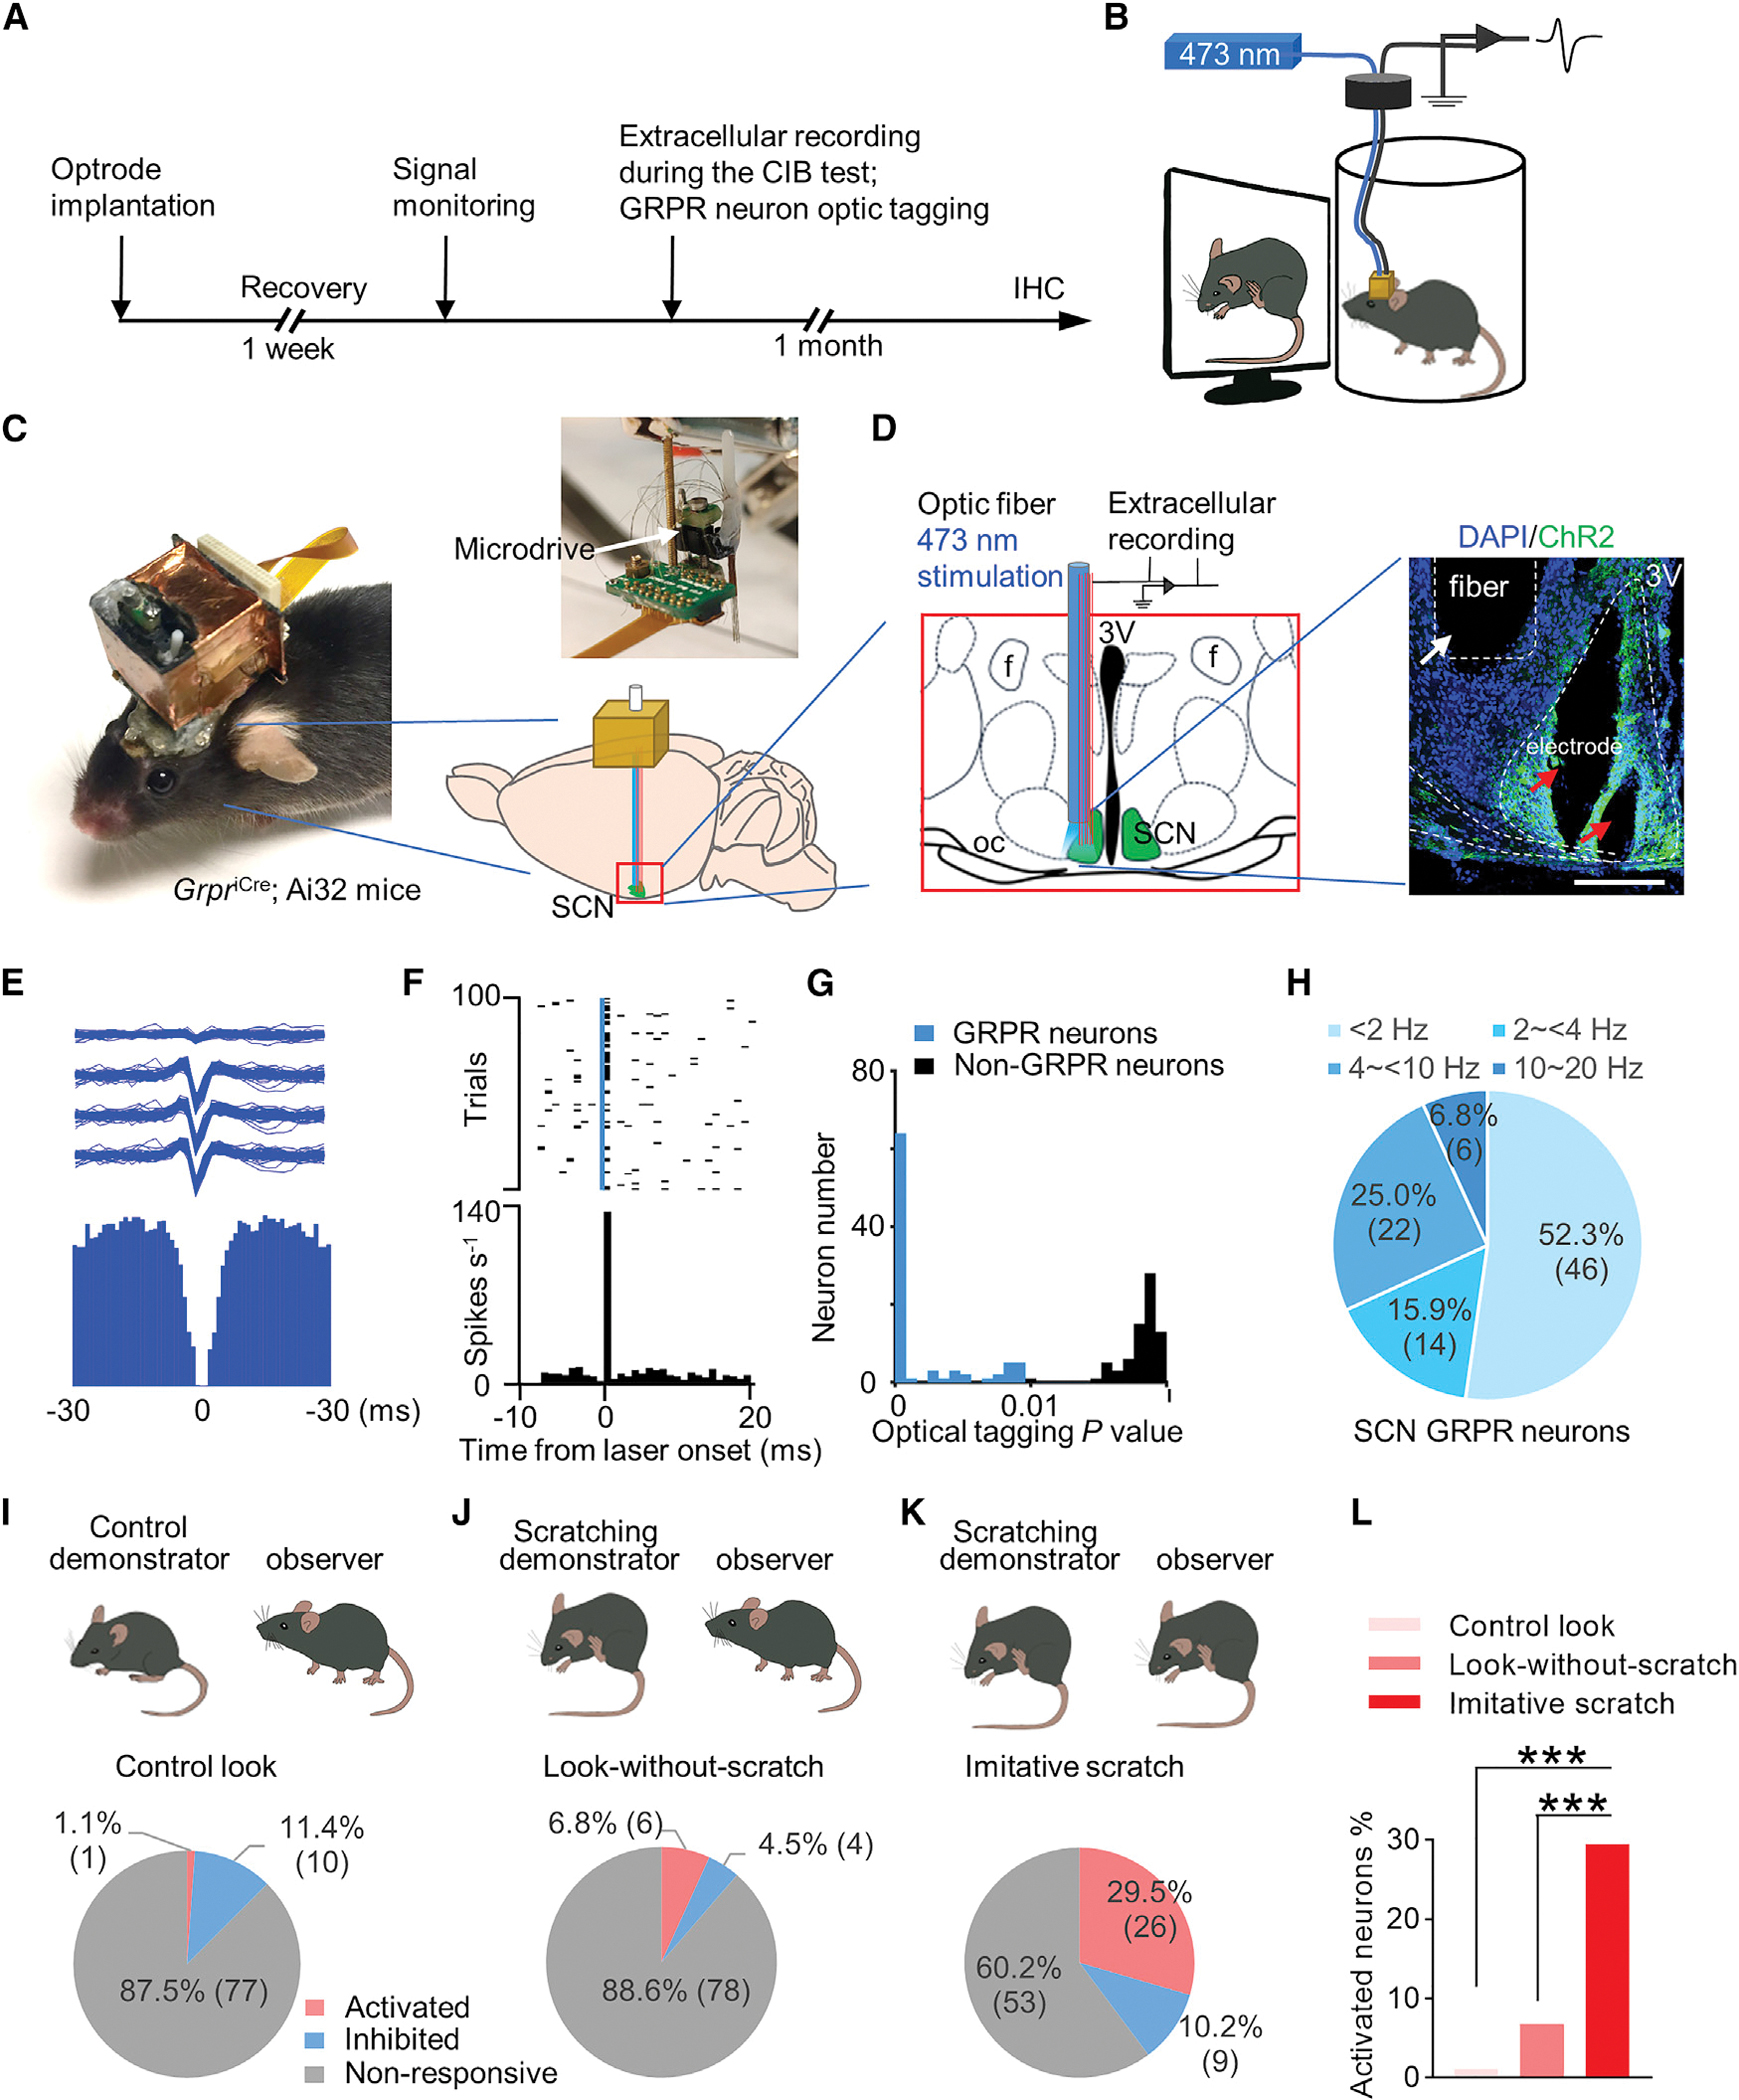
Contagious itch behavior informs conspecifics of adverse environment and is crucial for the survival of social animals. Gastrin-releasing peptide (GRP) and its receptor (GRPR) in the suprachiasmatic nucleus (SCN) of the hypothalamus mediates contagious itch behavior in mice. Here, we show that intrinsically photosensitive retina ganglion cells (ipRGCs) convey visual itch information, independently of melanopsin, from the retina to GRP neurons via PACAP-PAC1R signaling. Moreover, GRPR neurons relay itch information to the paraventricular nucleus of the thalamus (PVT). Surprisingly, neither the visual cortex nor superior colliculus is involved in contagious itch. In vivo calcium imaging and extracellular recordings reveal contagious itch-specific neural dynamics of GRPR neurons. Thus, we propose that the retina-ipRGC-SCN-PVT pathway constitutes a previously unknown visual pathway that probably evolved for motion vision that encodes salient environmental cues and enables animals to imitate behaviors of conspecifics as an anticipatory mechanism to cope with adverse conditions.

Keywords: CP: Neuroscience; GRP; GRPR; PACAP; SCN; contagious itch behavior; ipRGCs; itch stimuli; neural dynamics; scratching motion; stress.


Conflict of interest statement

Declaration of interests The authors declare no competing interests.

Figures

Figure 1.
Figure 1.. ipRGCs are required for CIB
(A) Schedule and schematic illustrating chemogenetic inhibition of ipRGCs by intravitreal injection of AAV-hSyn-DIO-h4MD(Gi)-mCherry in Opn4Cre mice. (B) IHC image showing Gi-mCherry expression in the retina of Opn4Cre mice. Scale bar, 20 μm. n = 3. (C) Cartoon illustrating the CIB paradigm. (D and E) Mean number of look (D) (t = 0.3064, df = 18, p = 0.7628) and imitative scratches (E) (t = 2.519, df = 18, p = 0.0214) of mCherry control and Gi-mCherry mice. n = 10/group. (F) GRP expression in the SCN of Opn4Cre mice in mCherry control group and Gi-mCherry group after the CIB test. Scale bar, 100 μm. (G) Quantification of GRP expression in (F), t = 4.639, df = 10, p = 0.0009, n = 6/group. (H) Schedule of chemogenetic inhibition of SCN projecting-ipRGCs for the CIB test. (I) Schematic illustration of two-step virus injection in H: 1st virus RetroAAV-Ef1a-mCherry-IRES-Cre was injected in the SCN of C57BL/6J mice. Three weeks later, the 2nd virus AAV-hSyn-DIO-HA-hM4D(Gi)-IRES-mCitrine was intravitreally injected. (J) mCherry-Cre (red) expression in the SCN after virus injection. Scale bar, 100 μm. (K) IHC image showing melanpsin (magenta), Gi-mCitrine (green), DAPI (blue) in the retina. Scale bar, 100 μm. (L and M) Mean number of look (L) (t = 0.6355, df = 11, p = 0.5381), mean number of imitative scratches (M) (t = 2.349, df = 11, p = 0.0386) of mice with eYFP control (n = 7) or Gi-mCitrine (n = 6). (N and O) Mean number of look (N) (t = 0.1599, df = 17, p = 0.8748); mean number of imitative scratch (O) (t = 0.3509, df = 17, p = 0.7300) of Opn4 KO (n = 11) and WT littermates (n = 8). Data are presented as mean ± SEM. Unpaired t test in (D, E, G, and L–O). ns, not significant. *p < 0.05, **p < 0.01, ***p < 0.001.
Figure 2.
Figure 2.. Optic activation of ipRGCs terminal in the SCN, but not dLGN or SC, evoked scratching behavior
(A and B) Schedule and schematic illustration of intravitreal injection of AAV-Syn-DIO-ChR2-eYFP and unilateral optic fiber implantation into the SCN of Opn4Cre mice. (C) Overlapping expression of ChR2 eYFP (green) and GRP (red) in the SCN of Opn4Cre mice. The terminal of ipRGCs labled by ChR2-eYFP broadly innervate the ventral side of the SCN. Scale bars, 100 μm (bottom left) and 20 μm (bottom right). n = 3. (D) Mean number of scratches induced by photostimulation (473 nm for 2 min at 1, 5, or 10 Hz) in eYFP control, ChR2 and ChR2 BB-Sap mice. n = 5~6 for each group (F(6, 30) = 2 .906, p < 0.0001). (E) Representative raster plots of scratching behaviors induced by photo-stimulation (473 nm for 2 min at 5 Hz) of eYFP control, ChR2 and ChR2 BB-sap mice. (F) Schematic illustration of intravitreal injection of AAV-Syn-DIO-ChR2-eYFP and unilateral fiber-optic implantation into dLGN of Opn4Cre mice. (G) dLGN projecting terminals of ipRGCs labeled by ChR2-eYFP after intravitreal injection. (H) Mean number of scratches induced by photostimulation (473 nm for 2 min at 5, 10, 20, or 30 Hz) in eYFP control and ChR2 mice (F(4, 20) = 0.2870, p = 0.7387). n = 5 for each group. (I) Schematic illustration of intravitreal injection of AAV-Syn-DIO-ChR2-eYFP and unilateral optic fiber implantation into the SC of Opn4Cre mice. (J) SC-projecting ipRGC terminals labeled by ChR2-eYFP after intravitreal injection. (K) Mean number of scratches induced by photostimulation (473 nm for 2 min at 5, 10, 20, or 30 Hz) in eYFP control and ChR2 mice (F(4, 20) = 0.2743, p = 0.9976). n = 5 for each group. One-way ANOVA with Tukey’s multiple comparisons test (D, H, and K). *p < 0.05, **p < 0.01, ***p < 0.001; ns, not significant.
Figure 3.
Figure 3.. Visual cortex and superior colliculus are not required for contagious itch
(A) Coronal section of the brain stained with DAPI (blue) showing visual cortex lesion (left) and corresponding anatomical location (right). Scale bar, 500 μm. (B and C) Mean number of look (B) (t = 1.986, df = 14, p = 0.0670) and imitative scratch behaviors (C) (t = 0.1895, df = 14, p = 0.8524) of mice with visual sham surgery and visual cortex lesion. (D) Cartoon illustrating the visual cliff test. (E) Left: mice with sham surgery spent significantly shorter time on the cliff side than the shallow side, indicating a normal depth perception. Right: mice with visual cortex lesion spent a comparable amount of time on either side, indicating a loss of depth perception. F(1, 14) = 31.94, p < 0.0001. (F) Coronal section of the brain (blue, DAPI) showing SC lesion (left) and corresponding anatomical location. SC, superior colliculus. PAG, periaqueductal gray. Scale bar, 500 μm. (G and H) Mean number of look (G) (t = 2.752, df = 12, p = 0.0175) and imitative scratch behaviors (H) (t = 0.1516, df = 12, p = 0.8820) of mice with SC lesion. (I) Cartoon illustrating the sweeping test. (J) SC lesion significantly reduces freezing behavior during sweeping test relative to the control (t = 2.818, df = 12, p = 0.0155). n = 8 mice/group for V1 lesion, n = 7 mice/group for SC lesion. Data are presented as mean ± SEM. Unpaired t test in (B, C, G, H, and J). Two-way ANOVA in (E). ns, not significant. *p < 0.05, ***p < 0.001.
Figure 4.
Figure 4.. ipRGCs activate GRP neurons through PACAP
(A) Schematic of intravitreal injection of AAV-EF1α-DIO-eYFP virus in Adcyap1Cre mice. (B) Overlapping expression of eYFP (green) and GRP (red) in the SCN of Adcyap1Cre mice. Scale bars, 100 μm (top) and 20 μm (bottom right). n = 3. (C) Representative RNAscope image showing the overlapping and non-overlapping of Adcyap1r1 and Grp in the SCN. Scale bar, 10 μm. (D) Venn diagram showing that 70.72% ± 7.78% of Grp cells express Adcyap1r1. n = 3. (E) Schematic of brain slice recording of SCN GrptdTom neurons obtained from GrpCre/tdTom mice (left); a representative image showing GrptdTom neurons in the SCN of GrpCre/tdTom mice (right). Scale bar, 100 μm. (F) A representative trace showing that PACAP (10 mM) enhanced glutamate-evoked current in GrptdTom neurons. (G) The mean current induced by glutamate with or without PACAP pretreatment (9 of 16 Grp cells showed enhanced glutamate current, n = 4 mice). t = 2.809, df = 8, p = 0.0229. (H) Schematic of intravitreal injection of AAV-hSyn-Cre-IRES-eGFP or the control eYFP virus in Adcyap1f/f mice (Adcyap1f/f/Cre or Adcyap1f/f control mice). (I) Comparison of Adcyap1 mRNA expression in the retina of Adcyap1f/f/Cre or control mice (t = 10.81, df = 8, p < 0.0001), n = 5. (J and K) Mean number of look (J) (t = 0.7213, df = 20, p = 0.4791) and imitative scratch behaviors (K) (t = 3.719, df = 20, p = 0.0014) of Adcyap1f/f/Cre (n = 11) or Adcyap1f/f control (n = 11) mice. Data are presented as mean ± SEM. Unpaired t test in (G and I–K). ns, not significant. *p < 0.05, **p < 0.01, ***p < 0.001.
Figure 5.
Figure 5.. PACAP mediated CIB through the PAC1 receptor in SCN GRP neurons
(A) Schedule of ablation of PAC1 neurons by PACAP-saporin (PACAP-sap) injection into the SCN. (B) RNAscope ISH images showing the expression of Adcyap1r1 (red) in the SCN of mice with control-sap and PACAP-sap. Scale bar, 100 μm. (C) Mean expression of Adcyap1r1 mRNA (t = 6.330, df = 4, p = 0.0032) in the SCN after Control-sap and PACAP-sap treatment. n = 3. (D and E) Mean number of look (D) (t = 0.2181, df = 12, p = 0.4155) and imitative scratch behaviors (E) (t = 5.923, df = 12, p < 0.0001) of mice with control-sap (n = 7) and PACAP-sap (n = 7). (F) Schematic illustration of bilateral injection of Adcyapr1r1 siRNA in SCN. (G) Representative RNAscope image showing reduced expression of Adcyapr1r1 in the SCN after Adcyapr1r1 siRNA injection compared with the Control siRNA group. Scale bar, 100 μm. (H) Mean expression of Adcyap1r1 mRNA (t = 9.342, df = 8, p < 0.001) in the SCN after Control siRNA and Adcyapr1r1 siRNA treatment. n = 5. (I and J) Mean number of look (I) (t = 0.4100, df = 18, p = 0.6866) mean number of imitative scratch (J) (t = 3.986, df = 18, p = 0.0009) of Control siRNA (n = 9) or Adcyapr1r1 siRNA (n = 11) treated mice. Data are presented as mean ± SEM. Unpaired t test in (C–E and H–J). ns, not significant; *p < 0.05, **p < 0.01, ***p < 0.001.
Figure 6.
Figure 6.. In vivo Ca2+ imaging of the responses of GRPR neurons to scratching motion
(A) Schedule of in vivo Ca2+ imaging during the CIB test. (B) Unilateral injection of AAVDJ-EF1α-DIO-GCaMP6s and implantation of GRIN lens into the left SCN of GrpriCre mice. GRIN lens (500 μm diameter) was positioned above GCaMP6s-expressing SCN (~300 μm diameter; 6 mm depth). (C) Representative image showing the GCaMP6s virus expression in SCN and the lens track. (D) A GrpriCre mouse with a head-mounted miniscope in a cylinder watches a mouse scratching video. (E) Schematized cell map of dynamic GRPR cells in the whole field view (upper two panels); independent component analysis derived GRPR neuron activity traces (bottom panel). (F) Cartoon illustrating an observer mouse looking at an ambulating mouse demonstrator (control, upper panel). Heatmap of normalized Ca2+ activation patterns from all individual GRPR cells recorded corresponding to the control look behavior (without any other associated behavior) toward the control demonstrator (lower panel). 0 s time point indicates the onset of look. (G) Cartoon illustrating an observer looking at a scratching demonstrator without ensuing scratching behavior (look-without-scratch, upper panel). Heatmap of normalized Ca2+ activation patterns from all individual GRPR neurons recorded corresponding to the look-without-scratch behavior toward a scratching demonstrator (lower panel). (H) Cartoon illustrating an observer mouse displays an imitative scratch behavior (upper panel). Heatmap of normalized Ca2+ activity of individual GRPR cells corresponding to the look of imitative scratch in CIB during watching the scratching demonstrator. Imitative scratch behavior is defined as it occurring within 5 s following the look behavior. (I–K) Classification of GRPR cells according to the response to the control look (I), the look-without-scratch (J), and imitative scratches (look-and-scratch) (K). (L) Percentage of GRPR cells showing activated Ca2+ response corresponding to the control look, look-without-scratch and imitative scratch. (M) Mean Ca2+ traces of neurons with activated Ca2+ response corresponding to control look (16 neurons), look-without-scratch (34 neurons), and imitative scratch (45 neurons) (F = 20.81, p < 0.0001). A total of 161 neurons were recorded from 8 mice. Contingency chi-square test in (L). One-way ANOVA test in (M) for the area under the curve. *p < 0.05, **p < 0.01, ***p < 0.001.
Figure 7.
Figure 7.. In vivo multichannel extracellular recording of the response of GRPR neurons to scratching motion
(A) Experimental procedure of in vivo multichannel extracellular recording of SCN GRPR neurons of GrpriCre; Ai32 mice during the CIB test. (B) Cartoon showing the electrophysiological recording of SCN GRPR neurons. Note that the GrpriCre; Ai32 mouse with a self-made optrode with a 3D-printed protective hat, which was wrapped with copper tape and connected to the system ground to gain extra protection against electrical noise. (C) Photos showing the head of the GrpriCre; Ai32 mouse with the hat and an optrode, consisting of eight tetrodes and optical fiber with a microdrive (top right) that enables the D-V directional movement of the optrode in the brain and a cartoon showing the optrode implanted into the SCN of the GrpriCre; Ai32 mouse brain (bottom right). (D) Left: schematic of optrode implantation in the left side of the SCN. The optical fiber was connected to a 473 nm blue laser for the identification of ChR2-tagging GRPR neurons. Right: a representative image showing the histology of optical fiber (white arrow) and electrodes (red arrows) in the left side of the SCN. (E) Waveform (top) and auto-correlogram (bottom) of one well-isolated neuron from the SCN of GrpriCre; Ai32 mouse. A total of well-isolated 159 SCN neurons were sorted out from 7 GrpriCre: Ai32 mice. (F) Optogenetic identification of GRPR neurons. Spike raster (top) and peri-stimulus time histogram (PSTH) (bottom) for an identified GRPR neuron aligned to the onset of blue light pulse (top, blue line, 473 nm, duration, 1 ms; power, 1 to 4 mW; frequency, 20 Hz). (G) Histogram of stimulus-associated spike latency test (SALT) for optical tagging showing p value distribution (p < 0.01, blue). A total of 88 neurons were identified as GRPR neurons. (H) Distribution of 88 GRPR neurons according to their baseline firing rates. (I–K) Classification of 88 GRPR neurons based on their excitatory, inhibitory and no responses under three behavioral conditions: the control look (I), look-without-scratch (J), and imitative scratch (K). (L) Comparison of the percentage of GRPR neurons that were activated under three behavioral conditions. Chi-square test in (L), ***p < 0.001.

Similar articles

Cited by

References

    1. Abrahamson EE, and Moore RY (2001). Suprachiasmatic nucleus in the mouse: retinal innervation, intrinsic organization and efferent projections. Brain Res. 916, 172–191. - PubMed
    1. Ali F, and Kwan AC (2020). Interpreting in vivo calcium signals from neuronal cell bodies, axons, and dendrites: a review. Neurophotonics 7, 011402. - PMC - PubMed
    1. Barry DM, Liu XT, Liu B, Liu XY, Gao F, Zeng X, Liu J, Yang Q, Wilhelm S, Yin J, et al. (2020). Exploration of sensory and spinal neurons expressing gastrin-releasing peptide in itch and pain related behaviors. Nat. Commun. 11, 1397. - PMC - PubMed
    1. Barson JR, Mack NR, and Gao WJ (2020). The paraventricular nucleus of the thalamus is an important node in the emotional processing network. Front. Behav. Neurosci. 14, 598469. - PMC - PubMed
    1. Baver SB, Pickard GE, Sollars PJ, and Pickard GE (2008). Two types of melanopsin retinal ganglion cell differentially innervate the hypothalamic suprachiasmatic nucleus and the olivary pretectal nucleus. Eur. J. Neurosci. 27, 1763–1770. - PubMed

Publication types

MeSH terms

Substances