

MagicalRsq: Machine-learning-based genotype imputation quality calibration
- PMID: 36198314
- PMCID: PMC9674945
- DOI: 10.1016/j.ajhg.2022.09.009
MagicalRsq: Machine-learning-based genotype imputation quality calibration
Abstract
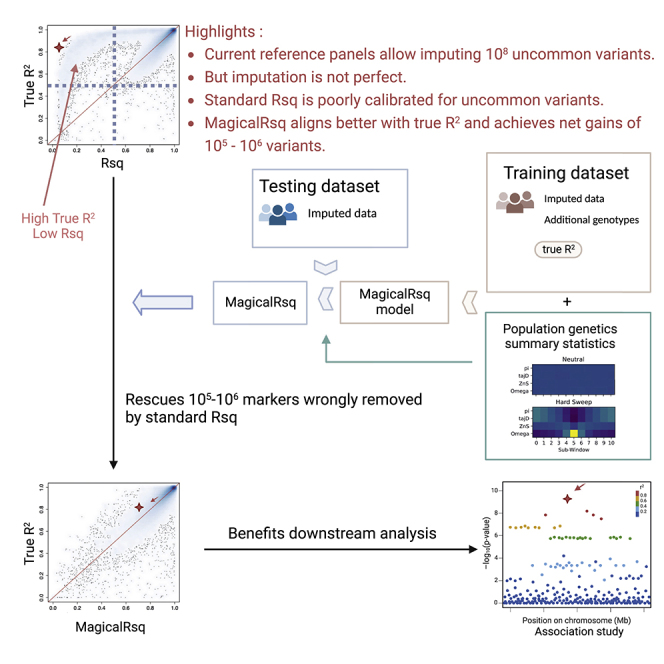
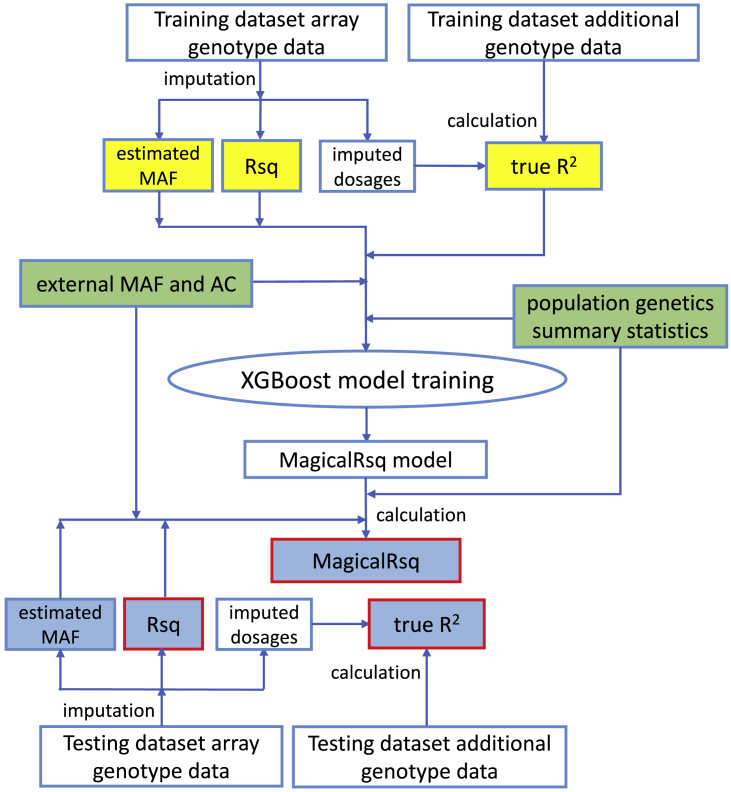
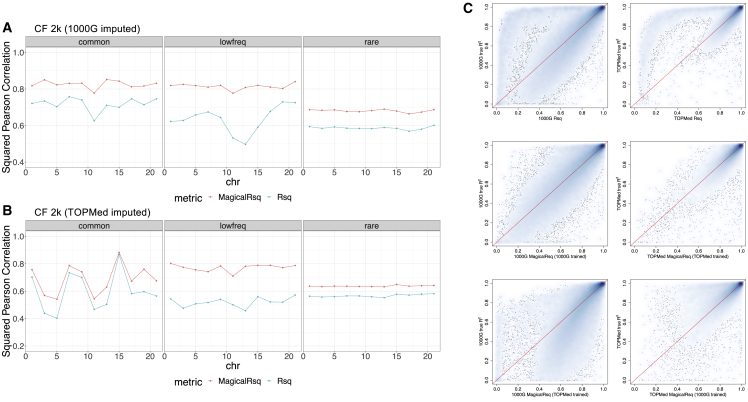
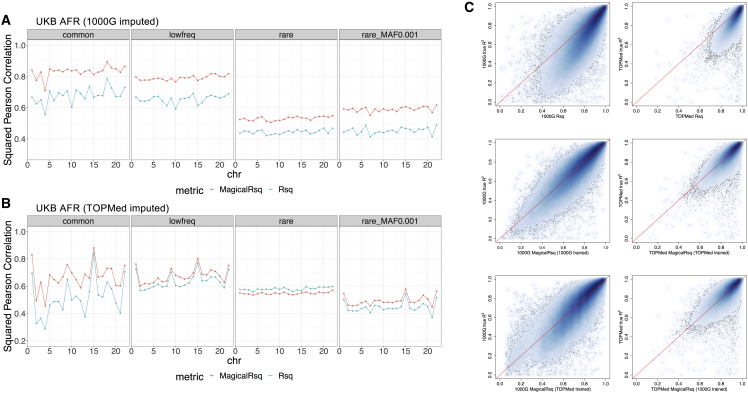
Whole-genome sequencing (WGS) is the gold standard for fully characterizing genetic variation but is still prohibitively expensive for large samples. To reduce costs, many studies sequence only a subset of individuals or genomic regions, and genotype imputation is used to infer genotypes for the remaining individuals or regions without sequencing data. However, not all variants can be well imputed, and the current state-of-the-art imputation quality metric, denoted as standard Rsq, is poorly calibrated for lower-frequency variants. Here, we propose MagicalRsq, a machine-learning-based method that integrates variant-level imputation and population genetics statistics, to provide a better calibrated imputation quality metric. Leveraging WGS data from the Cystic Fibrosis Genome Project (CFGP), and whole-exome sequence data from UK BioBank (UKB), we performed comprehensive experiments to evaluate the performance of MagicalRsq compared to standard Rsq for partially sequenced studies. We found that MagicalRsq aligns better with true R2 than standard Rsq in almost every situation evaluated, for both European and African ancestry samples. For example, when applying models trained from 1,992 CFGP sequenced samples to an independent 3,103 samples with no sequencing but TOPMed imputation from array genotypes, MagicalRsq, compared to standard Rsq, achieved net gains of 1.4 million rare, 117k low-frequency, and 18k common variants, where net gains were gained numbers of correctly distinguished variants by MagicalRsq over standard Rsq. MagicalRsq can serve as an improved post-imputation quality metric and will benefit downstream analysis by better distinguishing well-imputed variants from those poorly imputed. MagicalRsq is freely available on GitHub.
Keywords: XGBoost; genotype imputation; imputation quality; machine learning; post-imputation quality control.
Copyright © 2022 The Authors. Published by Elsevier Inc. All rights reserved.
Conflict of interest statement
Declaration of interests The authors declare no competing interests.
Figures
References
-
- Sun Q., Liu W., Rosen J.D., Huang L., Pace R.G., Dang H., Gallins P.J., Blue E.E., Ling H., Corvol H., et al. Leveraging TOPMed imputation server and constructing a cohort-specific imputation reference panel to enhance genotype imputation among cystic fibrosis patients. HGG Adv. 2022;3:100090. - PMC - PubMed
-
- Kowalski M.H., Qian H., Hou Z., Rosen J.D., Tapia A.L., Shan Y., Jain D., Argos M., Arnett D.K., Avery C., et al. Use of >100, 000 NHLBI Trans-Omics for Precision Medicine (TOPMed) Consortium whole genome sequences improves imputation quality and detection of rare variant associations in admixed African and Hispanic/Latino populations. PLoS Genet. 2019;15:e1008500. - PMC - PubMed
-
- Sun Q., Graff M., Rowland B., Wen J., Huang L., Miller-Fleming T.W., Haessler J., Preuss M.H., Chai J.-F., Lee M.P., et al. Analyses of biomarker traits in diverse UK biobank participants identify associations missed by European-centric analysis strategies. J. Hum. Genet. 2022;67:87–93. - PMC - PubMed
Publication types
MeSH terms
Grants and funding
- R01 HL120393/HL/NHLBI NIH HHS/United States
- U01 HL120393/HL/NHLBI NIH HHS/United States
- R01 HG009976/HG/NHGRI NIH HHS/United States
- MC_PC_17228/MRC_/Medical Research Council/United Kingdom
- R01 HL117626/HL/NHLBI NIH HHS/United States
- T32 ES007018/ES/NIEHS NIH HHS/United States
- R35 GM138286/GM/NIGMS NIH HHS/United States
- MC_QA137853/MRC_/Medical Research Council/United Kingdom
- T32 HL129982/HL/NHLBI NIH HHS/United States
- R01 MH123724/MH/NIMH NIH HHS/United States
- HHSN268201800001C/HL/NHLBI NIH HHS/United States
- U01 HG011720/HG/NHGRI NIH HHS/United States
- U24 AR076730/AR/NIAMS NIH HHS/United States
- R01 HL146500/HL/NHLBI NIH HHS/United States
- KL2 TR002490/TR/NCATS NIH HHS/United States
LinkOut - more resources
Full Text Sources
Medical
