. 2022 Oct 13;185(21):3913-3930.e19.
doi: 10.1016/j.cell.2022.09.002. Epub 2022 Oct 4.

X-linked ubiquitin-specific peptidase 11 increases tauopathy vulnerability in women

Affiliations

X-linked ubiquitin-specific peptidase 11 increases tauopathy vulnerability in women

Yan Yan et al. Cell. .

Abstract

Although women experience significantly higher tau burden and increased risk for Alzheimer's disease (AD) than men, the underlying mechanism for this vulnerability has not been explained. Here, we demonstrate through in vitro and in vivo models, as well as human AD brain tissue, that X-linked ubiquitin specific peptidase 11 (USP11) augments pathological tau aggregation via tau deubiquitination initiated at lysine-281. Removal of ubiquitin provides access for enzymatic tau acetylation at lysines 281 and 274. USP11 escapes complete X-inactivation, and female mice and people both exhibit higher USP11 levels than males. Genetic elimination of usp11 in a tauopathy mouse model preferentially protects females from acetylated tau accumulation, tau pathology, and cognitive impairment. USP11 levels also strongly associate positively with tau pathology in females but not males. Thus, inhibiting USP11-mediated tau deubiquitination may provide an effective therapeutic opportunity to protect women from increased vulnerability to AD and other tauopathies.

Keywords: Alzheimer’s; DUB; USP11; X-inactivation; acetylation; long-term potentiation; spatial memory; synaptic plasticity; tauopathy; ubiquitin.


Conflict of interest statement

Declaration of interests The authors declare no competing interests.

Figures

Figure 1
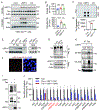
Figure 1. Deubiquitinase USP11 stabilizes tau
(A,B) Representative blots of proteins from HELA-V5-tau cells transfected with control or USP11 siRNA. Graph shows quantification of tau (2-tailed t-test, t=6.138, df=4, **P=0.0036, n=3 samples/condition). (C,D) Representative blots of proteins from iHEK-tauP301L cells transfected with control or USP11 siRNA. Graph shows quantification of tau (2-tailed t-test, t=4.271, df=4, *P=0.0129, n=3 samples/condition). (E,F) Representative blots of proteins from DIV21 tauP301S cortical neurons transduced with control or USP11 shRNA. Graph shows quantification of tau (2-tailed t-test, t=12.24, df=6, ****P<0.0001, n=4 samples/condition). (G,H) Representative images of tau staining from DIV21 tauP301S hippocampal neurons transduced with control or USP11 shRNA. Graph shows quantification of tau (2-tailed t-test, t=12.85, df=46, ****P<0.0001, n=24 images/condition from 3 independent experiments). (I,J) Representative blots of proteins from HELA-V5-tau cells transfected with control or USP11 siRNA (CHX, 100μg/mL). Graph shows quantification of tau (2-way ANOVA condition x time: F(3,12)=9.413, P=0.0018; posthoc Sidak, ****P<0.0001, **P<0.01, *P<0.05, n=3 independent experiments). (K) Quantification of tau mRNA by qRT-PCR (2-tailed t-test, not significant, n=6 samples/condition).
Figure 2
Figure 2. USP11 catalytic activity mediates tau aggregation and deubiquitination
(A,B) Representative blots of RIPA-soluble and insoluble proteins from iHEK-tauP301L cells transfected with control vector, USP11, or USP11C318S mutant (CS). Graphs show quantification of soluble and insoluble tau (1-way ANOVA; soluble tau=not significant; insoluble tau: 1-way ANOVA, F(2,16)=22.52, P<0.0001; posthoc Tukey: **P=0.0030, ****P<0.0001, n=6-7 samples/condition from 2 independent experiments). (C,D) Filter trap blots of aggregated tau from RIPA-soluble and insoluble fractions of HELA-V5-tau cells transfected with control vector, USP11, or USP11C318S. Graph shows quantification of insoluble tau aggregates (1-way ANOVA, F(2,9)=3561, P<0.0001; posthoc Tukey: ****P<0.0001, n=4 samples/condition). (E) Representative blots of USP11 and tau in tau complexes (IP: tau) or control immune complex (IgG) in iHEK-tauP301L cells transfected with control vector, USP11, or USP11C318S. (F) Representative images of endogenous USP11 complex with tau in HELA-V5-tau cells (red dots) by in situ Duolink® PLA. (G) Representative blots of polyubiquitin conjugates and tau in tau-pulldown samples (IP: tau) from iHEK-tauP301L cells transfected with HA-ubiquitin plus control vector, USP11, or USP11C318S. Western blots of input lysates are shown below. (H) Representative blots of ubiquitin-K63 or ubiquitin-K48 conjugates and tau in tau-pulldown samples (IP: tau) from iHEK-tauP301L cells treated with vehicle or 10μM MG132 for 6h, after which tau-pulldowns were treated ± recombinant USP11 (1.5μg) for 2h. *Asterisk indicates recombinant USP11 protein added to the tau-pulldown. (I) Representative blots showing deubiquitination of CHIP-ubiquitinated recombinant tau by recombinant USP11. (J) Quantification of diGly-ub signatures remaining on tau lysines after deubiquitination of CHIP-ubiquitinated tau with recombinant USP11 (2h and 24h) by tryptic digest and LC-MS/MS (n=3 samples/condition).
Figure 3
Figure 3. USP11 recapitulates the tau acetylation mimic K281Q and enables tau acetylation at K281/K274 by CBP/p300 or SIRT1 inhibition
(A) Representative blots of RIPA-soluble and insoluble proteins from HEK293T cells co-transfected with tau variants and vector control or USP11. (B) Quantification of the insoluble/soluble tau (1-way ANOVA, F(3,13)=11.54, P=0.0006, posthoc Dunnett, *P=0.0432, ***P=0.0009, ns=not significant, n=4-5 independent experiments). (C) Quantification of paired fold changes insoluble/soluble tau (paired t-test; tau-WT: **P=0.0013; tauK274Q, tauK280Q, ortauK281Q variants: not significant; n=4-5 independent replicates per tau variant). (D) Representative blots of polyubiquitinated tau and tau in tau pulldowns (IP: tau) from HEK293T cells co-transfected with tau variants and vector control or USP11. (E) Quantification of polyubiquitinated tau/total tau (1-way ANOVA, F(3,20)=5.412, P=0.0068; posthoc Tukey: *P<0.05, n=6 independent experiments). (F) Quantification of paired fold changes per experiment in polyubiquitinated tau/total tau (paired t-test; tau-WT: ***P=0.0003; tauK274Q: *P=0.016; tauK280Q: *P=0.0282; tauK281Q: not significant; n=6 independent experiments). (G) Representative blots of RIPA-soluble proteins from iHEK-TauWT cells co-transfected with vector control or p300-HA and control or USP11 siRNA. (H,I) Quantification of Ac281-tau and Ac274-tau (1-way ANOVA, Ac281-tau: F(3,16)=8.893, P=0.001; Ac274-tau: F(3,16)=26.32, P<0.0001; posthoc Tukey: *P<0.05, ***P<0.001, ****P<0.0001; n=5 samples/condition). (J) Representative blots of RIPA-soluble proteins from iHEK-TauWT cells transfected with control siRNA or USP11 siRNA for 48h ± SIRT1 inhibitor EX527 treatment (50μM, 6h) prior to lysis. (K,L) Quantification of Ac281-tau and Ac274-tau (1-way ANOVA, Ac281-tau: F(3,12)=26.35, P<0.0001; Ac274-tau: F(3,12)=21.79, P<0.0001; posthoc Tukey: *P<0.05, ***P<0.001, ****P<0.0001; n=4 samples/condition).
Figure 4
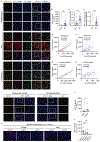
Figure 4. Accumulation of USP11 in human tauopathies, strong association of USP11 with tauopathy in women, and higher USP11 expression in disease-free females
(A) Representative images of USP11 and p-S202/T205-tau (AT8 antibody) in the frontal gyrus (FG) of 3 nondementia controls, 3 AD, and 3 FTLD-tau cases. White boxes are magnified to the right. (B) Quantification of USP11 intensity in nondementia controls and AD (2-tailed t-test, ****p<0.0001, t=5.403, df=130; n=49 images from 4-5 images/case, 2-3 sections/case, and 10 control cases; n=83 images from 4-5 images/case, 2-3 sections/case, and 17 AD cases. (C) Quantification of cytoplasmic/nuclear USP11 ratio in nondementia controls and in AD (2-tailed t-test, ****P<0.0001, t=8.489, df=132; n=50 images from 4-5 images/case, 2-3 section/case, and 10 control cases; n=84 images from 4-5 images/case, 2-3 sections/case, and 17 AD cases. (D) Image J quantification of Manders coefficient of USP11 area overlapping with AT8 area in nondementia controls and AD (2-tailed t-test, t=9.118, df= 141, ****P<0.0001; n=59 images from 4-5 image/case, 2-3 sections/case, and 10 control cases; n=84 images from 4-5 images/case, 2-3 sections/case, and 17 AD cases. (E-H) Correlation between USP11 and p-tau (AT8) intensities in (E) female AD: linear regression test, r2=0.5759, P<0.0001; multiple linear regression AT8 x USP11 main effect adjusted for Thal amyloid score, age at death, and APOE genotypes, adjusted r2=0.5733, F(4,28)=11.75, P<0.0001; n=33 images from 4-5 images/case, 2-3 sections/case, and 7 cases; (F) male AD: linear regression test, r2=0.01183, P=0.0145; multiple linear regression AT8 x USP11 main effect adjusted for Thal amyloid score, age at death, and APOE genotypes, adjusted r2=0.2412, F(4,45)=4.895, P=0.0023; n=50 images from 5 images/case, 2-3 sections/case, and 10 cases; (G) female FTLD-tau: linear regression test, r2=0.8776, P=0.0002, n=9 images from 4-5 images/case, and 2 cases; and (H) male FTLD-tau: linear regression test, r2=0.1944, P=0.0352, n=23 images from 4-5 images/case, 2-3 sections/case, and 5 cases. (I) Representative images of USP11 (red) and DAPI (blue) staining in the frontal gyrus (FG) of 3 female and 3 male nondementia controls. (J) Quantification of USP11 intensity in the FG of female and male nondementia subjects (2-tailed t-test, *P=0.0245, t=2.325, df=47; female: n=30 images from 4-5 images/case, 2-3 sections/case, and 6 control cases; male: n=19 images/case, 2-3 sections/case, and 4 control cases). (K) Representative images of USP11 (red) and DAPI (blue) in the cortex in 7-month-old mice. (L) Quantification of USP11 intensity in the frontal cortex 7-month-old mice (1-way ANOVA, F(4,189)=28.98, P<0.0001, posthoc Tukey: ****P<0.0001, **P<0.01, ns=not significant; n=39-42 images from 5-8 sections/mouse, and 4 mice/genotype/sex, F=female, M=male).
Figure 5
Figure 5. Loss of usp11 mitigates Ac-tau accumulation, tau pathology, and gliosis in female tauP301S mice
(A) Representative blots of RIPA-soluble and insoluble proteins in the cortex of 7-month-old female mice. (B,C) Quantification of soluble and insoluble tau and pS199/202-tau in the cortex of female mice. (B) Total tau (soluble): 2-tailed t-test, t=3.177, df=22, **P=0.0044; total tau (insoluble): 2-tailed t-test, t=9.186, df=22, ****P<0.0001, n=12 mice/genotype. (C) pS199/202-tau (soluble): 2-tailed t-test, not significant; pS199/202-tau (insoluble): 2-tailed t-test, t=3.647, df=14, **P=0.0026, n=8 mice/genotype. (D) Representative images of pS199/202-tau (green) and DAPI (blue) in the hippocampus CA1 and cortex of 7-month-old female mice. (E) Quantification of pS199/202-tau intensity in 7-month-old female mice (2-tailed t-test: t=15.02, df=59 (Hippo); t=16.57, df=70 (Cortex), ****P<0.0001, n=25-40 images from 5-8 sections/mouse and 4 mice/genotype). (F) Representative images of pS262-tau (red) and DAPI (blue) in the hippocampus and cortex of 7-month-old female mice. (G) Quantification of pS262-tau intensity in 7-month-old female mice (2-tailed t-test: t=4.564, df=98 (Hippo); t=4.908, df=98 (cortex), ****P<0.0001, n=50 images from 10 sections/mouse and 5 mice/genotype). (H) Representative images of GFAP (green), Iba1 (red), and DAPI (blue) in the hippocampus of 7-month-old female mice. (I) Quantification of GFAP or Iba1 intensity in female mice (GFAP: 1-way ANOVA, F(2,110)=26.62, P<0.0001, posthoc Tukey: ****P<0.0001, n=33-45 images from 5-8 sections/mouse and 5 mice/genotype; Iba1: 1-way ANOVA, F(2,95)=29.16, P<0.0001, posthoc Tukey: ***P<0.001, ****P<0.0001, n=29-36 images from 5-8 sections/mouse and 6 mice/genotype). (J) Blots of RIPA-soluble and insoluble USP11, ac-tau (Ac274 or Ac281), and actin from the cortex of 7-month-old mice. F=female, M=male. *Asterix indicates the same male mice lysates in Figure S6L used for normalization between gels. (K,L) Quantification of soluble and insoluble Ac-tau in female mice from Figure 5J (2-tailed t-test, *P<0.05, **P<0.01, ***P<0.001, ****P<0.0001, n=4 mice/genotype). (M-O) Quantification of soluble and insoluble Ac-tau and USP11 in female (F) and male (M) mice from Figures 5J and S6L (2-tailed t-test, *P<0.05, **P<0.01, ***P<0.001, ****P<0.0001, n=4 mice/sex).
Figure 6
Figure 6. Loss of usp11 rescues synaptic plasticity deficits in female tauP301S mice
(A) Schematic of electrophysiological recordings from ex vivo brain slices (Biorender.com). (B) Quantification of I/O curves from 5-month-old female mice (2-way ANOVA, not significant, n=31 slices from 5 WT, n=22 slices from 5 tauP301S, n=43 slices from 8 tauP301S;usp11+/−, n=14 slices from 3 tauP301S;usp11−/−). (C) Quantification of PPF from 5-month-old female mice (2-way ANOVA: F(3,2475)=44.28, P<0.0001; posthoc Tukey main genotype effects - WT vs tauP301S: P<0.0001; tauP301S vs tauP301S;usp11+/− mice: P<0.01; tauP301S vs tauP301S;usp11−/− mice: P<0.0001; n=40 slices from 5 WT, n=42 slices from 5 tauP301S, n=63 slices from 8 tauP301S;usp11+/−, n=24 slices from 3 tauP301S; usp11−/−). (D) Quantification of LTP after theta-burst stimulation from 5-month-old female mice (2-way ANOVA: F(3,12240)=823.3, P<0.0001; posthoc Tukey main genotype effects: ****P<0.0001; n=35 slices from 5 WT, n=37 slices from 5 tauP301S, n=62 slices from 8 tauP301;usp11+/−, n=23 slices from 3 tauP301S;usp11−/−). (E) Representative images of synaptophysin (red) and DAPI (blue) in the stratum radium (SR) of CA3 from 7-month-old female mice. (F) Quantification of synaptophysin intensity in the SR of CA3 (1-way ANOVA, F(2,115)=13.43, P<0.0001; posthoc Tukey: ****P<0.0001, ***P=0.0007, n=34-43 images from 5-8 sections/mouse and 6 mice/genotype).
Figure 7
Figure 7. Loss of usp11 reverses spatial memory impairment in female tauP301S mice
(A) Schematic of training and probe test in Morris water maze (MWM). (B) Quantification of time to find the hidden platform during the training phase in female mice (RM 1-way ANOVA: genotype F(3,12)=7.742, P=0.0039; posthoc Tukey: **P<0.01 WT vs. tauP301S, ns=not significant WT vs. tauP301S;usp11+/− or tauP301S;usp11−/−; n=17 WT, n=16 tauP301S, n=17 tauP301S;usp11+/−, n=12 tauP301S;usp11−/−). (C) Quantification of time to target zone (sec) and swim speed (m/s for 1 min) during the probe test on day 6 with the hidden platform removed (1-way ANOVA genotype effect for time to target: F(3,58)=8.202, P=0.0001; genotype effect for swim speed: F(3,58)=2.131, P=0.1061, posthoc Dunnett: ***P<0.001; ns=not significant; n=17 WT, n=16 tauP301S, n=17 tauP301S;usp11+/−, n=12 tauP301S;usp11−/−).

Comment in

References

    1. Adamec E, Vonsattel JP, and Nixon RA (1999). DNA strand breaks in Alzheimer’s disease. Brain research 849, 67–77. 10.1016/s0006-8993(99)02004-1. - DOI - PubMed
    1. Alquezar C, Arya S, and Kao AW (2020). Tau Post-translational Modifications: Dynamic Transformers of Tau Function, Degradation, and Aggregation. Front Neurol 11, 595532. 10.3389/fneur.2020.595532. - DOI - PMC - PubMed
    1. Altmann A, Tian L, Henderson VW, and Greicius MD (2014). Sex modifies the APOE-related risk of developing Alzheimer disease. Ann Neurol 75, 563–573. 10.1002/ana.24135. - DOI - PMC - PubMed
    1. Arakhamia T, Lee CE, Carlomagno Y, Duong DM, Kundinger SR, Wang K, Williams D, DeTure M, Dickson DW, Cook CN, et al. (2020). Posttranslational Modifications Mediate the Structural Diversity of Tauopathy Strains. Cell 180, 633–644 e612. 10.1016/j.cell.2020.01.027. - DOI - PMC - PubMed
    1. Augustinack JC, Schneider A, Mandelkow EM, and Hyman BT (2002). Specific tau phosphorylation sites correlate with severity of neuronal cytopathology in Alzheimer’s disease. Acta Neuropathol 103, 26–35. 10.1007/s004010100423. - DOI - PubMed

Publication types