. 2022 Oct 13;185(21):3992-4007.e16.
doi: 10.1016/j.cell.2022.09.018. Epub 2022 Sep 14.

Virological characteristics of the SARS-CoV-2 Omicron BA.2 subvariants, including BA.4 and BA.5

Affiliations

Virological characteristics of the SARS-CoV-2 Omicron BA.2 subvariants, including BA.4 and BA.5

Izumi Kimura et al. Cell. .

Abstract

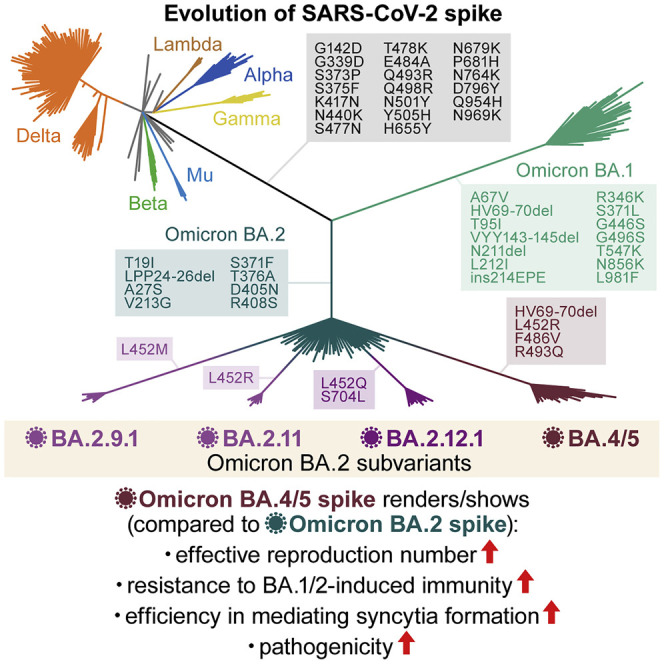
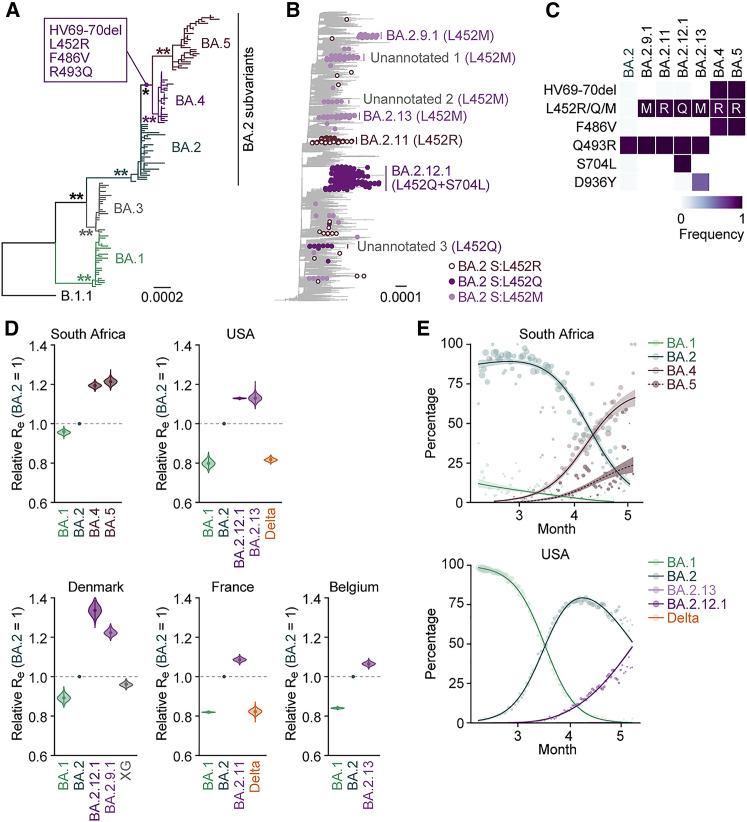
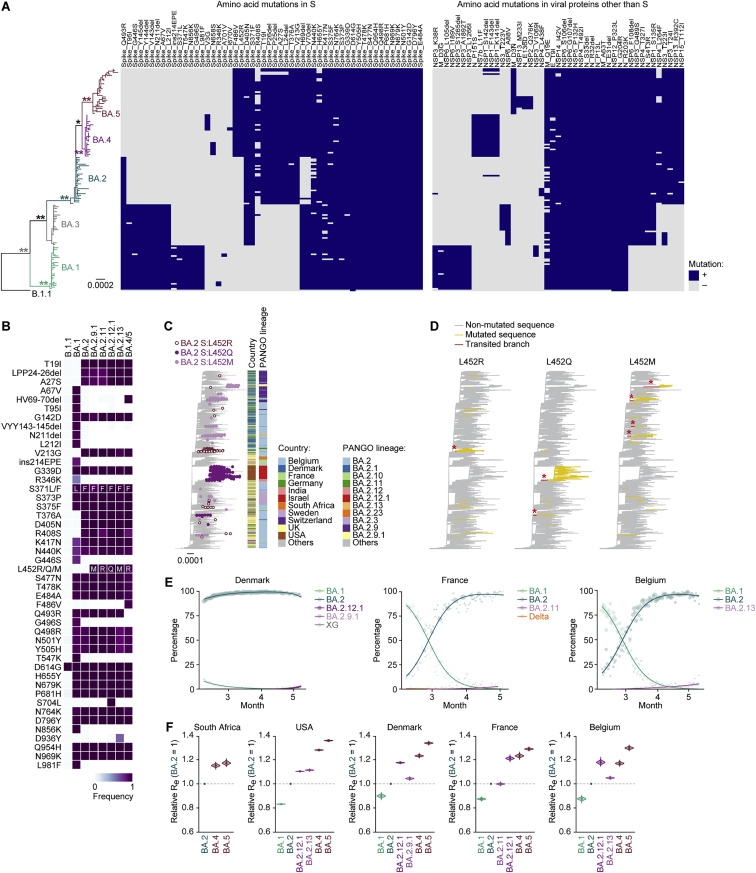
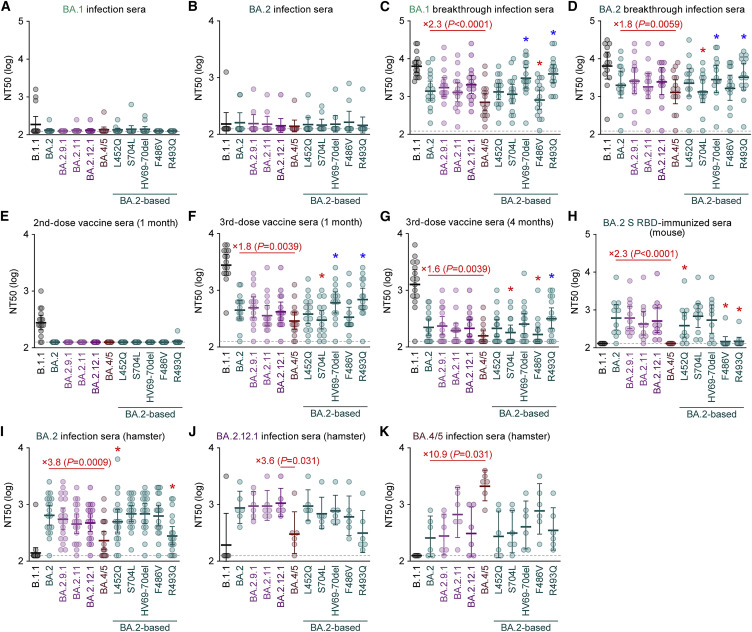
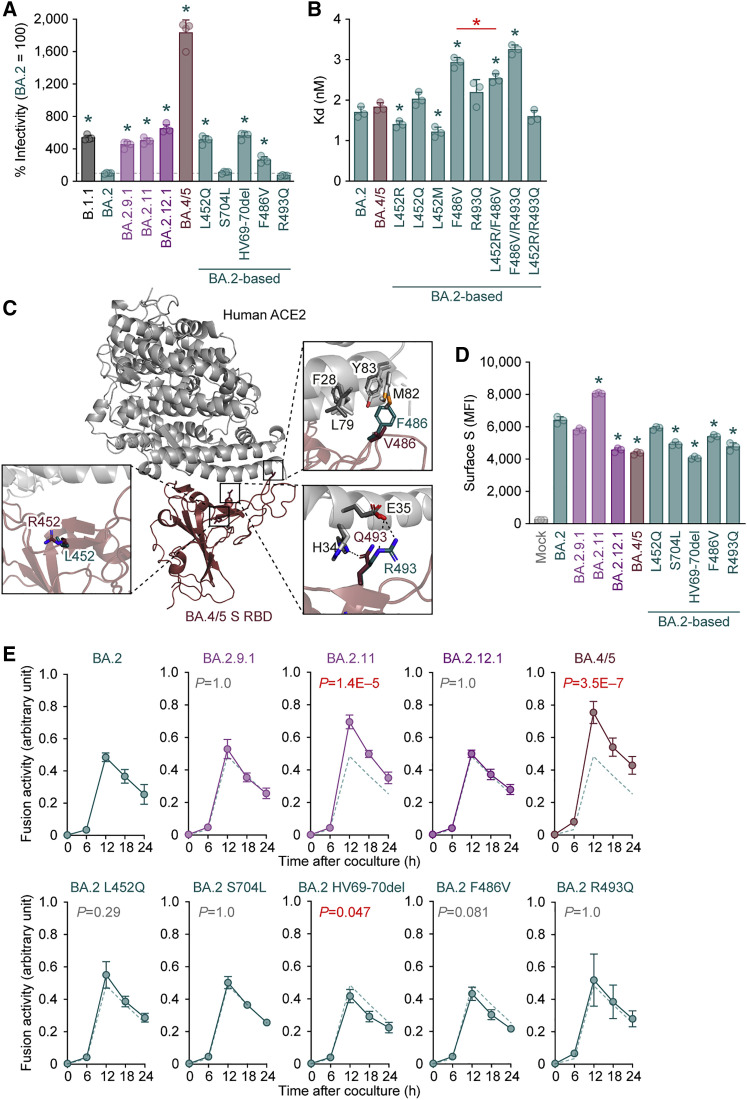
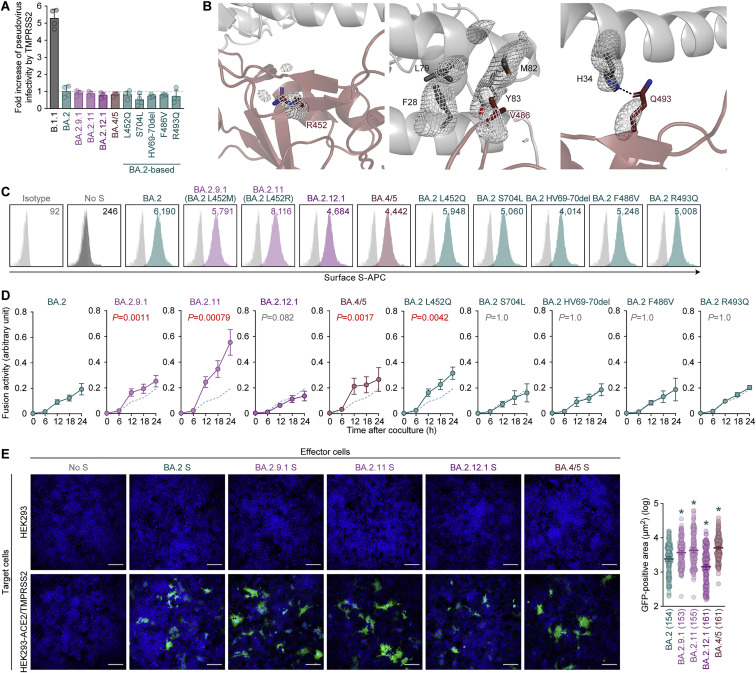
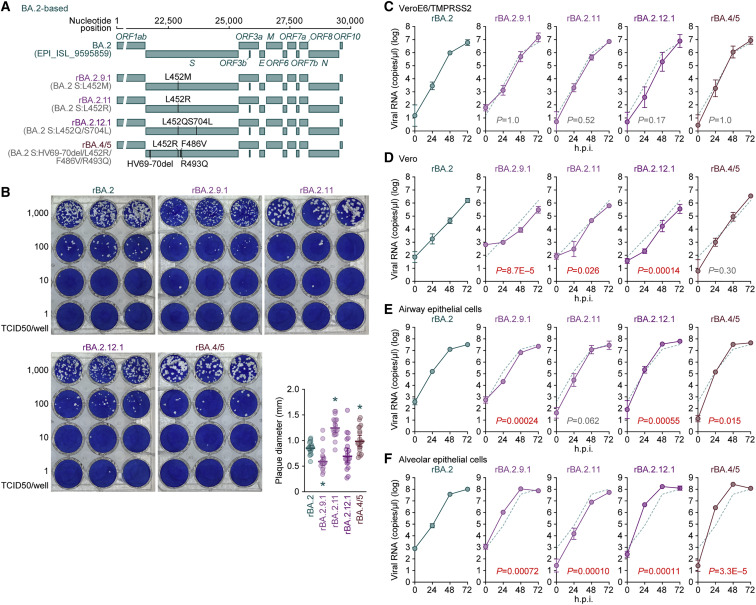
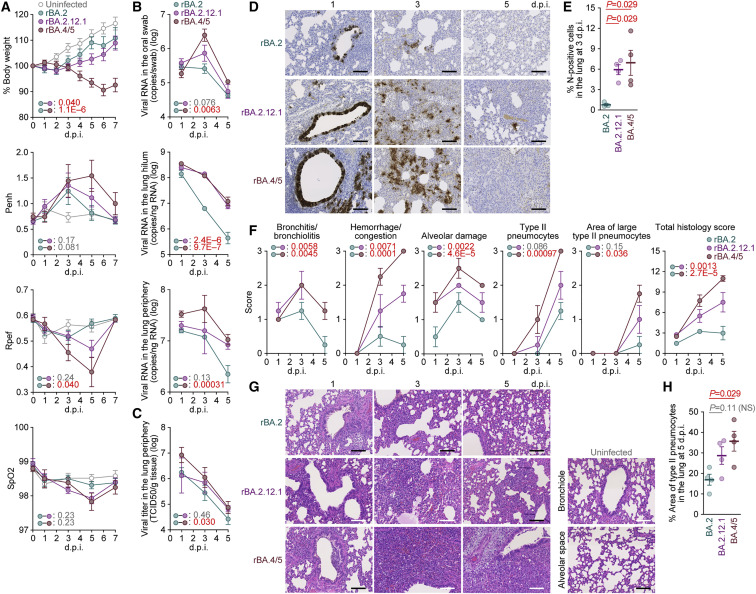
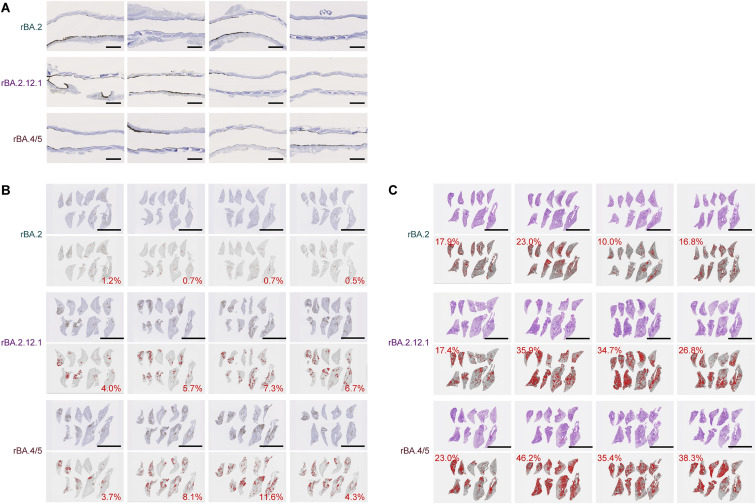
After the global spread of the SARS-CoV-2 Omicron BA.2, some BA.2 subvariants, including BA.2.9.1, BA.2.11, BA.2.12.1, BA.4, and BA.5, emerged in multiple countries. Our statistical analysis showed that the effective reproduction numbers of these BA.2 subvariants are greater than that of the original BA.2. Neutralization experiments revealed that the immunity induced by BA.1/2 infections is less effective against BA.4/5. Cell culture experiments showed that BA.2.12.1 and BA.4/5 replicate more efficiently in human alveolar epithelial cells than BA.2, and particularly, BA.4/5 is more fusogenic than BA.2. We further provided the structure of the BA.4/5 spike receptor-binding domain that binds to human ACE2 and considered how the substitutions in the BA.4/5 spike play roles in ACE2 binding and immune evasion. Moreover, experiments using hamsters suggested that BA.4/5 is more pathogenic than BA.2. Our multiscale investigations suggest that the risk of BA.2 subvariants, particularly BA.4/5, to global health is greater than that of original BA.2.

Keywords: BA.2; BA.2.12.1; BA.4; BA.5; COVID-19; Omicron; SARS-CoV-2; immune resistance; pathogenicity; transmissibility.


Conflict of interest statement

Declaration of interests Y.Y. and T.N. are founders and shareholders of HiLung, Inc. J.K. is an employee of HiLung, Inc. Y.Y. is a co-inventor of patents (PCT/JP2016/057254; “Method for inducing differentiation of alveolar epithelial cells,” PCT/JP2016/059786, “Method of producing airway epithelial cells”).

Figures

None
Graphical abstract
Figure 1
Figure 1
Epidemic of BA.2 subvariants bearing the L452R/Q/M substitutions in S (A) A maximum likelihood (ML) tree of the Omicron lineages sampled from South Africa. The mutations acquired in the S proteins of BA.4 and BA.5 lineages are indicated in the panel. Note that R493Q is a reversion (i.e., back mutation from the BA.1–BA.3 lineages [R493] to the B.1.1 lineage [Q493]). Bootstrap values, ≥0.85; ∗∗ ≥0.9. (B) An ML tree of BA.2. The BA.2 subvariants bearing substitutions at the L452 residue of the S protein are indicated as colored dots, and the estimated common ancestry groups of the variants are indicated as vertical bars. The PANGO lineages are indicated in the panel. The substitutions in the S proteins of each group are shown in parentheses. (C) Heatmap summarizing the frequency of amino acid substitutions. Substitutions detected in >50% of sequences of any lineage are shown. (D) Estimated relative Re of each viral lineage, assuming a fixed generation time of 2.1 days. The Re value of BA.2 is set at 1. The posterior (violin), posterior mean (dot), and 95% Bayesian confidence interval (CI) (line) are shown. (E) Epidemic dynamics of SARS-CoV-2 lineages. The results for up to five predominant lineages in South Africa (top) and the USA (bottom) are shown. The observed daily sequence frequency (dot) and the dynamics (posterior mean, line; 95% CI, ribbon) are shown. The dot size is proportional to the number of sequences. The BA.2 subvariants without substitutions at the L452 residue of the S protein are summarized as “BA.2.” In (D) and (E), the SARS-CoV-2 genome surveillance data downloaded from GISAID (https://www.gisaid.org/) on May 15, 2022, was used. See also Figure S1 and Table S1. Summary of the mutations among Wuhan-Hu-1, original BA.2 and BA.2 subvariants, related to Figure 1, Table S2. The estimated common ancestry groups of BA.2 variants bearing the S L452 substitutions, related to Figure 1, Table S3. The estimated relative Re values of viral lineages in each country, related to Figure 1.
Figure S1
Figure S1
Phylogenetic analysis of BA.2 subvariants, related to Figure 1 (A) The mutation profile of the Omicron lineages in South Africa, related to Figure 1A. Mutations detected in ≥5 sequences in the ML tree are summarized. (B) Comparison of mutations in S protein among BA.2 subvariants. Mutations detected in ≥50% sequences of at least one lineage are summarized. (C) The country and PANGO lineage of the BA.2 sequences in the ML tree, related to Figure 1B. (D) Estimation of each common ancestry group of the S protein L452 substitution-bearing BA.2 variants. The amino acid at position 452 in the S protein in each ancestral node was estimated by a Markov model, and the branches where the L452 substitution was acquired (red branches with asterisks) were estimated. (E) Epidemic dynamics of SARS-CoV-2 lineages. The results for up to five predominant lineages in Denmark (left), France (middle), and Belgium (right) where the BA.2-related Omicron variants bearing the S protein L452R/Q/M substitution circulating are shown. The observed daily sequence frequency (dot) and the dynamics (posterior mean, line; 95% CI, ribbon) are shown. The dot size is proportional to the number of sequences. The BA.2 sublineages without substitution at the L452 residue of the S protein are summarized as “BA.2.” (F) Estimated relative Re of each viral lineage, assuming a fixed generation time of 2.1 days. The Re value of BA.2 is set at 1. The posterior (violin), posterior mean (dot), and 95% Bayesian confidence interval (CI) (line) are shown. Unlike Figure 1D, the SARS-CoV-2 genome surveillance data downloaded on July 7, 2022, was used.
Figure 2
Figure 2
Immune resistance of BA.2 subvariants Neutralization assays were performed with pseudoviruses harboring the S proteins of B.1.1 (the D614G-bearing ancestral virus), BA.1, BA.2 subvariants and BA.2-based derivatives, and the following sera. (A) Convalescent sera from not fully vaccinated individuals who had been infected with BA.1 (14 non-vaccinated donors). (B) Convalescent sera from not fully vaccinated individuals who had been infected with BA.2 (9 non-vaccinated and 1 1-dose vaccinated. 10 donors in total). (C) Convalescent sera from fully vaccinated individuals who had been infected with BA.1 after full vaccination (16 2-dose vaccinated donors). (D) Convalescent sera from fully vaccinated individuals who had been infected with BA.2 after full vaccination (9 2-dose vaccinated and 5 3-dose vaccinated. 14 donors in total). (E–G) BNT162b2 vaccine sera (15 donors) collected at 1 month after 2nd-dose vaccination (E), 1 month after 3rd-dose vaccination (F), and 4 months after 3rd-dose vaccination (G). (H) Sera from mice immunized with BA.2 S RBD (11 mice). (I–K) Sera from hamsters infected with BA.2 (18 hamsters) (I), BA.2.12.1 (6 hamsters) (J), and BA.4/5 (6 hamsters) (K). Assays for each serum sample were performed in triplicate to determine the 50% neutralization titer (NT50). Each dot represents one NT50 value, and the geometric mean and 95% CI are shown. The numbers in red indicate the fold change resistance of BA.4/5 versus BA.2 (C, D, F–I, and K) or BA.2.12.1 (J). The horizontal dashed line indicates the detection limit (120-fold). Statistically significant differences were determined by two-sided Wilcoxon signed-rank tests. The p values between BA.4/5 and BA.2 (C, D, F–I, and K) or BA.2.12.1 (J) are indicated in the panels. Asterisks in the panels indicate statistically significant differences (p < 0.05) between BA.2 and BA.2-based derivatives. Red and blue asterisks, respectively, indicate decreased and increased NT50s. Information on the vaccinated/convalescent donors is summarized in Table S4. See also Table S4.
Figure 3
Figure 3
Virological features of BA.2 subvariants in vitro (A) Pseudovirus assay. The percent infectivity compared with that of the virus pseudotyped with the BA.2 S protein are shown. (B) Binding affinity of the RBD of SARS-CoV-2 S protein to ACE2 by yeast surface display. The KD value indicating the binding affinity of the RBD of the SARS-CoV-2 S protein to soluble ACE2 when expressed on yeast is shown. (C) Crystal structure of the BA.4/5 S RBD-human ACE2 complex. Characteristic substitutions in the BA.4/5 S RBD are shown in brown sticks. In the close-up view, the ACE2 residues surrounding these substitutions are shown in dark gray sticks. Corresponding residues in the BA.1 S RBD-human ACE2 complex structure are also shown in green (RBD) and light gray (ACE2) sticks. Dashed lines represent hydrogen bonds. (D and E) S-based fusion assay. (D) S protein expression on the cell surface. Representative histograms stained with an anti-S1/S2 polyclonal antibody are shown in Figure S2B, and the summarized data are shown. In the left panel, the number in the histogram indicates the mean fluorescence intensity (MFI). Gray histograms indicate isotype controls. (E) S protein-based fusion assay in Calu-3 cells. The recorded fusion activity (arbitrary units) is shown. The dashed green line indicates the results of BA.2. Assays were performed in quadruplicate (A and E) or triplicate (B and D), and the presented data are expressed as the average ± SD. Each dot indicates the result of an individual replicate. In (A), (B), and (D), statistically significant differences between BA.2 and other variants ( p < 0.05 in D) were determined by two-sided Student’s t tests. In (E), statistically significant differences between BA.2 and other variants across time points were determined by multiple regression. The familywise error rates (FWERs) calculated using the Holm method are indicated in the figures. See also Figure S2 and Table S5.
Figure S2
Figure S2
Virological features of the S proteins of BA.2 subvariants in vitro, related to Figure 3 (A) Fold increase in pseudovirus infectivity based on TMPRSS2 expression. (B) Electron density map of the three substituted amino acid residues, compared with those of BA.2, in the RBD of BA.4/5. Polder maps (Liebschner et al., 2017) omitting the R452, V486 or Q493 in the RBD and surrounding residues contoured at the level of 3.5σ, 2.5σ, or 3.1σ, are respectively shown. (C) S protein expression on the cell surface. Representative histograms stained with an anti-S1/S2 polyclonal antibody are shown. The number in the histogram indicates MFI. Gray histograms indicate isotype controls. The summarized data are shown in Figure 3D. (D) S-based fusion assay in VeroE6/TMPRSS2 cells. The recorded fusion activity (arbitrary units) is shown. The dashed green line indicates the results of BA.2. (E) Coculture of S-expressing cells with HEK293-ACE2/TMPRSS2 cells. Left, representative images of S-expressing cells cocultured with HEK293 cells (top) or HEK293-ACE2/TMPRSS2 cells (bottom). Nuclei were stained with Hoechst 33342 (blue). Right, size distribution of syncytia (green). The numbers in parentheses indicate the numbers of GFP-positive syncytia counted. Scale bars, 200 μm. In (A) and (D), assays were performed in quadruplicate, and the presented data are expressed as the average ± SD. In (A) and (E), each dot indicates the result of an individual replicate. In (D), statistically significant differences between BA.2 and the other variants across time points were determined by multiple regression. The FWERs calculated using the Holm method are indicated in the figures. In (E), statistically significant differences between BA.2 and the other variants ( p < 0.05) were determined by two-sided Mann-Whitney U tests.
Figure 4
Figure 4
Growth capacity of BA.2 subvariants in vitro (A) Scheme for the chimeric recombinant SARS-CoV-2 used in this study. The SARS-CoV-2 genome and its genes are shown. The template was SARS-CoV-2 strain TY40-385 (PANGO lineage BA.2, GISAID ID: EPI_ISL_9595859), and the S genes were swapped with those of the BA.2-related Omicron variants. The substitutions based on the BA.2 S protein are summarized in parentheses. (B) Plaque assay. VeroE6/TMPRSS2 cells were used for the target cells. Representative panels and a summary of the recorded plaque diameters (20 plaques per virus) (lower right) are shown. (C–F) Growth kinetics of the chimeric recombinant SARS-CoV-2. VeroE6/TMPRSS2 cells (C), Vero cells (D), human iPSC-derived airway epithelial cells (E), and alveolar epithelial cells (F) were infected with the BA.2-based chimeric recombinant SARS-CoV-2, and the copy numbers of viral RNA in the culture supernatant were routinely quantified by RT-qPCR. The dashed green line indicates the results of rBA.2. In (B) (lower right panel), each dot indicates the result of an individual plaque, and the presented data are expressed as the average ± SD. Statistically significant differences versus rBA.2 ( p < 0.05) were determined by two-sided Mann-Whitney U tests. In (C)–(F), assays were performed in quadruplicate and the presented data are expressed as the average ± SD. Statistically significant differences between rBA.2 and the other variants across time points were determined by multiple regression. The FWERs calculated using the Holm method are indicated in the figures.
Figure 5
Figure 5
Virological features of BA.2.12.1 and BA.4/5 in vivo Syrian hamsters were intranasally inoculated with rBA.2, rBA.2.12.1, and rBA.4/5 (summarized in Figure 4A). (A) Body weight and Penh, Rpef, and SpO2 values were routinely measured. Hamsters of the same age were intranasally inoculated with saline (uninfected). (B) Viral RNA loads in the oral swab (top), lung hilum (middle), and lung periphery (bottom). (C) Viral titers in the lung periphery. (D) IHC of the viral N protein in the lungs at 1, 3, and 5 d.p.i. of all infected hamsters (n = 4 per viral strain). (E) Percentage of N-positive cells in whole lung lobes at 3 d.p.i.. The raw data are shown in Figure S3B. (F and G) (F) Histopathological scoring of lung lesions. Representative pathological features are reported in our previous studies (Saito et al., 2022; Suzuki et al., 2022; Yamasoba et al., 2022b). (G) H&E staining of the lungs of infected hamsters. Uninfected lung alveolar space and bronchioles are also shown. (H) Type II pneumocytes in the lungs of infected hamsters. The percentage of the area of type II pneumocytes in the lung at 5 d.p.i. is shown. The raw data are shown in Figure S3C. Data are presented as the average (A and B, top, 6 hamsters per viral strain; B, middle and bottom; C, E, F, and H, 4 hamsters per viral strain) ± SEM. In (E) and (H), each dot indicates the result of an individual hamster. In (A)–(C) and (F), statistically significant differences between rBA.2 and other variants across time points were determined by multiple regression. The 0 d.p.i. data were excluded from the analyses. The FWERs calculated using the Holm method are indicated in the figures. In (E) and (H), the statistically significant differences between rBA.2 and other variants were determined by a two-sided Mann-Whitney U test. In (D) and (G), each panel shows a representative result from an individual infected hamster. Scale bars, 100 μm. See also Figure S3.
Figure S3
Figure S3
Virological features of BA.2.12.1 and BA.4/5 in vivo, related to Figure 5 (A) IHC of the viral N protein in the middle portion of the tracheas of all infected hamsters (n = 4 per viral strain) at 1 d.p.i. Each panel shows a representative result from an individual infected hamster. (B) Right lung lobes of hamsters infected with rBA.2, rBA.2.12.1, or rBA.4/5 (n = 4 per viral strain) at 3 d.p.i. were immunohistochemically stained with an anti-SARS-CoV-2 N monoclonal antibody. In each panel, IHC staining (top) and the digitalized N-positive area (bottom, indicated in red) are shown. The number in the bottom panel indicates the percentage of the N-positive area. Summarized data are shown in Figure 5E. (C) Type II pneumocytes in the lungs of infected hamsters. Right lung lobes of hamsters infected with rBA.2, rBA.2.12.1, or rBA.4/5 (n = 4 per viral strain) at 5 d.p.i. In each panel, H&E staining (top) and the digitalized inflammation area (bottom, indicated in red) are shown. The number in the bottom panel indicates the percentage of the section represented by the indicated area (i.e., the area indicated in red within the total area of the lung lobe). Summarized data are shown in Figure 5H. Scale bars, 1 mm.

References

    1. Abbas Q., Kusakin A., Sharrouf K., Jyakhwo S., Komissarov A.S. 2022. Follow-up investigation and detailed mutational characterization of the SARS-CoV-2 Omicron variant lineages (BA.1, BA.2, BA.3 and BA.1.1) - DOI
    1. Adams P.D., Afonine P.V., Bunkóczi G., Chen V.B., Davis I.W., Echols N., Headd J.J., Hung L.W., Kapral G.J., Grosse-Kunstleve R.W., et al. Phenix: a comprehensive Python-based system for macromolecular structure solution. Acta Crystallogr. D Biol. Crystallogr. 2010;66:213–221. doi: 10.1107/S0907444909052925. - DOI - PMC - PubMed
    1. Aggarwal A., Akerman A., Milogiannakis V., Silva M.R., Walker G., Kidinger A., Angelovich T., Waring E., Amatayakul-Chantler S., Roth N., et al. SARS-CoV-2 omicron BA.5: evolving tropism and evasion of potent humoral responses and resistance to clinical immunotherapeutics relative to viral variants of concern. eBioMedicine. 2022;84:104270. doi: 10.1016/j.ebiom.2022.104270. - DOI - PMC - PubMed
    1. Altarawneh H.N., Chemaitelly H., Ayoub H.H., Hasan M.R., Coyle P., Yassine H.M., Al-Khatib H.A., Benslimane F.M., Al-Kanaani Z., Al-Kuwari E., et al. 2022. Protection of SARS-CoV-2 natural infection against reinfection with the Omicron BA.4 or BA.5 subvariants. - DOI
    1. Aricescu A.R., Assenberg R., Bill R.M., Busso D., Chang V.T., Davis S.J., Dubrovsky A., Gustafsson L., Hedfalk K., Heinemann U., et al. Eukaryotic expression: developments for structural proteomics. Acta Crystallogr. D Biol. Crystallogr. 2006;62:1114–1124. doi: 10.1107/S0907444906029805. - DOI - PMC - PubMed

Publication types

MeSH terms

Substances