. 2022 Oct 5;7(1):57.
doi: 10.1038/s41525-022-00327-8.

Complement component C4 structural variation and quantitative traits contribute to sex-biased vulnerability in systemic sclerosis

Collaborators, Affiliations

Complement component C4 structural variation and quantitative traits contribute to sex-biased vulnerability in systemic sclerosis

Martin Kerick et al. NPJ Genom Med. .

Abstract

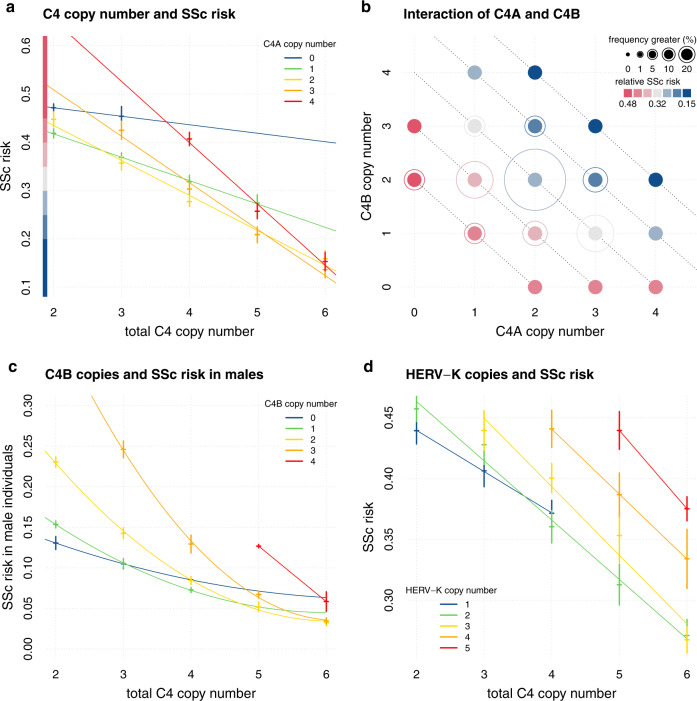
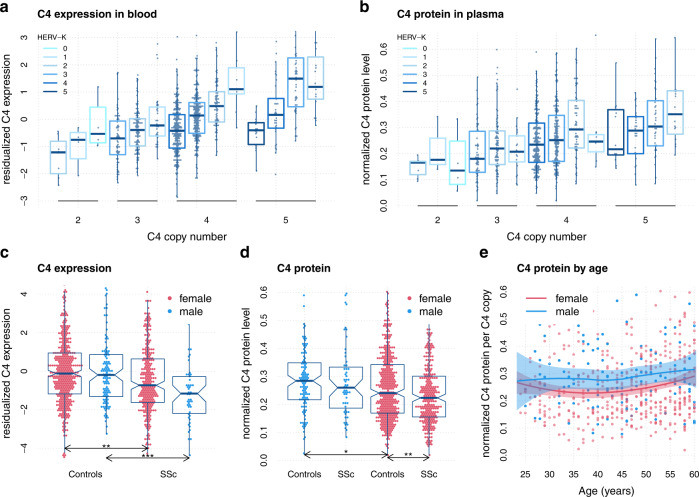
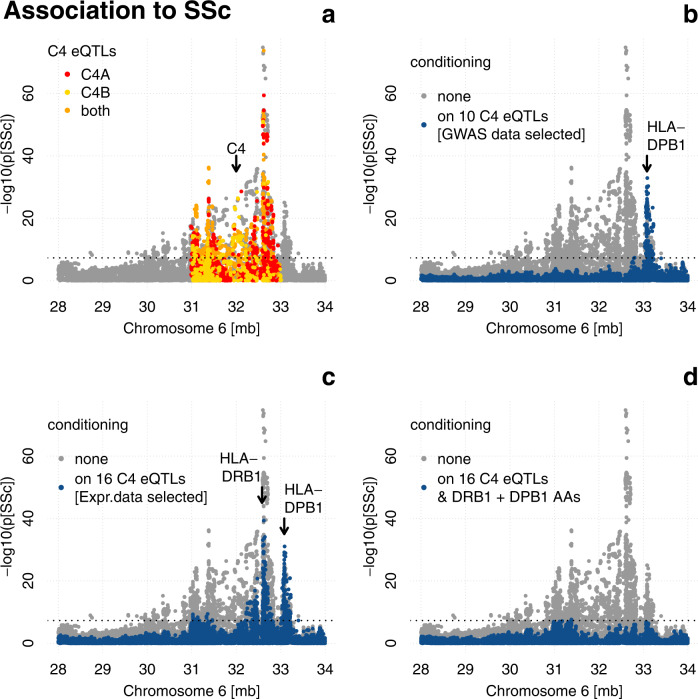
Copy number (CN) polymorphisms of complement C4 play distinct roles in many conditions, including immune-mediated diseases. We investigated the association of C4 CN with systemic sclerosis (SSc) risk. Imputed total C4, C4A, C4B, and HERV-K CN were analyzed in 26,633 individuals and validated in an independent cohort. Our results showed that higher C4 CN confers protection to SSc, and deviations from CN parity of C4A and C4B augmented risk. The protection contributed per copy of C4A and C4B differed by sex. Stronger protection was afforded by C4A in men and by C4B in women. C4 CN correlated well with its gene expression and serum protein levels, and less C4 was detected for both in SSc patients. Conditioned analysis suggests that C4 genetics strongly contributes to the SSc association within the major histocompatibility complex locus and highlights classical alleles and amino acid variants of HLA-DRB1 and HLA-DPB1 as C4-independent signals.


Conflict of interest statement

The authors declare no competing interests.

Figures

Fig. 1
Fig. 1. C4 and HERV-K copy numbers and Systemic Sclerosis risk.
a depicts relative systemic sclerosis (SSc) risk vs total C4 copy number stratified by C4A CN. The SSc risk score is calculated per individual as the sum of effect sizes (betas) multiplied with the design matrix. Betas of C4A, C4B and C4A:C4B were taken from the most complex model “d” (see “Methods”). Crosses are calculated as average relative risk per rounded C4 CN + /− 2 standard deviations (y axis). Linear regression lines are colored by C4A CN and drawn to visualize the interaction effect of C4A and C4B. The y axis contains a color code to aid a comparison with (b). b depicts the relative SSc risk of combinations of C4A and C4B CNs. Relative risk is calculated as in (a). Outer circles are drawn according to population frequency ranges of each C4A, C4B combination and highlight more common combinations. Diagonal dotted lines help to identify combinations of equal total C4 CN. c depicts relative SSc risk in male individuals vs total C4 CN stratified by C4B CN. Relative risk is calculated like in (a) using effect sizes of C4A, C4B, C4A:C4B, Sex:C4A, and Sex:C4B. Crosses are calculated as average relative risk per rounded C4 CN + /− 2 standard deviations (y axis). Cubic regression lines are colored by C4B CN and drawn to visualize the interaction effect of C4A and C4B. d depicts relative SSc risk vs total C4 CN stratified by HERV-K CN. Relative risk is calculated like in (a) using effect sizes of C4A, C4B, C4A:C4B, HERV-K:C4A, and HERV-K:C4B. Crosses are calculated as average relative risk per rounded C4 CN + /− 2 standard deviations (y axis). Linear regression lines are colored by HERV-K CN.
Fig. 2
Fig. 2. C4 expression and C4 protein concentrations in whole blood.
a depicts residualized total C4 expression levels by total C4 copy number (CN) stratified by HERV-K CN. C4 expression is calculated as the sum of C4A and C4B expression as obtained by RNA-Sequencing. The residualized expression has been calculated by regressing out 20 (18) principal components for controls and cases, respectively. Data has been grouped by rounded C4 and HERV-K CN dosage. b depicts normalized C4 protein levels in plasma by total C4 CN stratified by HERV-K CN. C4 protein levels have been normalized across 10+ laboratory sites. c depicts residualized total C4 expression levels (like in a) for SSc and controls, stratified by sex. Significant comparisons are highlighted by asterisk (*P < 0.05, **P < 0.01, ***P < 0.001). d depicts normalized C4 protein levels (like in b) for SSc and controls, stratified by sex. Significant comparisons are highlighted by asterisk (*P < 0.05, **P < 0.01, ***P< 0.001). e depicts normalized C4 protein levels in blood from 119 adult men (blue) and 447 adult women (red) as a function of age with locally estimated scatterplot smoothing (LOESS). Protein levels are normalized to the number of C4 gene copies in an individual’s genome. All boxplot are drawn with default settings in R 4.0.3: lines are defined as first, second and third quartile (Q1, Q2, Q3), whiskers depict the most extreme data points within Q1–1.5 interquartile range (IQR), and Q3 + 1.5 IQR. Boxplot notches are defined as 95% confidence interval of the median.
Fig. 3
Fig. 3. MHC region conditional association with systemic sclerosis.
Association is calculated in the first dataset (N = 26,633) using logistic regression with cohort, genetic background (PC1-5), and sex as covariates and depicted as position (GRCh38) by significance (Manhattan plot) in gray if no additional covariates were used. The dotted line represents the genome-wide significance cutoff P = 5 × 10−8. a Manhattan plot with marked C4 eQTLs obtained from the GTEx v8 database. b Manhattan plot with additional conditioning on ten independent C4 eQTLs, obtained by forward selection in the first dataset, depicted in blue. The arrow marks the position of HLA-DPB1. c Manhattan plot with additional conditioning on 16 independent C4 eQTLs (obtained by forward selection to explain expression variance in the second dataset (N = 857) depicted in blue. The arrows mark the positions of HLA-DPB1 and HLA-DRB1. d Manhattan plot with additional conditioning on 16 independent C4 eQTLs (obtained by forward selection to explain expression variance in the second dataset) and 8 independent amino acids of DRB1 and DPB1 (obtained by forward selection in the first dataset conditioning on 16 independent C4 eQTLs) depicted in blue.

References

    1. Denton CP, et al. Systemic sclerosis. Lancet. 2017;390:1685–1699. doi: 10.1016/S0140-6736(17)30933-9. - DOI - PubMed
    1. Elhai M, et al. Mapping and predicting mortality from systemic sclerosis. Ann. Rheum. Dis. 2017;76:1897–1905. doi: 10.1136/annrheumdis-2017-211448. - DOI - PubMed
    1. Bergamasco A, et al. Epidemiology of systemic sclerosis and systemic sclerosis-associated interstitial lung disease. Clin. Epidemiol. 2019;11:257–273. doi: 10.2147/CLEP.S191418. - DOI - PMC - PubMed
    1. Angiolilli C, et al. New insights into the genetics and epigenetics of systemic sclerosis. Nat. Rev. Rheumatol. 2018;14:657–673. doi: 10.1038/s41584-018-0099-0. - DOI - PubMed
    1. Truchetet, M. E. et al. Current concepts on the pathogenesis of systemic sclerosis. Clin. Rev. Allergy Immunol.10.1007/s12016-021-08889-8 (2021). - PMC - PubMed