. 2022 Oct 5;13(1):5878.
doi: 10.1038/s41467-022-33165-4.

Helicobacter pylori shows tropism to gastric differentiated pit cells dependent on urea chemotaxis

Affiliations

Helicobacter pylori shows tropism to gastric differentiated pit cells dependent on urea chemotaxis

Carmen Aguilar et al. Nat Commun. .

Abstract

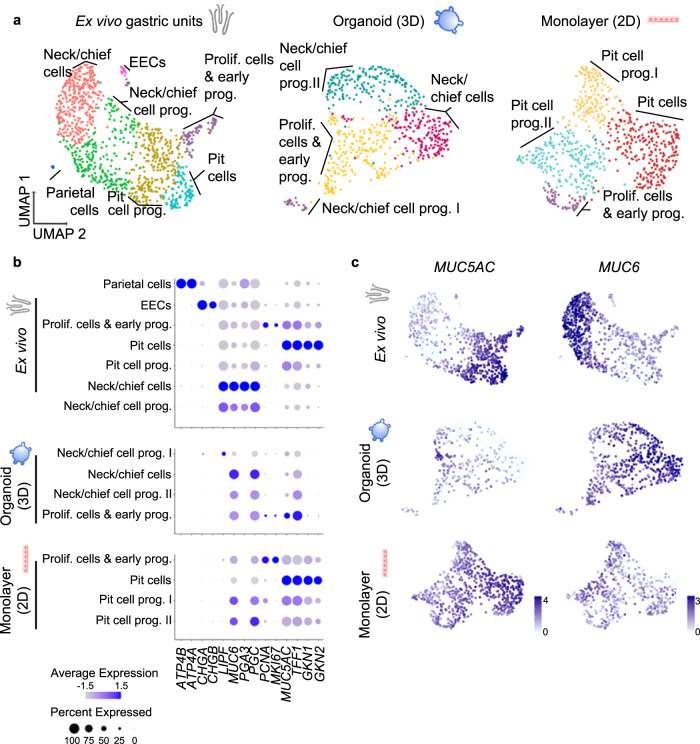
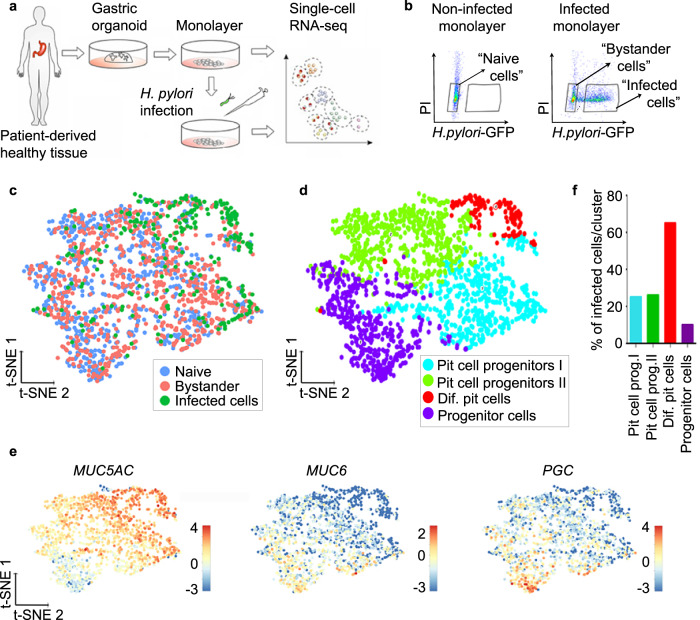
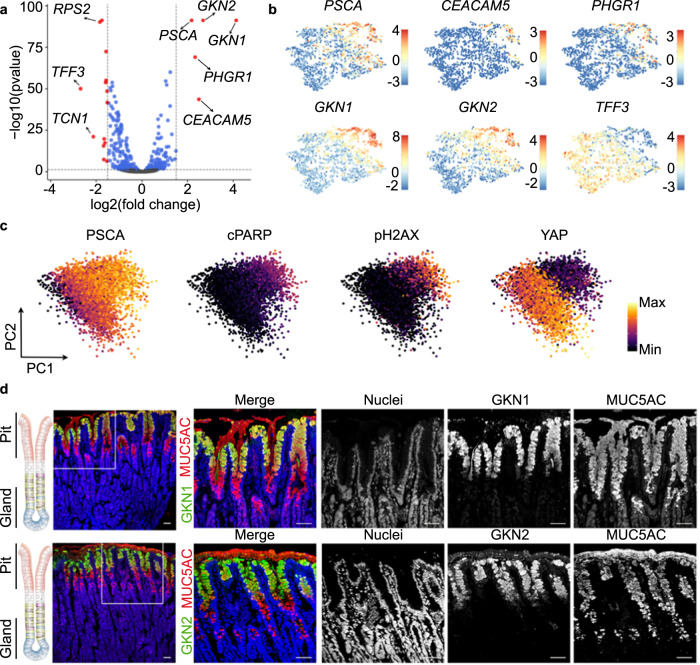
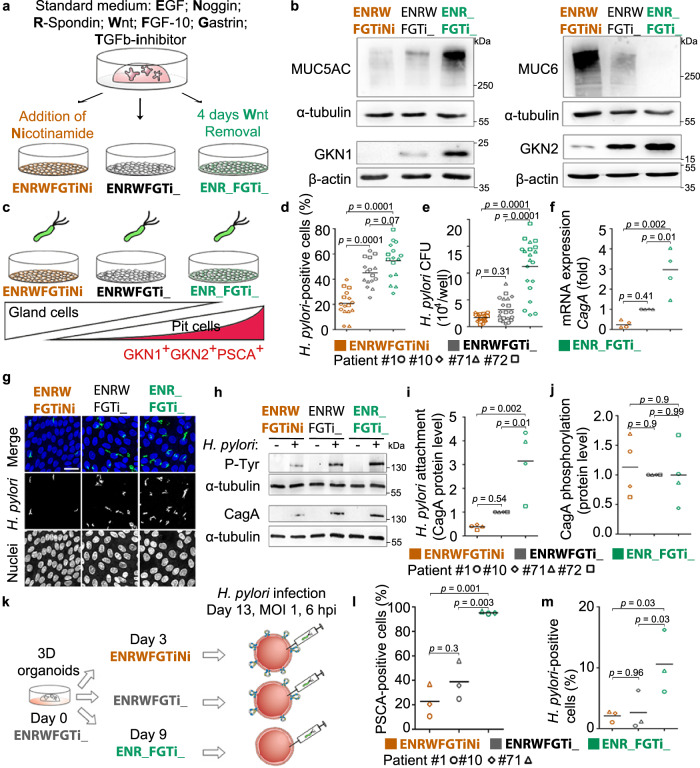
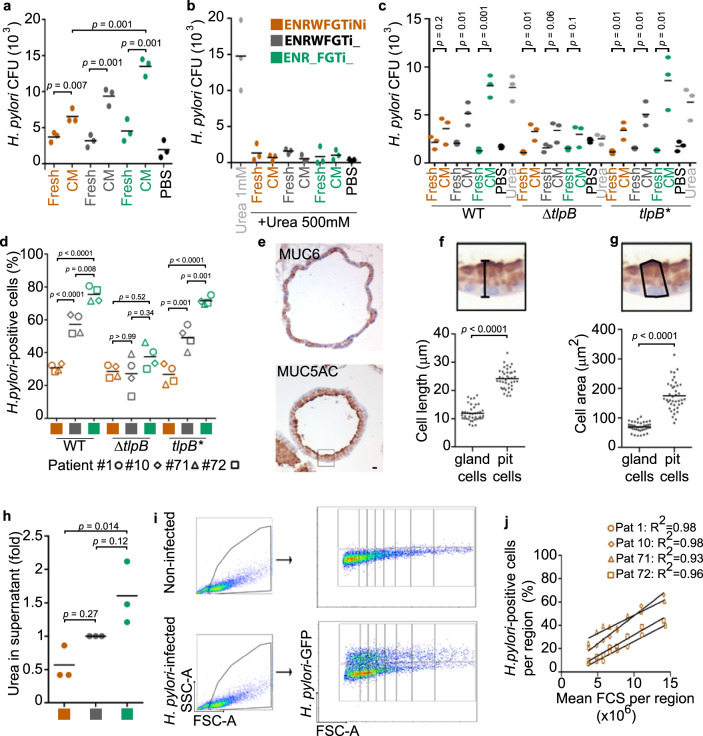
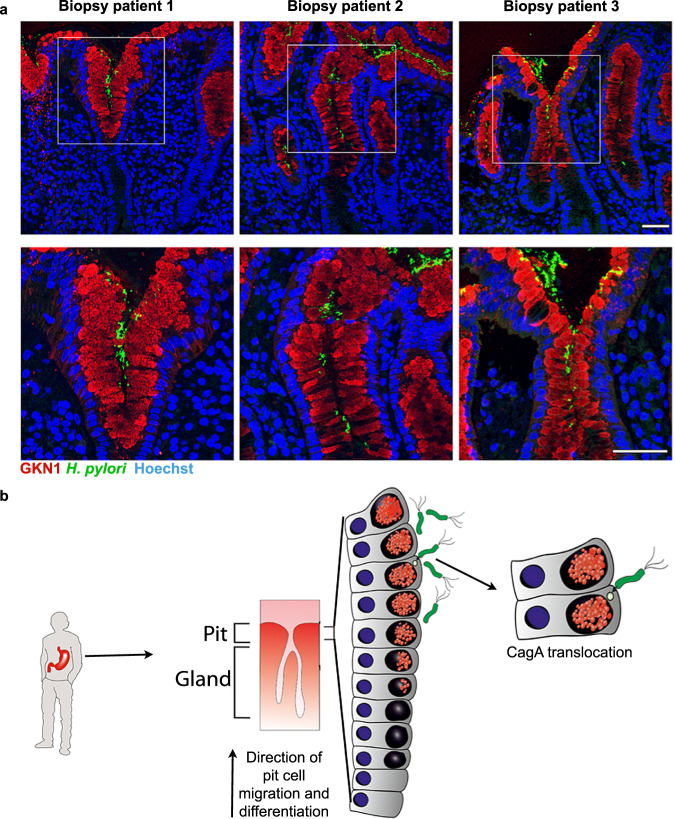
The human gastric epithelium forms highly organized gland structures with different subtypes of cells. The carcinogenic bacterium Helicobacter pylori can attach to gastric cells and subsequently translocate its virulence factor CagA, but the possible host cell tropism of H. pylori is currently unknown. Here, we report that H. pylori preferentially attaches to differentiated cells in the pit region of gastric units. Single-cell RNA-seq shows that organoid-derived monolayers recapitulate the pit region, while organoids capture the gland region of the gastric units. Using these models, we show that H. pylori preferentially attaches to highly differentiated pit cells, marked by high levels of GKN1, GKN2 and PSCA. Directed differentiation of host cells enable enrichment of the target cell population and confirm H. pylori preferential attachment and CagA translocation into these cells. Attachment is independent of MUC5AC or PSCA expression, and instead relies on bacterial TlpB-dependent chemotaxis towards host cell-released urea, which scales with host cell size.


Conflict of interest statement

The authors declare no competing interests.

Figures

Fig. 1
Fig. 1. Organoids and organoid-derived monolayers represent different regions of the gastric units.
a UMAP visualisations of scRNA-seq of ex vivo isolated human gastric units (left, 1022 cells), gastric organoids (centre, 602 cells) and organoid-derived monolayers (right, 696 cells). EEC enteroendocrine cells. Cells are colour-coded according to the annotated clusters. b Dot plot showing the expression of cell type-specific marker genes within the clusters as identified in panel (a). c Expression of the pit cell marker MUC5AC and neck cell marker MUC6 colour-coded and projected on top of the UMAP visualisations as in panel a (data was normalized using ‘LogNormalized’ Seurat method for the expression of the gene within the dataset).
Fig. 2
Fig. 2. scRNA-seq reveals that H. pylori binds to a subpopulation of pit cells.
a Scheme of the experimental setup. Gastric organoids were generated from gastric healthy tissue and used to obtain 2D monolayers. Monolayers were infected with GFP-expressing H. pylori (MOI 1) for 6 h and subjected to scRNA-seq. b Representative flow cytometry dot plots of naïve and infected monolayers. Cells were gated as indicated based on GFP signal (H. pylori) and propidium iodide (PI) and subjected to scRNA-seq. c Single-cell transcriptomes from the different gates (panel b) were integrated and projected using a t-distributed stochastic neighbour embedding (t-SNE) 2D projection. The sample origin is colour-coded. d Using known gastric marker genes for the specific gastric cell types, cell identities were assigned. e Expression of known markers specific for pit cells (MUC5AC), neck cells (MUC6) and chief cells (PGC) colour-coded and projected on top of the t-SNE displayed in panels (c) and (d). f Percentage of H. pylori-infected cells per cluster as identified in panel (d).
Fig. 3
Fig. 3. H. pylori target population is characterized by a high level of cell differentiation.
a Volcano plot showing log-fold change and −log (p-value) for the comparison between cluster 4 (H. pylori-infected enriched cluster) and the rest of the clusters (clusters 1, 2 and 3). Red dots denote DEG with p-value ≤ 0.05 and ≥1.5 log2 fold change. Blue dots denote DEG with p-value ≤ 0.05 and ≤1.5 log2 fold change. b Expression of several DEG shown in panel (a). Expression is colour-coded and projected on the t-SNE as in Fig. 2c. c Protein levels of PSCA, cleaved PARP, phosphorylated H2AX and YAP in 2D naïve monolayers measured by mass spectrometry (CyTOF). Every dot represents an individual cell and colours denote the intensity of the signal. d Confocal microscopic image of human stomach mucosa co-stained for MUC5AC (red), GKN1 (green, upper panel) and GKN2 (green, lower panel) using immunofluorescence. Nuclei were counterstained using Hoechst 33342 (blue). Scale bar: 50 µm. Data in panel c is representative results of organoid lines derived from 3 donors and 1 experiment. Data in panel d is representative of results from 2 donors and 1 experiment.
Fig. 4
Fig. 4. Increased number of differentiated pit cells leads to higher H. pylori adhesion.
a Scheme of the directed differentiation setup. b Western blot analysis of pit markers (MUC5AC, GKN1, and GKN2) and neck markers (MUC6) in 2D monolayers upon differentiation according to the scheme in (a). c Scheme of the experimental setup. Differentiated monolayers were infected with a H. pylori strain expressing GFP at a MOI of 1 for 6 h. d–f Quantification of adhered bacteria to 2D monolayer cells by (d) flow cytometry, (e) CFU assay and (f) qRT-PCR of CagA expression (fold over host GAPDH; f). Results are normalized against standard media (ENRWFGTi_, grey symbols). g Confocal images of differentiated gastric 2D monolayers infected with GFP-expressing H. pylori. Nuclei were counterstained with Hoechst 33342. Scale bar: 25 µm. h Western blot analysis of phosphorylated CagA (P-Tyr) in H. pylori-infected 2D monolayers. i and j Quantification of bacterial attachment (CagA total protein over host alpha-tubulin; i and CagA translocation (P-Tyr over CagA; j) by western blot. k Scheme of the experimental setup. Differentiated 3D organoids were microinjected with H. pylori (MOI 1 for 6 h). l Quantification of PSCA-positive cells in 3D organoids measured by flow cytometry. m Quantification of adhered bacteria to 3D organoid cells by flow cytometry. Data from organoid lines derived from individual donors are shown as symbols (patient #1-circle, #10-diamond, #71-triangle, and #72-square), with mean values with horizontal lines. Data in panel b, dj are representative of or show data of organoid lines from 4 donors, l and m of 3 donors, and 1 (b, f, i and j), 3 (g, h, l, m), 4 (d) or 5 (e) independent experiments. Statistical analysis of data in panels df, i, j and l, m was performed using one-way ANOVA with Tukey’s multiple comparisons post-hoc test. Source data are provided as a Source Data file.
Fig. 5
Fig. 5. H. pylori preference for pit cells depends on chemotaxis to urea scaling with size.
a–c Quantification of wild-type (wt, strain P12) bacterial chemotaxis towards conditioned media (a) or conditioned media plus 500 mM urea (b). Chemotaxis by H. pylori strain G27 WT, ΔtlpB and tlpB* (c). d Quantification of adhered H. pylori strains G27 WT, ΔtlpB and tlpB* to organoid-derived monolayers by flow cytometry. e Representative immunohistochemistry images of a 3D organoid stained for MUC5AC and MUC6. Scale bar: 10 µm. f and g Quantification of cell length (f) and cell area (g) of MUC5AC-(pit cells) and MUC6-positive cells (gland cells) in 3D organoids. h Quantification of urea concentration in organoid-derived monolayer conditioned media. Fold over control differentiation media (grey, ENRWFGTi_). i Representative flow cytometry analysis. j Quantification of H. pylori-positive cells in the FCS regions shown in (i). Data are shown as individual dots (panels a-c, and h, filled dot, pool of 4 organoid lines, 3 independent experiments; in panels d and j, symbols represent organoid lines derived from patient #1-circle, #10-diamond, #71-triangle, and #72-square; 3 independent experiments), mean values with horizontal lines (panel d). Data in panel e is representative of 2 organoid lines and 1 experiment. Statistical analysis of data in panels ac was performed using multiple t-test corrected for multiple comparisons with the Holm–Sidak method; in panels d and h, one-way ANOVA with Tukey’s multiple comparisons post-hoc test.; and in panels f, g, two-tailed Student’s t-test.
Fig. 6
Fig. 6. H. pylori colocalizes with differentiated pit cells in vivo.
a Representative confocal microscopy images of H. pylori-positive tissue sections co-stained for GKN1 (red) and H. pylori (green). Nuclei were counterstained using Hoechst 33342 (blue). Scale bar: 50 µm. Data shown are representative images of three patients and one experiment each. b Model: H. pylori preferentially binds to and translocates CagA into highly differentiated pit cells located at the opening of the gastric units.

References

    1. Salama NR, Hartung ML, Müller A. Life in the human stomach: persistence strategies of the bacterial pathogen Helicobacter pylori. Nat. Rev. Microbiol. 2013;11:385–399. doi: 10.1038/nrmicro3016. - DOI - PMC - PubMed
    1. Amieva M, Peek RM. Pathobiology of Helicobacter pylori-induced gastric cancer. Gastroenterology. 2016;150:64–78. doi: 10.1053/j.gastro.2015.09.004. - DOI - PMC - PubMed
    1. Schreiber S, et al. The spatial orientation of Helicobacter pylori in the gastric mucus. Proc. Natl Acad. Sci. USA. 2004;101:5024–5029. doi: 10.1073/pnas.0308386101. - DOI - PMC - PubMed
    1. Sigal M, et al. Helicobacter pylori activates and expands Lgr5(+) stem cells through direct colonization of the gastric glands. Gastroenterology. 2015;148:1392–404.e21. doi: 10.1053/j.gastro.2015.02.049. - DOI - PubMed
    1. Mahdavi J, et al. Helicobacter pylori SabA adhesin in persistent infection and chronic inflammation. Science. 2002;297:573–578. doi: 10.1126/science.1069076. - DOI - PMC - PubMed

Publication types