. 2022 Oct 5;13(1):5870.
doi: 10.1038/s41467-022-33460-0.

Impact of antigen test target failure and testing strategies on the transmission of SARS-CoV-2 variants

Affiliations

Impact of antigen test target failure and testing strategies on the transmission of SARS-CoV-2 variants

Claudia Del Vecchio et al. Nat Commun. .

Abstract

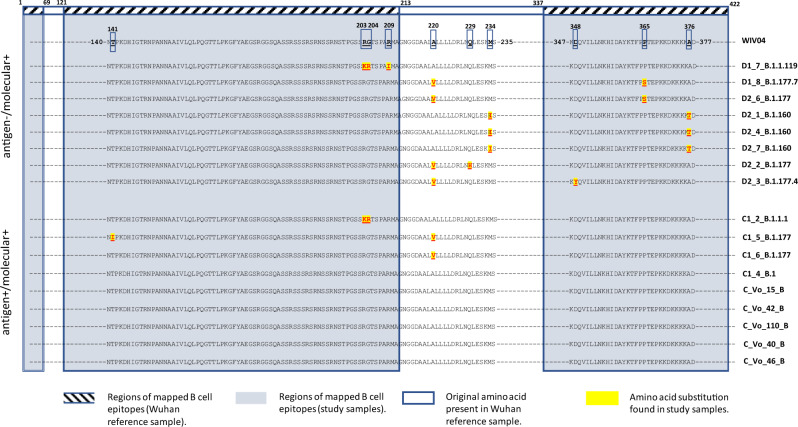
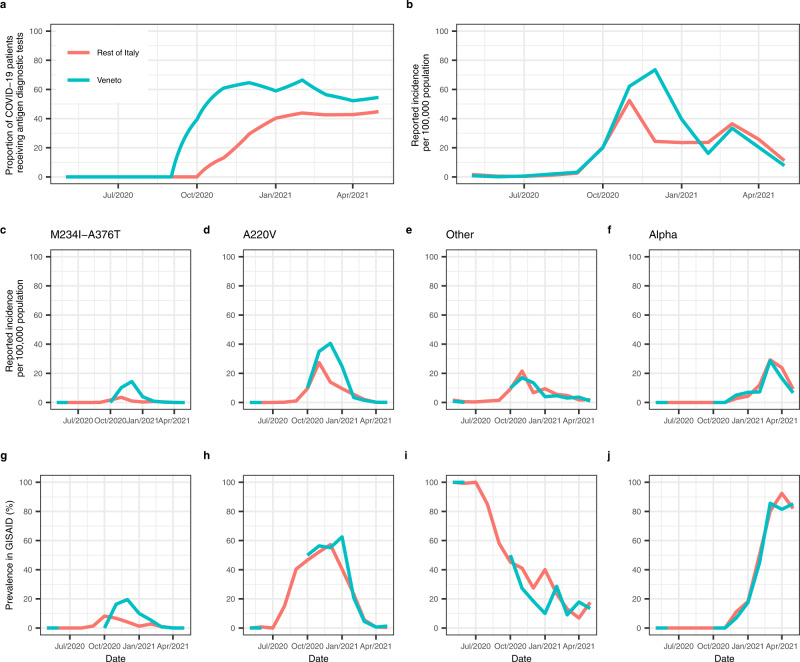
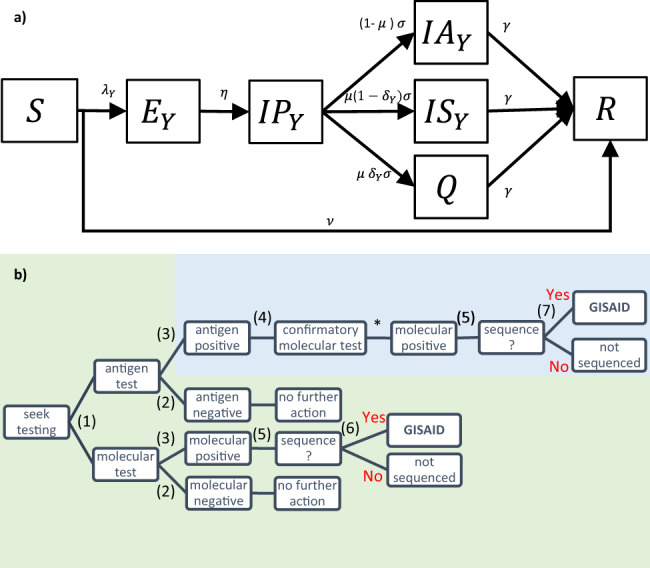
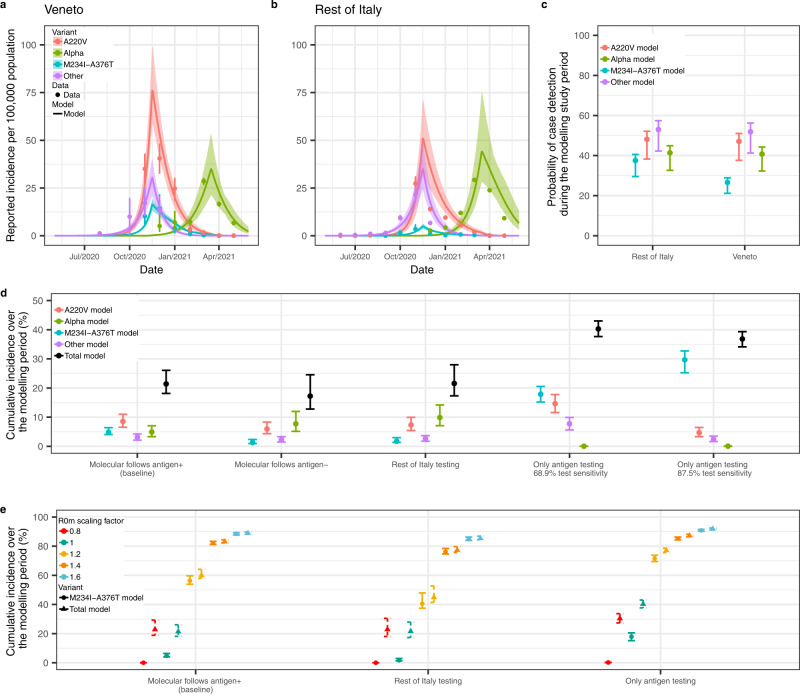
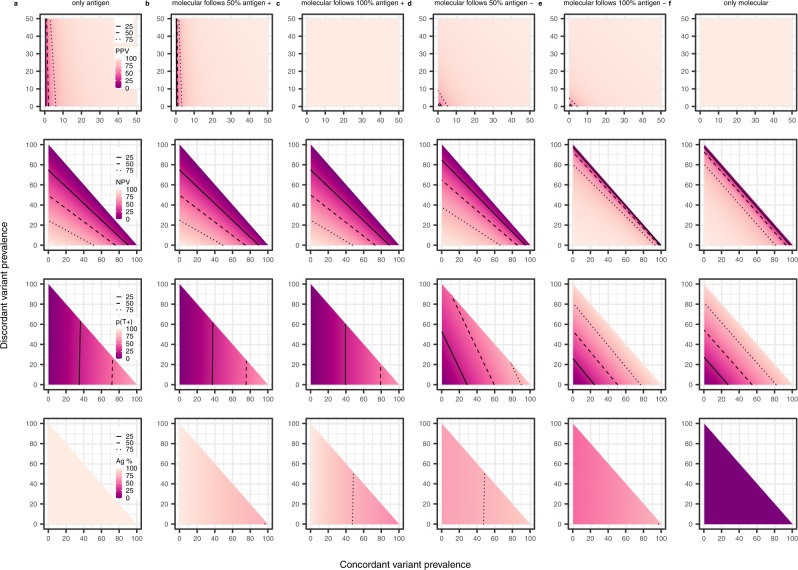
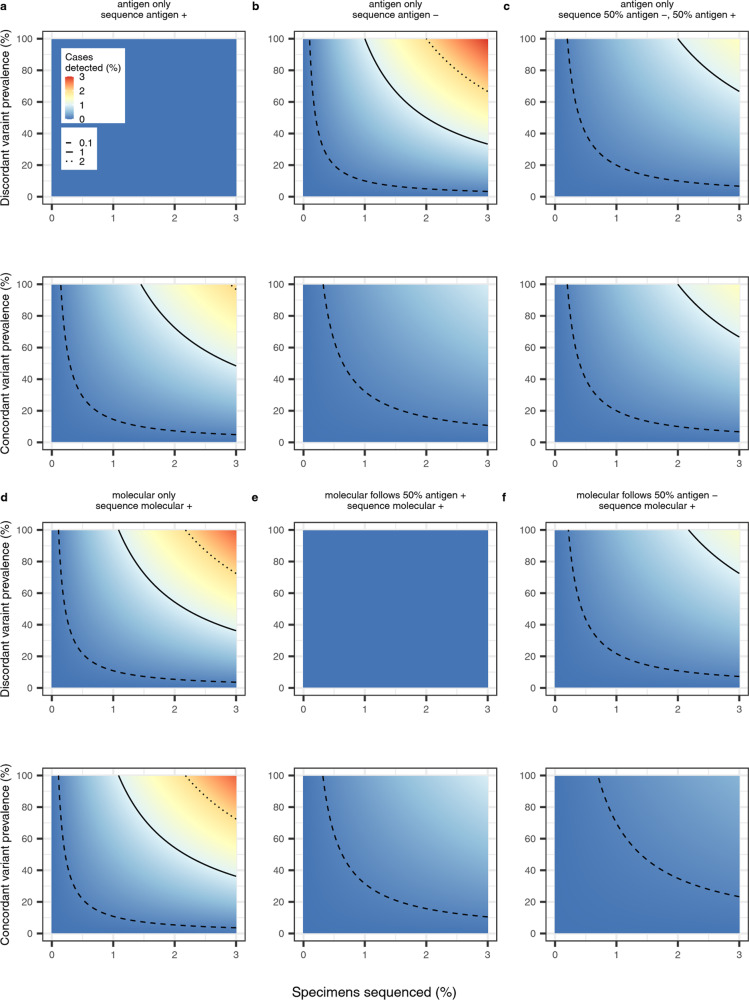
Population testing remains central to COVID-19 control and surveillance, with countries increasingly using antigen tests rather than molecular tests. Here we describe a SARS-CoV-2 variant that escapes N antigen tests due to multiple disruptive amino-acid substitutions in the N protein. By fitting a multistrain compartmental model to genomic and epidemiological data, we show that widespread antigen testing in the Italian region of Veneto favored the undetected spread of the antigen-escape variant compared to the rest of Italy. We highlight novel limitations of widespread antigen testing in the absence of molecular testing for diagnostic or confirmatory purposes. Notably, we find that genomic surveillance systems which rely on antigen population testing to identify samples for sequencing will bias detection of escape antigen test variants. Together, these findings highlight the importance of retaining molecular testing for surveillance purposes, including in contexts where the use of antigen tests is widespread.


Conflict of interest statement

The authors declare no competing interests.

Figures

Fig. 1
Fig. 1. Diagram of admissions to hospital wards.
Diagram showing the total number of patients from emergency and the infectious diseases wards tested with either a molecular or antigen diagnostic test and with both molecular and antigen tests in the period from 15 September to 16 October 2020. Subjects who underwent either antigen or molecular are further subdivided into the corresponding test group with test results. Subjects who underwent both tests are further arranged in four groups according to test result concordance (molecular –/+ antigen –/+). Subjects under 20 were excluded from the hospital surveillance study.
Fig. 2
Fig. 2. Detected variants of N protein: the relative positions of amino-acid substitutions (with respect to the Wuhan reference sequence – WIV04) found in the N gene of 17 full-length sequences of SARS-CoV-2 are shown.
The sequences are from individuals showing either discordant, antigen –/ molecular + or concordant antigen +/ molecular +, at molecular and antigenic swab tests. Regions of mapped B-cell epitopes are highlighted on the Wuhan reference (hatched boxes) and on the sequences of the N gene (grey-shaded boxes). Only sequences around amino-acid substitutions (boxed on the Wuhan reference WIV04) are shown. Mutations found in molecular +/ antigen +, and molecular +/ antigen – sequences are shaded in yellow and highlighted in red. The last six sequences do not contain any mutation in the N gene according to the Wuhan reference sequence.
Fig. 3
Fig. 3. Observed epidemiological data from Veneto and the rest of Italy during the modelling study period.
a Proportion of COVID-19 patients receiving antigen diagnostic tests, b total daily reported incidence per 100,000 population, cf variant-specific daily reported incidences per 100,000 population, reconstructed by multiplying the mean daily reported incidence for each month by the variant-specific prevalence reported in GISAID for each month, gj Variant-specific prevalence reported in GISAID, with the variant specified in panels cf, respectively. GISAID Global Initiative on Sharing Avian Influenza Data.
Fig. 4
Fig. 4. Transmission model and reconstruction of the SARS-CoV-2 reporting process in Italy.
a Simplified flow diagram of the compartmental model used to reproduce the dynamics of the discordant variant M234I-A376T and the concordant variants A220V, Alpha, and other variants, in Veneto and the rest of Italy. Susceptible individuals (S compartment) are infected at rate λY=βY(IPY+IAY+ISY)S0, where subscript Y refers to the virus variants (M234I-A376T, A220V, Alpha, other variants). Upon infection, the latency period (EY compartment) lasts for an average of 1/η days after which individuals are infectious but asymptomatic (IPY compartment) for an average of 1/σ days. We assume that a proportion (1μ) of infections remain asymptomatic (IAY compartment) whilst the remaining proportion (μ) develop symptoms; of these symptomatic individuals we assume that a proportion (1δY) are not detected by surveillance (ISY compartment) and the remaining proportion δY is detected, reported and isolates (Q compartment). After an average infectious period of 1/γ days individuals recover and test negative (R compartment). Susceptible individuals are vaccinated and enter the R compartment at rate ν. b Description of the Italy testing policy, reproduced in the compartmental model. (1) Symptomatic individuals present for diagnosis with either an antigen or molecular test. (2) Negative test results warrant no further action and individuals contribute to transmission (IS compartment). (3) Individuals with a positive antigen or molecular test result isolate until their recovery (Q compartment, 100% compliance). (4) Positive antigen tests are additionally confirmed with a molecular test. (5) A random proportion of molecular-positive samples are selected for genomic surveillance and reported in GISAID. (6) In the green pathway, both discordant and concordant variant samples will be reported in GISAID. (7) In the blue pathway, only concordant variant samples will return a positive antigen result and be reported in GISAID. As positive antigen cases are confirmed by molecular tests, the probability of reporting a concordant variant in GISAID is independent of the test administered. For the discordant variant, the probability of reporting in GISAID depends on the probability that the initial test is molecular. *Antigen-positive samples are assumed to also be molecular-positive.
Fig. 5
Fig. 5. Transmission dynamics of SARS-CoV-2 variants (A220V, M234I-A376T, Alpha and others) in Veneto and the rest of Italy, and cumulative incidences under different counterfactual testing scenarios.
a Veneto and b the rest of Italy estimated daily reported incidences per 100,000 population of A220V, M234I-A376T, Alpha and other virus variants, fitted from observed incidence data assuming a Negative Binomial likelihood (point and 95% binomial CI). Estimates are the mean and 95% CrI (solid line and shaded region), obtained from the 2.5% and 97.5% percentiles of 100 samples of the posterior distributions. c Probability of detecting cases attributable to the A220V, M234I-A376T, Alpha or other virus variants in Veneto and the rest of Italy during the modelling study period. Point and error bars are the mean and 95% CrI obtained from the 2.5% and 97.5% percentiles of 100 samples of the posterior distributions. d Cumulative A220V, M234I-A376T, Alpha, other virus variants and total incidence (%) in Veneto during the modelling study period, under different counterfactual testing scenarios. e Cumulative M234I-A376T variant and total incidence (%) in Veneto during the modelling study period, under different counterfactual testing scenarios. The R0 of the M234I-A376T variant is multiplied by different scaling factors: 0.8, 1 (baseline), 1.2, 1.4, 1.6. The counterfactual testing scenarios are as follows: molecular follows antigen + is the baseline testing scenario conducted in Veneto; molecular follows antigen – assumes negative antigen tests are followed up with a molecular test; Italy testing assumes the proportion of antigen and molecular tests conducted in Veneto was the same as the rest of Italy over the modelling study period; only antigen testing, 68.9% test sensitivity assumes infections are tested with an antigen test of 68.9% sensitivity (without molecular confirmation); only antigen testing 87.5% test sensitivity assumes infections are tested with an antigen test of 87.5% sensitivity (without molecular confirmation). Point and error bars are the mean and 95% CrI obtained from the 2.5% and 97.5% percentiles of 100 samples of the posterior distributions. CI confidence interval, CrI Credible interval.
Fig. 6
Fig. 6. Performance of antigen and molecular testing strategies, given a range of concordant and discordant variant prevalence values.
a Individuals present for diagnosis with an antigen test and there is no molecular test confirmation. b Individuals present for diagnosis with an antigen test and 50% of positive cases are confirmed with a molecular test. c Individuals present for diagnosis with an antigen test and all positive cases are confirmed with a molecular test. d Individuals present for diagnosis with an antigen test and 50% of negative cases are confirmed with a molecular test. e Individuals present for diagnosis with an antigen test and all negative cases are confirmed with a molecular test. f Individuals present for diagnosis with a molecular test. Presented are the positive predictive value (PPV), negative predictive value (NPV), probability of testing positive (p(T+)) and percentage of diagnostic tests that are antigen (Ag %). Prevalence values range from 0 to 100% for both the discordant and concordant variants. Note that for PPV (top panel) only prevalence values from 0 to 50% are presented. Molecular sensitivity and specificity are 92% and 100%, respectively, regardless of the infecting variant. Antigen sensitivity is 68.9% against the concordant variant and 0% against the discordant variant. Antigen specificity is assumed fixed at 99.68% against both variants. Solid contour denotes 25%, dashed contour denotes 50% and dotted contour denotes 75%.
Fig. 7
Fig. 7. Genomic surveillance of a discordant variant and a concordant variant across different testing and sequencing strategies, given a range of prevalence values.
a Individuals present for diagnosis with an antigen test and a sample of positive specimens are sequenced. b Individuals present for diagnosis with an antigen test and a sample of negative specimens are sequenced. c Individuals present for diagnosis with an antigen test and a sample of both negative and positive specimens are sequenced. d Individuals presenting for diagnosis with a molecular test and a sample of positive specimens are sequenced. e Individuals presenting for diagnosis with an antigen test, 50% of positive cases are confirmed with molecular and a sample of positive molecular specimens are sequenced. f Individuals presenting for diagnosis with an antigen test, 50% of negative cases are confirmed with molecular and a sample of positive molecular specimens are sequenced. Prevalence values range from 0 to 100% for both the discordant and concordant variants. Percentage of specimens sequenced ranges from 0 to 3%. Molecular sensitivity and specificity are 92% and 100%, respectively, regardless of the infecting variant. Antigen sensitivity is 68.9% against the concordant variant and 0% against the discordant variant. Dashed contour denotes 0.1%, solid contour denotes 1% and dotted contour denotes 2%.

References

    1. Mercer TR, Salit M. Testing at scale during the COVID-19 pandemic. Nat. Rev. Genet. 2021;22:415–426. doi: 10.1038/s41576-021-00360-w. - DOI - PMC - PubMed
    1. Drain PK. Rapid diagnostic testing for SARS-CoV-2. N. Engl. J. Med. 2022;386:264–272. doi: 10.1056/NEJMcp2117115. - DOI - PMC - PubMed
    1. Smith RL, et al. Longitudinal assessment of diagnostic test performance over the course of acute SARS-CoV-2 infection. J. Infect. Dis. 2021;224:976–982. doi: 10.1093/infdis/jiab337. - DOI - PMC - PubMed
    1. Pekosz A, et al. Antigen-based testing but not real-time polymerase chain reaction correlates with severe acute respiratory syndrome coronavirus 2 viral culture. Clin. Infect. Dis. 2021;73:e2861–e2866. doi: 10.1093/cid/ciaa1706. - DOI - PMC - PubMed
    1. Mina MJ, Parker R, Larremore DB. Rethinking COVID-19 sest sensitivity – a strategy for containment. N. Engl. J. Med. 2020;383:e120. doi: 10.1056/NEJMp2025631. - DOI - PubMed

Publication types

Supplementary concepts