. 2022 Oct 5;13(1):5655.
doi: 10.1038/s41467-022-33008-2.

Deletion of skeletal muscle Akt1/2 causes osteosarcopenia and reduces lifespan in mice

Affiliations

Deletion of skeletal muscle Akt1/2 causes osteosarcopenia and reduces lifespan in mice

Takayoshi Sasako et al. Nat Commun. .

Abstract

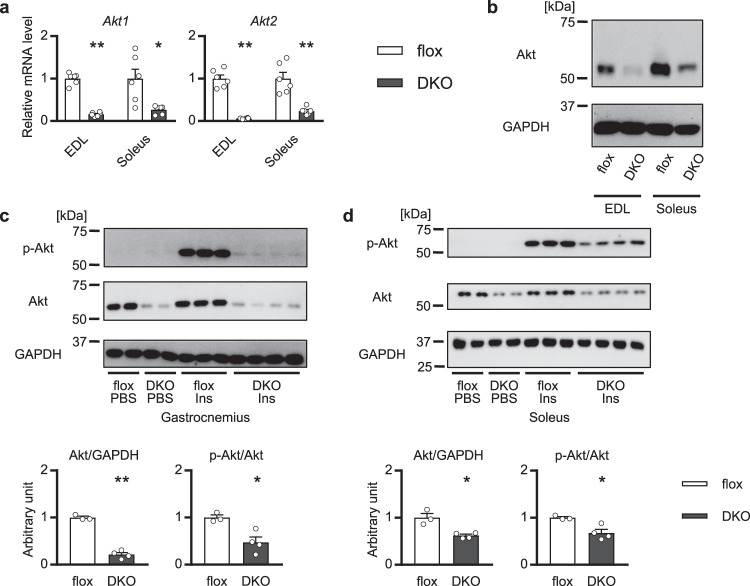
Aging is considered to be accelerated by insulin signaling in lower organisms, but it remained unclear whether this could hold true for mammals. Here we show that mice with skeletal muscle-specific double knockout of Akt1/2, key downstream molecules of insulin signaling, serve as a model of premature sarcopenia with insulin resistance. The knockout mice exhibit a progressive reduction in skeletal muscle mass, impairment of motor function and systemic insulin sensitivity. They also show osteopenia, and reduced lifespan largely due to death from debilitation on normal chow and death from tumor on high-fat diet. These phenotypes are almost reversed by additional knocking out of Foxo1/4, but only partially by additional knocking out of Tsc2 to activate the mTOR pathway. Overall, our data suggest that, unlike in lower organisms, suppression of Akt activity in skeletal muscle of mammals associated with insulin resistance and aging could accelerate osteosarcopenia and consequently reduce lifespan.


Conflict of interest statement

The authors declare no competing interests.

Figures

Fig. 1
Fig. 1. Generation of skeletal muscle-specific Akt1/2 knockout mice.
Expression of Akt in EDL and soleus of the mAktDKO mice at the age of 8 weeks analyzed by, a RT-PCR (n = 6 mice per group, as shown by the number of data points on the graph, same as below), and b western blotting. c, d Insulin signaling in c gastrocnemius, and d soleus, at the age of 8 weeks after treatment with insulin for 10 minutes analyzed by western blotting (n = 3 or 4 mice). Values of the data are expressed as mean ± SEM. *P < 0.05, **P < 0.01. Unpaired 2-tailed t-test was used for assessment, and the exact P values are provided in Supplementary Data 2. Source data are provided as a Source Data file.
Fig. 2
Fig. 2. Body and muscle weight of the mAktDKO mice.
a Body weight (n = 4, 5, 6, 7, 8 or 9 mice per group, as shown by the number of data points on the graph, same as below) at the age of the indicated weeks. b Lean body mass and fat mass analyzed by dualenergy X-ray absorptiometry (DEXA) at the age of the indicated weeks (n = 4, 5, or 6 mice). c Skeletal muscle weight at the age of the indicated weeks (n = 3, 4, 5, 6, 7, or 8 mice). d Immunostaining of EDL with anti-dystrophin antibody and analysis of cross-sectional area (CSA) of myofibers at the age of 80 weeks (n = 3 or 4 mice). Values of the data are expressed as mean ± SEM. *P < 0.05, **P < 0.01. Unpaired 2-tailed t-test (ac) and chi-square test with Yates’ correction d were used for assessment, and the exact P values are provided in Supplementary Data 2. Scale bars: 50 μm. Source data are provided as a Source Data file.
Fig. 3
Fig. 3. Skeletal muscle-associated phenotypes of the mAktDKO mice.
a Grip strength and b exercise duration, of the mAktDKO mice at the age of the indicated weeks (n = 3, 4, 5 or 6 mice per group, as shown by the number of data points on the graph, same as below). c ATP contents of gastrocnemius after exercise for 60 minutes at the age of 8 weeks (n = 5 mice) and after exercise for 15 minutes at the age of 24 weeks (n = 5 or 6 mice). d, e Insulin-dependent glucose uptake in, d EDL and e soleus, analyzed ex vivo using 2-DG at the age of the indicated weeks (n = 5 or 6 mice). fh Ad libitum plasma glucose (PG) before insulin challenge (f), g relative PG after insulin challenge, and h area under the curve (AUC) of relative PG after insulin challenge, in insulin tolerance test (ITT), after intraperitoneal injection of human regular insulin (0.75 U/kg BW, 1.0 U/kg BW, and 1.5 U/kg BW, at the age of 8, 40, and 100 weeks, respectively) (n = 8 or 10 mice at the age of 8 weeks, n = 5 or 8 mice at the age of 40 weeks, and n = 5 or 10 mice at the age of 100 weeks). Values of the data are expressed as mean ± SEM. *P < 0.05, **P < 0.01. Unpaired 2-tailed t-test was used for assessment, and the exact P values are provided in Supplementary Data 2. Source data are provided as a Source Data file.
Fig. 4
Fig. 4. Mechanisms underlying the phenotypes of the mAktDKO mice.
a Gene expression, c DNA copy number, of EDL of the mAktDKO mice at the age of the indicated weeks analyzed by RT-PCR (n = 4, 5, 6, or 7 mice per group, as shown by the number of data points on the graph, same as below). b ATPase staining of EDL at the age of 52 weeks. Scale bars: 50 μm. d, e Electron microscopic image(s) of, horizontal sectioning (d), and vertical sectioning (e), of EDL at the age of 60 weeks. e The percentage of mitophagy-like events were quantified (n = 30 random fields from 3 mice). Scale bars: d 1 μm, and e 500 nm. f An autophagy-related protein in gastrocnemius at the age of 40 weeks 4 h after intraperitoneal administration of leupeptin at the dose of 40 mg/kg of BW in an ad libitum-fed state analyzed by western blotting (n = 3 mice per group). g Macroscopic image of SA-BG staining of EDL at the age of 80 weeks. Scale graduation: 1 mm. Values of the data are expressed as mean ± SEM. *P < 0.05, **P < 0.01. Unpaired 2-tailed t-test (a, c, e) and one-way ANOVA (f) were used for assessment, and the exact P values are provided in Supplementary Data 2. Source data are provided as a Source Data file.
Fig. 5
Fig. 5. Bone-associated and systemic phenotypes of the mAktDKO mice.
a Femur weight of the mAktDKO mice at the age of the indicated weeks (n = 3, 4, 5, 6, 7, or 8 mice per group, as shown by the number of data points on the graph, same as below). b Bone mineral density of lower legs at the age of 40 weeks analyzed by CT scanning (n = 6 mice). c, Analysis of osteoporosis by micro-CT scanning of femur at the age of 52 weeks (n = 6 mice). Scale bars: 500 μm. d Morphometric analysis of calcein-labeled femur at the age of 52 weeks (n = 4 mice). Ob.S/BS: osteoblast surface/bone surface, Oc.S/BS: osteoclast surface/bone surface, BFR/BS: bone formation rate/bone surface. Scale bars: 50 μm. e von Kossa staining of femur at the age of 52 weeks. Scale bars: 500 μm. f Kaplan–Meire curve for survival (n = 38 or 40 mice). g Macroscopic image of thorax of a dissected dead body. Scale graduation: 1 mm. h, i (h) Scatter plot (left) and box and whisker plot (right) of dead body weight, and (i) cause of death, of mice whose dead body was retrieved without severe deterioration (n = 35 or 39 mice). Box: median and quartiles, whisker: 10% and 90% percentiles, +: mean. Values of the data are expressed as mean ± SEM except in f, h, i. *P < 0.05, **P < 0.01. Unpaired 2-tailed t-test (ad, h), logrank test (f), and Chi-square test with Yates’ correction (i) were used for assessment respectively, and the exact P values are provided in Supplementary Data 2. Source data are provided as a Source Data file.
Fig. 6
Fig. 6. Phenotypes of the mAktDKO mice in under- and over-nutrition.
a Plasma glucose (PG), b serum alanine levels, and c serum β-hydroxybutyrate (β-OHB) levels, in the mAktDKO mice at the age of 60 weeks in the ad libitum fed state and in the fasted state for 24 h (n = 6, 7, or 8 mice per group, as shown by the number of data points on the graph, same as below). d Exercise duration of the mAktDKO mice during caloric restriction for 4 weeks from the age of 90 weeks (n = 6 mice). e Kaplan–Meire curve for survival in the mAktDKO mice subjected to caloric restriction from the age of 90 weeks (n = 9 or 10 mice). (f, i) Tissue weight, g grip strength, and h exercise duration, of the mAktDKO mice fed with high-fat diet for 40 weeks (n = 6 or 9 mice). j Relative body weight of the mAktDKO mice fed with high-fat diet for the indicated weeks compared to the control mice (n = 11 or 17 mice). k Area under the curve (AUC) of relative PG in insulin tolerance test (ITT) after intraperitoneal injection of human regular insulin (2.5 U/kg BW) in the mAktDKO mice fed with high-fat diet for 40 weeks (n = 7 or 8 mice). l Kaplan–Meire curve for survival of the mAktDKO mice fed with high-fat diet (n = 19 or 32 mice). m Scatter plot of dead body weight, and (n) cause of death, of mice whose dead body was retrieved without severe deterioration (n = 16 or 28 mice). Values of the data are expressed as mean ± SEM except in (e, l, m, n). *P < 0.05, **P < 0.01. HFD: high-fat diet. Unpaired 2-tailed t-test (ac, fk, m), repeated measure analysis of variance (d), logrank test (e, l), and Chi–square test with Yates’ correction (n) were used for assessment, respectively, and the exact P values are provided in Supplementary Data 2. Source data are provided as a Source Data file.
Fig. 7
Fig. 7. Phenotypes of the mAkt/FoxoQKO mice.
ae, j Body weight (n = 7 or 12 mice per group, as shown by the number of data points on the graph, same as below) (a), lean body mass analyzed by systemic CT scanning (n = 5 or 6 mice) (b), c, j tissue weight (n = 5 or 7 mice), d grip strength (n = 5 or 7 mice), and e exercise duration (n = 5 or 7 mice), of the mAkt/FoxoQKO mice at the age of 52 weeks. f, g Gene expression (f), and DNA copy number, of EDL at the age of 52 weeks analyzed by RT-PCR (n = 5 or 7 mice) (g). h Electron microscopic image of vertical sectioning of EDL at the age of 52 weeks. Scale bars: 500 nm. i Area under the curve (AUC) of relative plasma glucose (PG) in insulin tolerance test (ITT) after intraperitoneal injection of human regular insulin (1.0 U/kg BW) at the age of 40 weeks (n = 7 or 12 mice). k Analysis of osteoporosis by micro-CT scanning of femur at the age of 52 weeks (n = 5 or 7 mice). l Kaplan–Meire curve for survival (n = 18 or 38 mice). m, n Scatter plot of dead body weight (m), and cause of death, of mice whose dead body was retrieved without deterioration (n = 17 or 38 mice) (n). o Skeletal muscle weight of the mAktDKO mice at the age of 90 weeks treated with AS1842856 at the dose of 100 mg/kg of BW daily for 4 weeks (n = 4 or 5 mice). bCD: β-cyclodextrin, AS: AS1842856. Values of the data are expressed as mean ± SEM except in (ln). Unpaired 2-tailed t-test (ag, ik, m, o), logrank test (l), and Chi-square test with Yates’ correction (n) were used for assessment respectively, and the exact P values are provided in Supplementary Data 2. Source data are provided as a Source Data file.
Fig. 8
Fig. 8. Phenotypes of the mAkt/TscTKO mice.
a Body weight (n = 5 or 9 mice per group, as shown by the number of data points on the graph, same as below), b, h tissue weight (n = 5 or 7 mice), c grip strength (n = 5 or 9 mice), and d exercise duration (n = 5 or 9 mice), of the mAkt/TscTKO mice at the age of 52 weeks. e Gene expression, and f DNA copy number, of EDL at the age of 52 weeks analyzed by RT-PCR (n = 5 or 7 mice). g Electron microscopic image of vertical sectioning of EDL at the age of 60 weeks. Scale bars: 500 nm. i Analysis of osteoporosis by micro-CT scanning of femur at the age of 52 weeks (n = 5 or 10 mice). j Kaplan–Meire curve for survival (n = 15 or 17 mice) with the mean survival of 8-week survivors (n = 11 or 15 mice). Values of the data are expressed as mean ± SEM except in j. Unpaired 2-tailed t-test (af, h, i) and logrank test (j) were used for assessment, and the exact P values are provided in Supplementary Data 2. *P < 0.05, **P < 0.01. Source data are provided as a Source Data file.
Fig. 9
Fig. 9. Schematic summary.
a Role of Akt in skeletal muscle in protection against sarcopenia, osteopenia, and reduced lifespan in mice. b Effects of impaired insulin/IGF-1 signaling on lifespan in lower organisms and in skeletal muscle of mammals.

References

    1. Kenyon C. The plasticity of aging: insights from long-lived mutants. Cell. 2005;120:449–460. doi: 10.1016/j.cell.2005.02.002. - DOI - PubMed
    1. Campisi J, et al. From discoveries in ageing research to therapeutics for healthy ageing. Nature. 2019;571:183–192. doi: 10.1038/s41586-019-1365-2. - DOI - PMC - PubMed
    1. Rosenberg IH. Epidemiologic and methodologic problems in determining nutritional-status of older persons - proceedings of a conference held in Albuquerque, New Mexico, October 19–21, 1988 - summary comments. Am. J. Clin. Nutr. 1989;50:1231–1233. doi: 10.1093/ajcn/50.5.1231. - DOI - PubMed
    1. Chen LK, et al. Sarcopenia in Asia: consensus report of the Asian working group for Sarcopenia. J. Am. Med Dir. Assoc. 2014;15:95–101. doi: 10.1016/j.jamda.2013.11.025. - DOI - PubMed
    1. Cruz-Jentoft AJ, et al. Sarcopenia: European consensus on definition and diagnosis: report of the European working group on Sarcopenia in older people. Age ageing. 2010;39:412–423. doi: 10.1093/ageing/afq034. - DOI - PMC - PubMed

Publication types