. 2022 Oct;610(7931):373-380.
doi: 10.1038/s41586-022-05254-3. Epub 2022 Oct 5.

STING-induced regulatory B cells compromise NK function in cancer immunity

Affiliations

STING-induced regulatory B cells compromise NK function in cancer immunity

Sirui Li et al. Nature. 2022 Oct.

Abstract

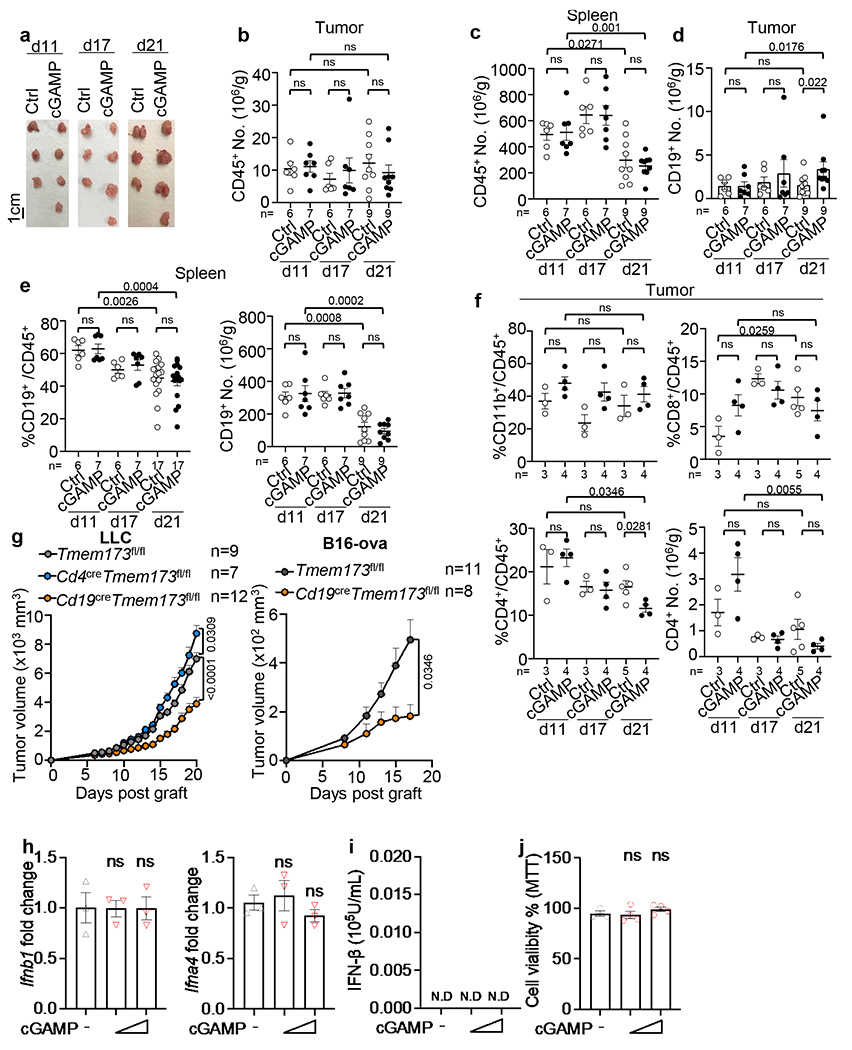
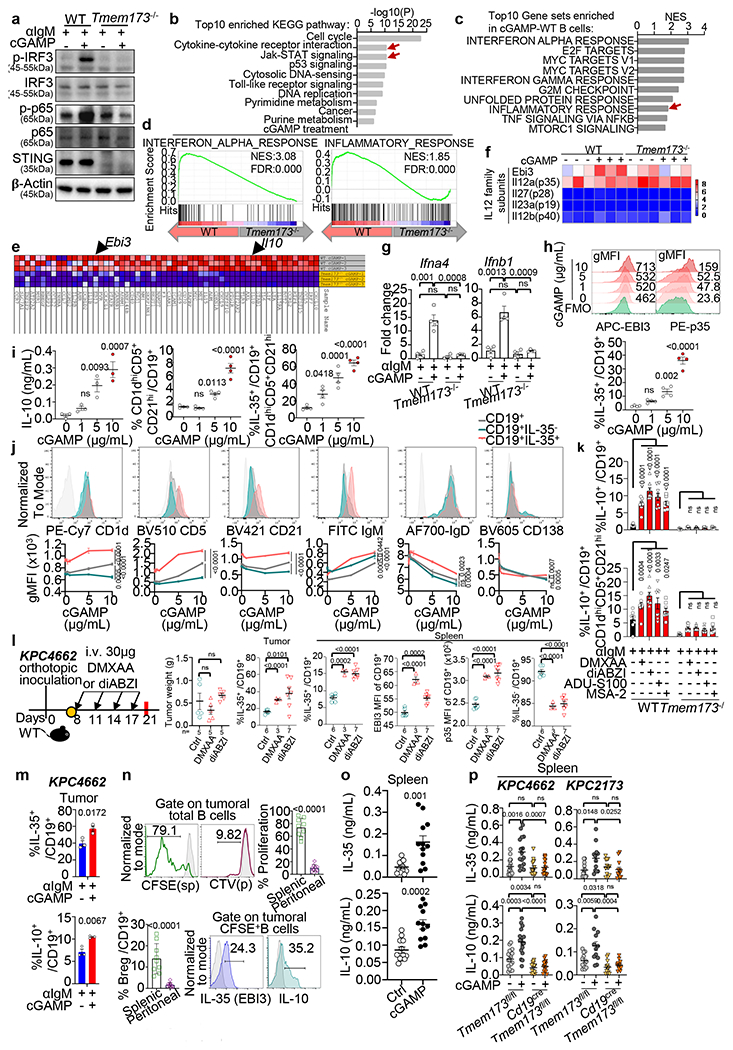
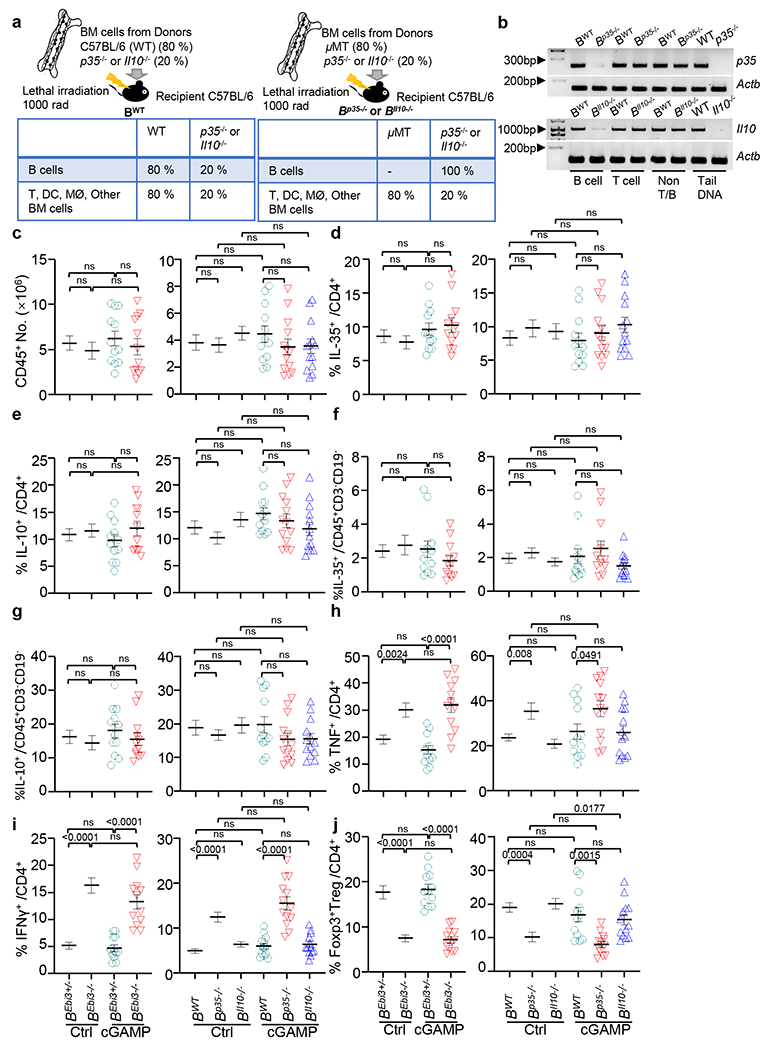
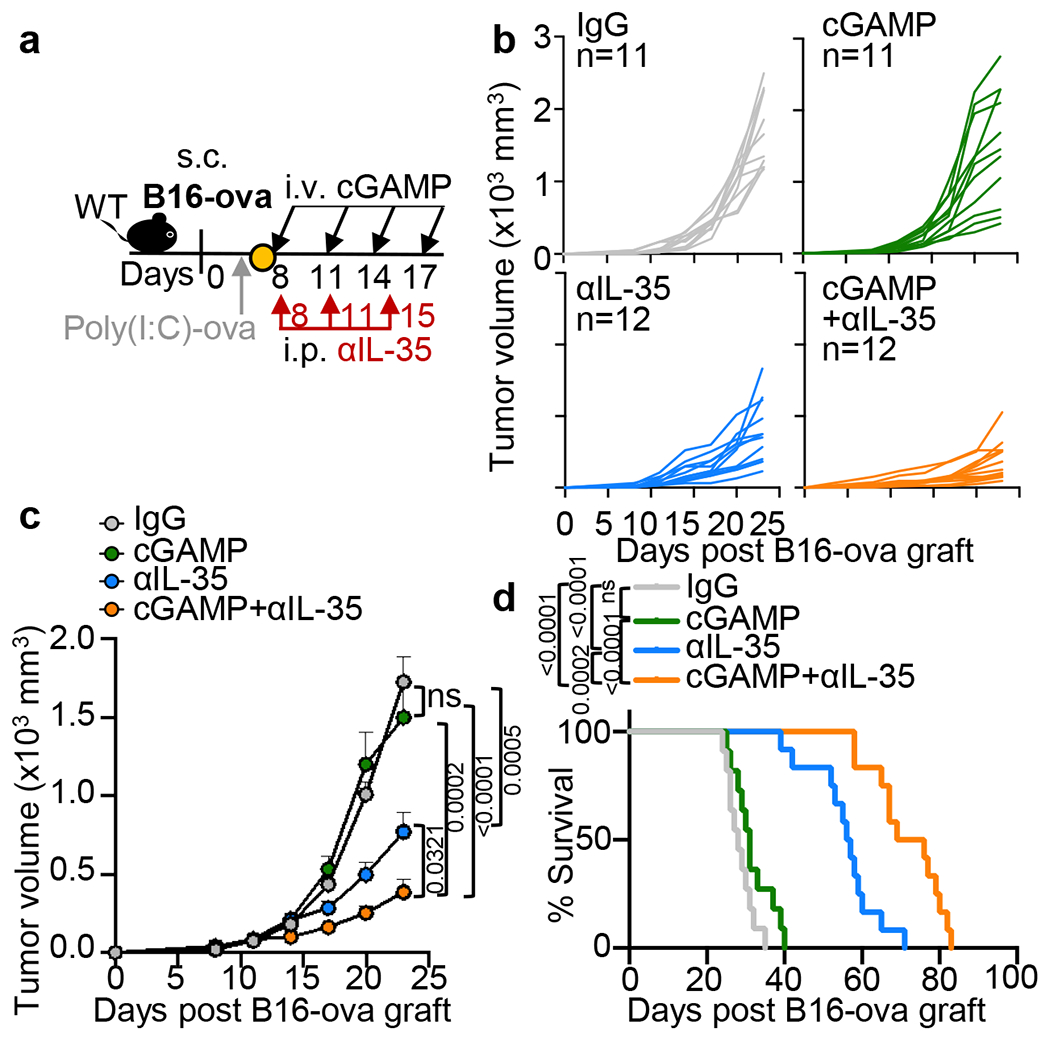
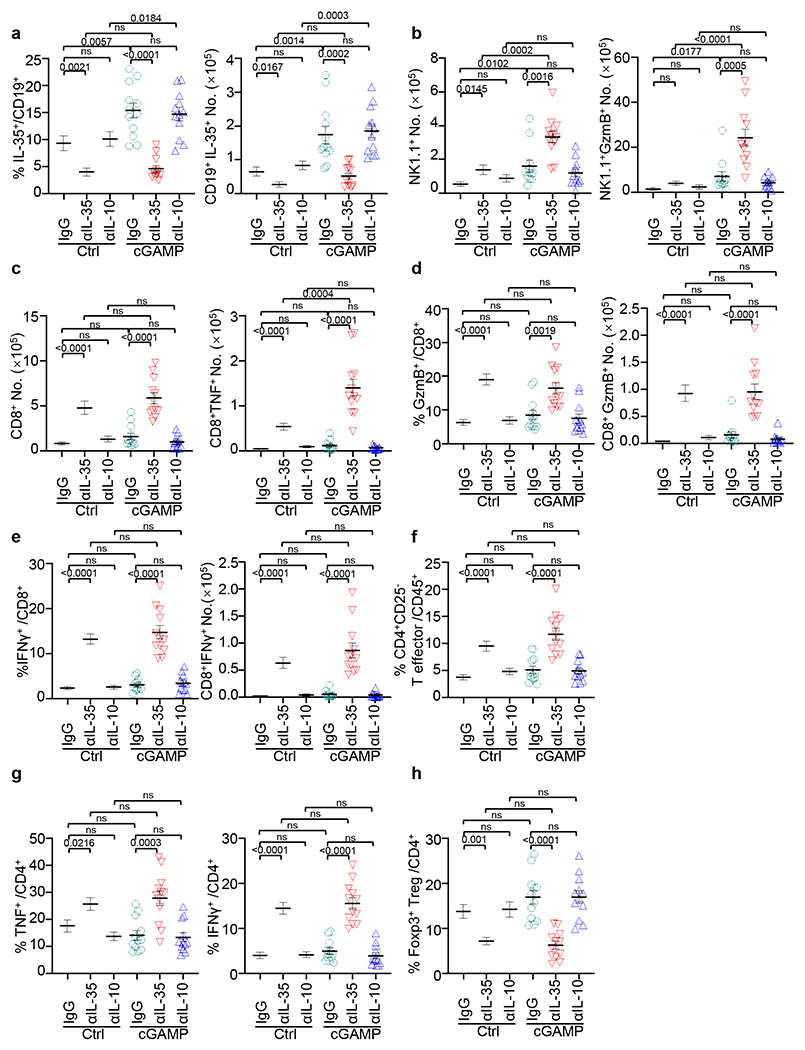
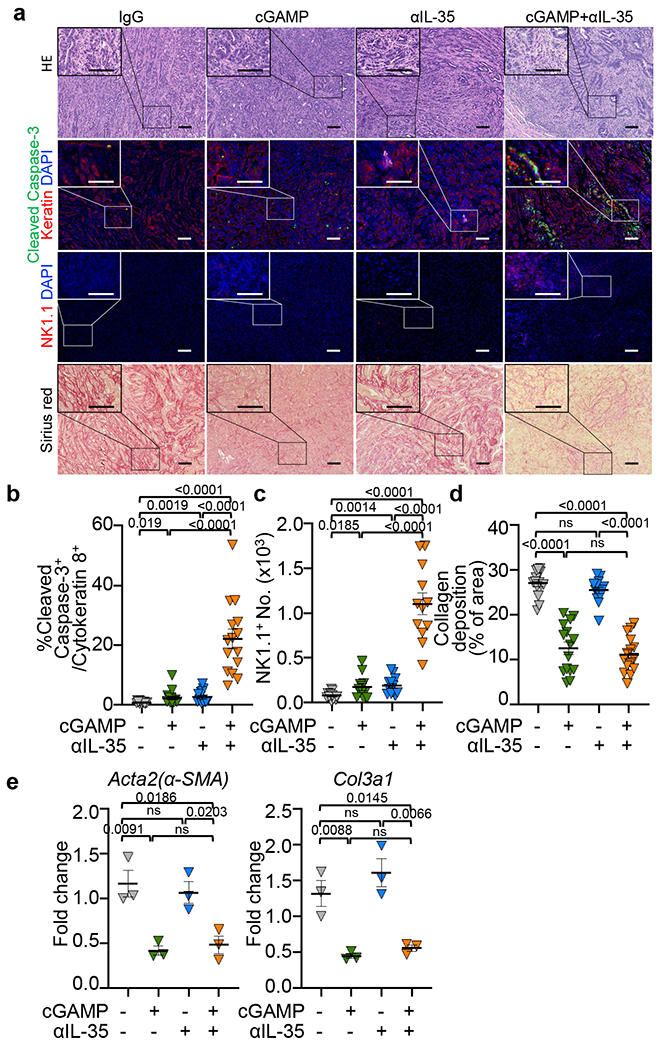
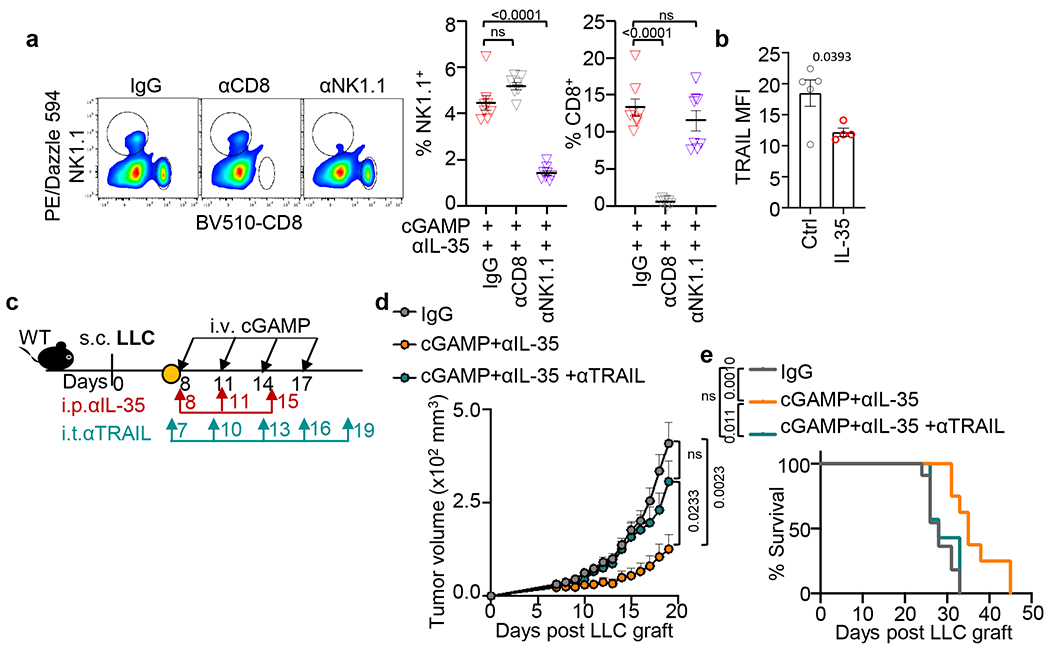
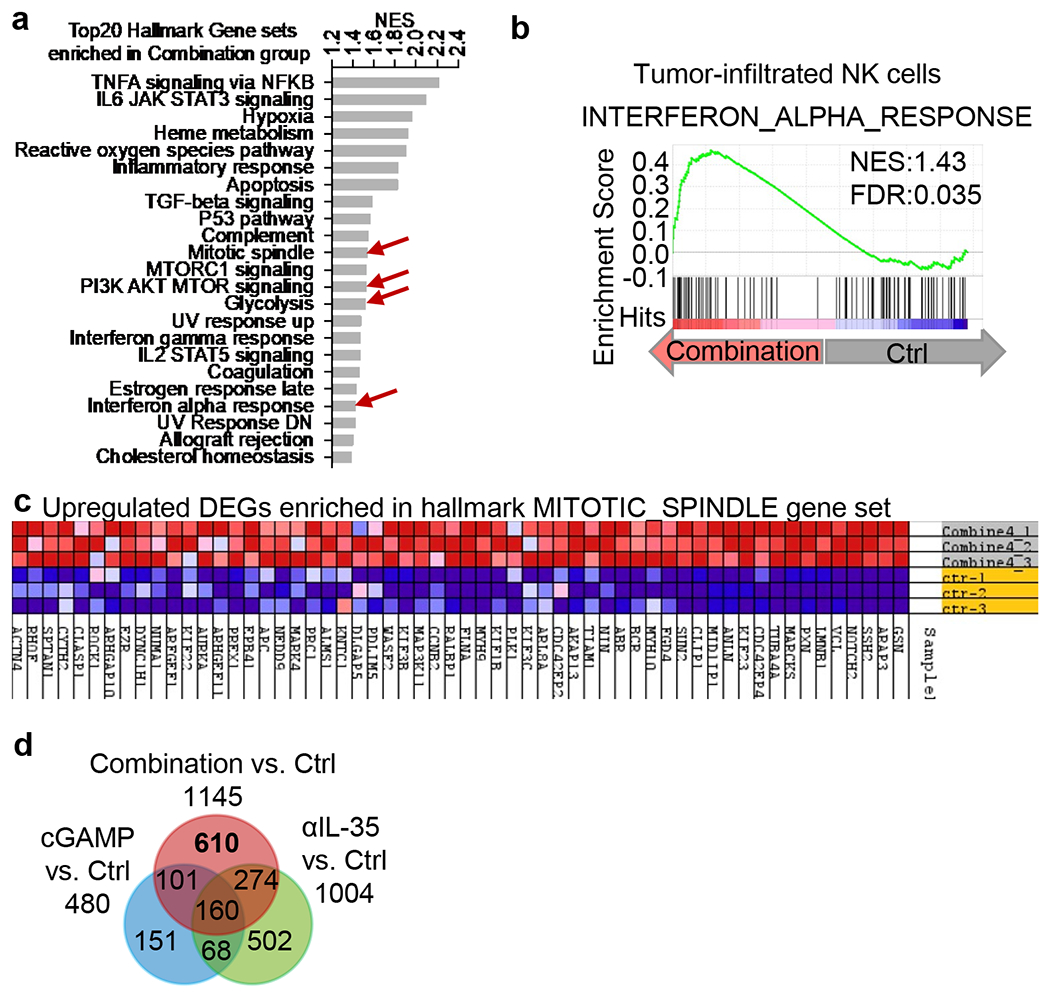
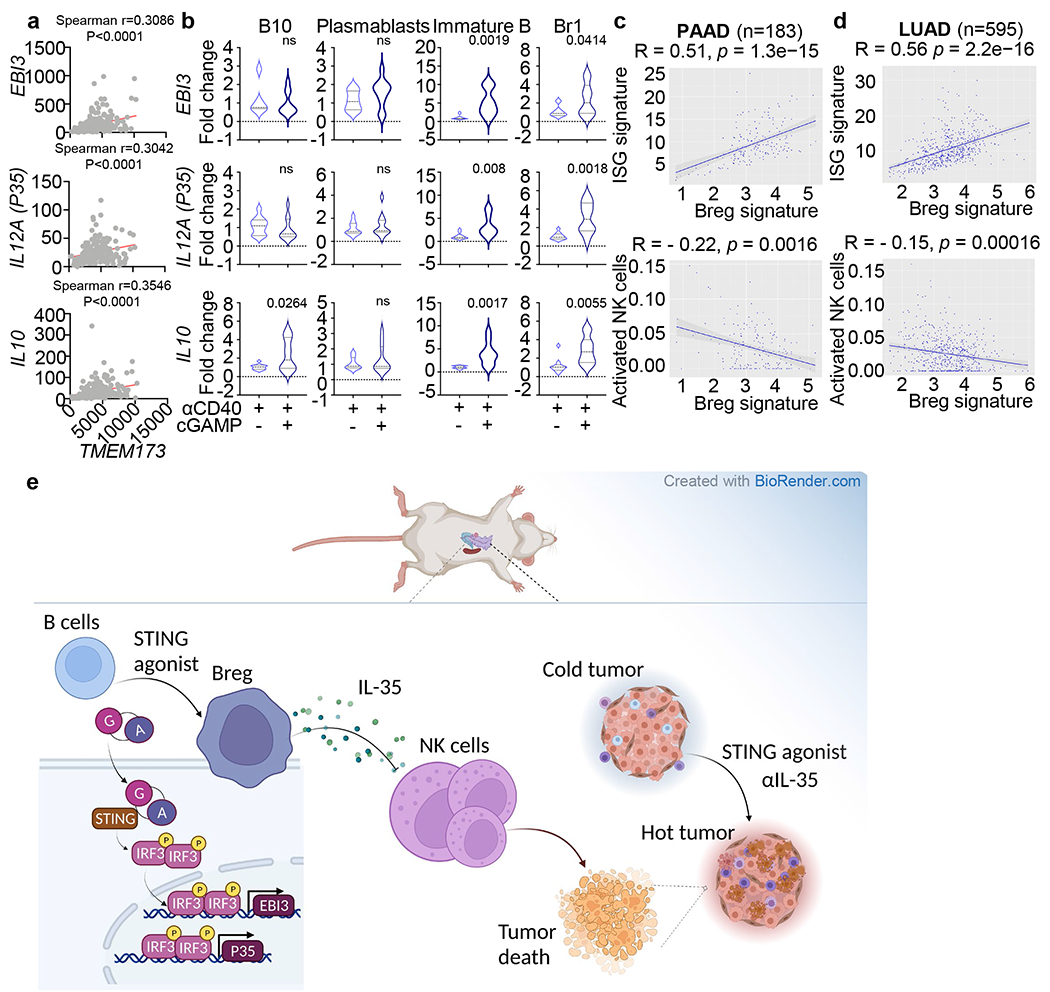
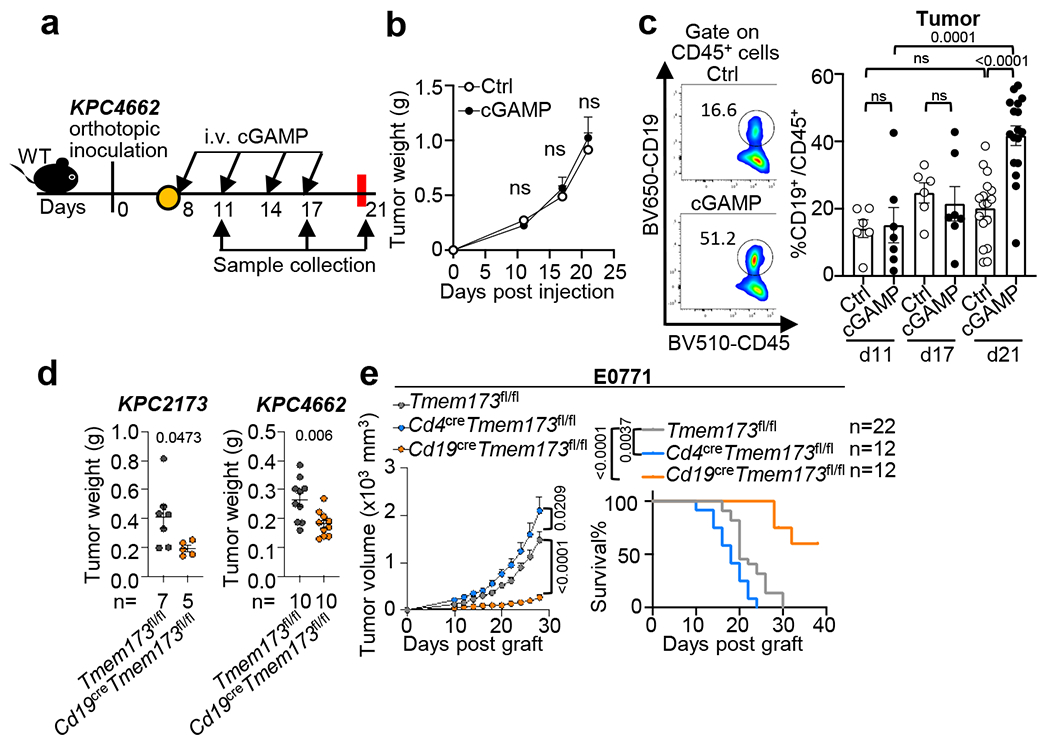
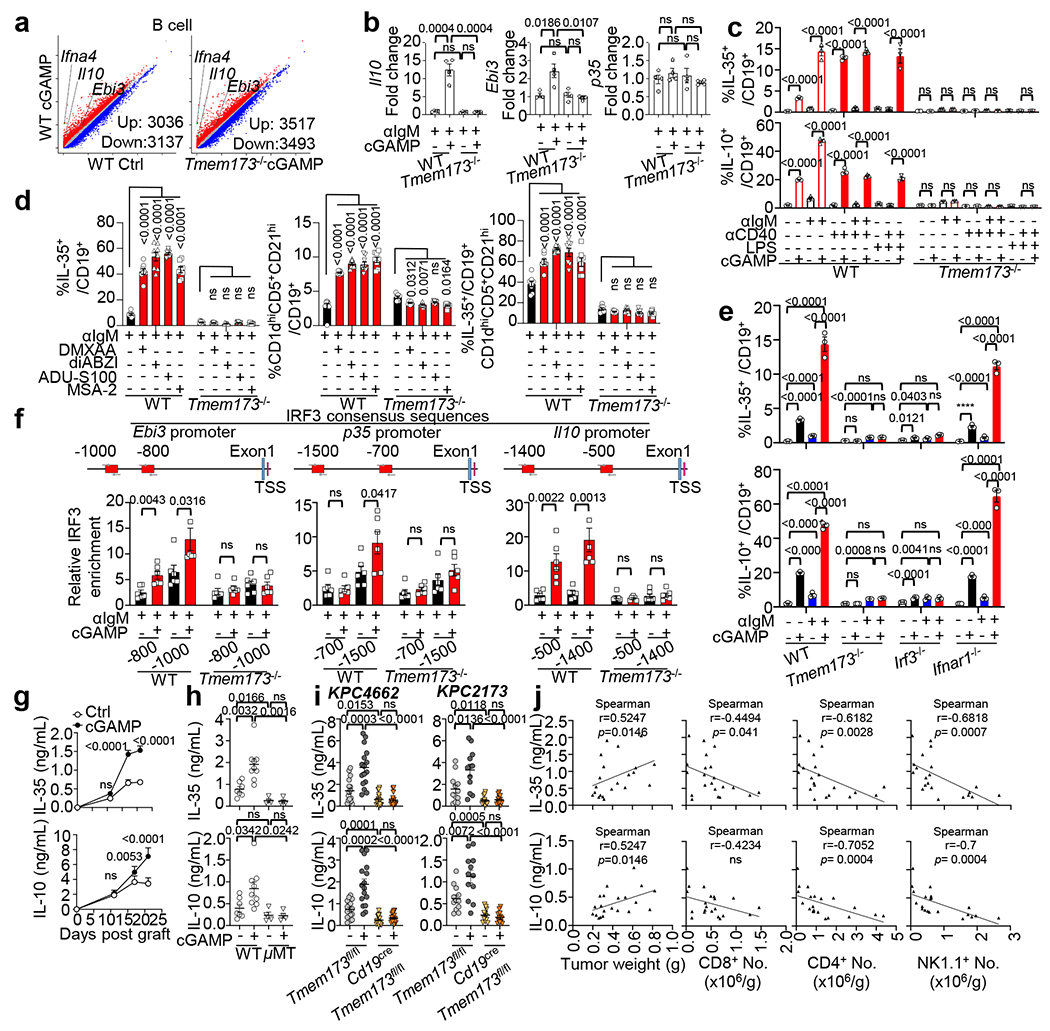
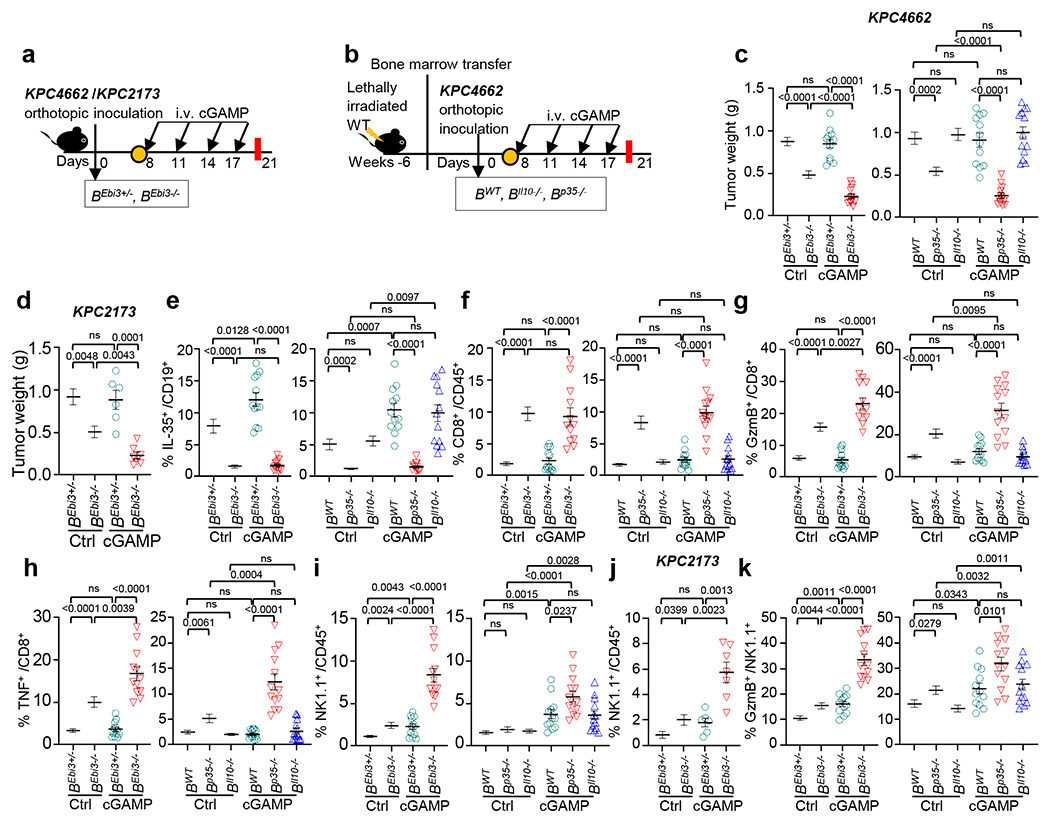
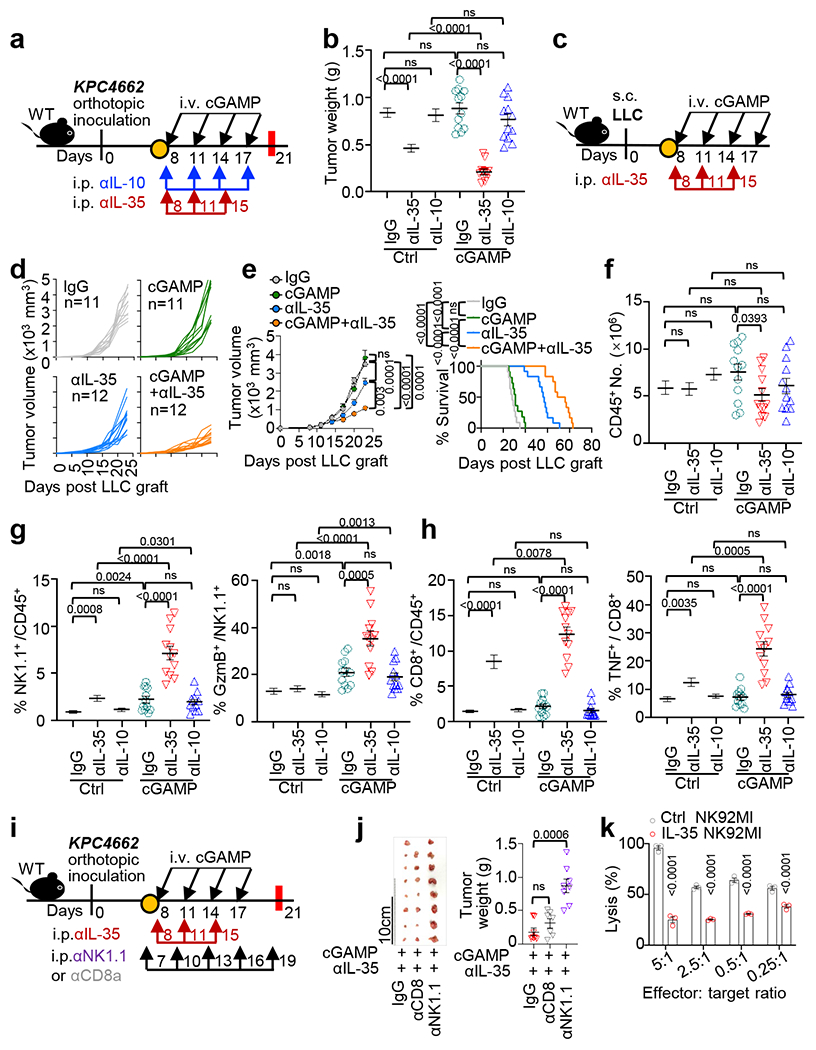
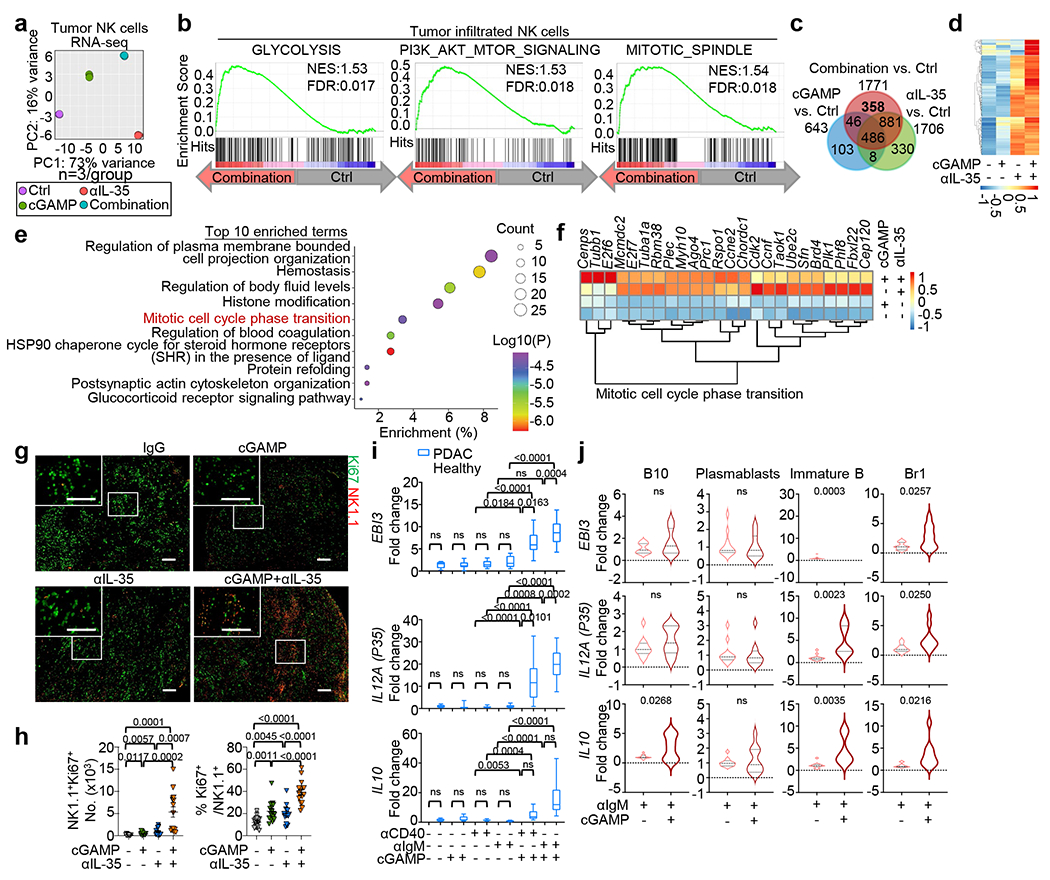
An immunosuppressive tumour microenvironment is a major obstacle in the control of pancreatic and other solid cancers1-3. Agonists of the stimulator of interferon genes (STING) protein trigger inflammatory innate immune responses to potentially overcome tumour immunosuppression4. Although these agonists hold promise as potential cancer therapies5, tumour resistance to STING monotherapy has emerged in clinical trials and the mechanism(s) is unclear5-7. Here we show that the administration of five distinct STING agonists, including cGAMP, results in an expansion of human and mouse interleukin (IL)-35+ regulatory B cells in pancreatic cancer. Mechanistically, cGAMP drives expression of IL-35 by B cells in an IRF3-dependent but type I interferon-independent manner. In several preclinical cancer models, the loss of STING signalling in B cells increases tumour control. Furthermore, anti-IL-35 blockade or genetic ablation of IL-35 in B cells also reduces tumour growth. Unexpectedly, the STING-IL-35 axis in B cells reduces proliferation of natural killer (NK) cells and attenuates the NK-driven anti-tumour response. These findings reveal an intrinsic barrier to systemic STING agonist monotherapy and provide a combinatorial strategy to overcome immunosuppression in tumours.


Conflict of interest statement

Conflict of Interest

The authors have declared that no conflict of interest exists.

Figures

Extended Data Fig. 1 |
Extended Data Fig. 1 |. Effect of the cGAS-STING pathway on immune cell profiles and tumour growth.
a, Representative images of mouse tumours from Fig. 1a. b, Number of tumoral CD45+ leukocytes from mice as treated in Fig. 1a (n=6 for Ctrl at d11 and d17, n=7 for cGAMP-treated groups at d11 and d17, n=9 for groups at d21). c, Number of splenic CD45+ leukocytes from mice in b. d, Number of tumoral CD19+ B cells in cGAMP or PBS groups from mice in e in b. e, Frequency (left) and number (right) of splenic CD19+ B cells among CD45+ cells from mice as treated in Fig. 1a (n=6 for Ctrl at d11 and d17, n=7 for cGAMP-treated groups at d11 and d17, n=17 (left) or 9 (right) for d21 groups). f, Frequency of tumoral CD11b+ and CD8+ cells among CD45+ cells (top); frequency and cell number of tumoral CD45+CD4+ cells (bottom). g, Left, LLC tumour growth in Cd19cre Tmem173fl/fl (n=12), Cd4cre Tmem173fl/fl (n=7) or Tmem173fl/fl (n=9) mice. Right, B16-ova cells were s.c. injected in Cd19cre Tmem173fl/fl (n=8) or Tmem173fl/fl (n=11) mice. Poly(I:C)-ova vaccine was administered at d6. Tumour growth was monitored. h, Realtime PCR revealed Ifnb1 and Ifna4 mRNA levels in KPC4662 at 12 hr post cGAMP treatment (n=3 per group). i, IFN-β in the KPC4662 cell culture supernatants at 24 hr post cGAMP treatment as detected by ELISA. j, Cell viability percentage of KPC4662 at 24 hr post cGAMP treatment as detected by MTT assay (n=3 for Ctrl, n=4 for cGAMP-treated group). Data are the combination of two independent experiments (Extended Data Fig. 1b–e) or a representative experiment (Extended Data Fig. 1a, f–j). Mean ± s.e.m. is shown, with each symbol representing an individual animal. Unpaired two-tailed Student’s t tests was performed for statistical analysis. P values indicated; ns, not significant.
Extended Data Fig. 2 |
Extended Data Fig. 2 |. Molecular profiles of cGAMP-treated B cells and the effect of STING agonists on B cells.
a, Immunoblot analysis of STING pathway components and β-actin in WT and Tmem173−/− B cells stimulated with anti-IgM +/− cGAMP. b, KEGG enrichment of upregulated DEGs in cGAMP-treated WT B cells vs. untreated WT B cells and cGAMP-stimulated Tmem173−/− B cells. c, GSEA analysis of RNAseq data. Normalized Enrichment Score (NES) plot of top10 gene sets enriched in the cGAMP-treated WT B cells. d, GSEA of RNAseq data shows enrichment of “interferon alpha response” (left) and “inflammatory response” pathways (right). e, Heat map of “inflammatory response pathway” genes in cGAMP-treated WT and Tmem173−/− B cells identified increased Ebi3 and Il10 expression (arrowheads). f, Heat map of IL-12 family subunit genes in cGAMP vs. PBS-treated WT and Tmem173−/− B cells. g, Real-time PCR of Ifna4 and Ifnb1 in B cells (n=4 per group) with Actb as the internal control. h, Representative histograms of EBI3 (top, left) and p35 (top, right) induced by cGAMP and analyzed by flow cytometry. Frequency of IL-35+ among CD19+ B cells treated with anti-IgM +/− cGAMP (bottom); n=4 per group. Green, fluorescence minus one control (FMO). i, Left, IL-10 in anti-IgM/cGAMP-treated B cell supernatants. CD1dhiCD5+CD21hi Bregs among CD19+ B cells (middle). IL-35+ cells among CD1dhiCD5+CD21hi Bregs (right); n=4 per group. j, Representative histograms (top) and gMFI plots (bottom) showing abundance of CD19+IL-35+ (pink), CD19+IL-35 (green) and total live CD19+ (dark gray) splenic B cells (top) in response to cGAMP. Light gray shadow represents FMO (n=4 per group). k, Frequency of IL-10+ (top) among live CD19+ B cells and IL-10+ cells among CD1dhiCD5+CD21hi Bregs (bottom) treated with four different STING agonists. WT and Tmem173−/− splenic B cells were studied as in Fig. 2d. l, Orthotopic pancreatic tumour model experimental schematic, tumour weight and frequency of tumoral and splenic CD19+IL-35+ B cells, EBI3 and p35 MFI, CD19+IL-35 B cell frequency of splenic CD19+ B cells in KPC4662 bearing mice treated with DMXAA or diABZI. m, IL-35+ (top) and IL-10+ (bottom) cells among CD19+ B cells sorted from KPC4662 tumours after anti-IgM +/− cGAMP. n, Representative histograms (top, left) and quantification (top, right) of proliferating intratumoral CFSE+ (splenic) or Cell Trace Violet (CTV, peritoneal) labelled B cells. The frequency of Breg cells (bottom, left) and expression of immunosuppressive IL-35 (EBI3) and IL-10 cytokines (bottom, right) by CFSE+ splenic or CTV+ peritoneal Breg cells. n=9 per group. o, IL-35 (top) and IL-10 (bottom) levels in spleens from samples described in Fig. 1a (n=12 per group). p, IL-35 (top) and IL-10 (bottom) levels in spleens from cGAMP-treated KPC4662 (left) (n=16) or KPC2173 (right) (n=12) bearing mice at d21. Representative of three (Extended Data Fig. 2g–k) or two (Extended Data Fig. 2a, l–m) independent experiments or combined two experiments (Extended Data Fig. 2n–p) is shown. For RNAseq, n=3 replicates/group. Mean ± s.e.m. with each symbol representing an individual animal. Unpaired two-tailed Student’s t tests (Extended Data Fig. 2g, l–p), unpaired two-tailed Student’s t tests for AUC (Extended Data Fig. 2j), one-way ANOVA (Extended Data Fig. 2h, i) and two-way ANOVA (Extended Data Fig. 2k) were performed. P values indicated; ns, not significant.
Extended Data Fig. 3 |
Extended Data Fig. 3 |. Differential effects of cGAMP on IL-35 and IL-10 induction are compared in B and T cells.
a, Representative histograms of EBI3 (left), p35 (middle) and IL-10 (right) with geometric mean fluorescence intensity (gMFI) are shown. B and T cells were sorted from spleens of KPC4662 tumour-bearing or non-tumour bearing mice. B cells were stimulated with anti-IgM. T cells were stimulated with anti-CD3 and anti-CD28. Cells were treated with or without cGAMP and analyzed by flow cytometry analysis at 24 hr post treatment. b, Quantification of the percentages of IL-35+ (top) and IL-10+ (bottom) cells in live CD19+ B cells and CD3+ T cells (n=4, representative of two independent experiments). c, Treg(Ebi3+/−) and Treg(Ebi3−/−) mice orthotopically inoculated with KPC4662 cells and treated with cGAMP. Representative images of tumours (left) and tumour weights (right) at d21 are shown (n=8 Ctrl PBS, n=8 Ctrl cGAMP, n=9 Treg(Ebi3−/−) PBS, n=9 Treg(Ebi3−/−) cGAMP). Representative of two replicate studies (Extended Data Fig. 3a–c) are shown, with each symbol representing an individual animal and mean ± s.e.m. denoted. Statistical tests of two-way ANOVA (Extended Data Fig. 3b) and unpaired two-tailed Student’s t tests (Extended Data Fig. 3c) were performed. P values indicated; ns, not significant.
Extended Data Fig. 4 |
Extended Data Fig. 4 |. Immune profiling of pancreatic tumour-bearing B cell-specific IL-35 or IL-10 ablation mice.
a, Mixed bone marrow chimeras containing B cell–specific deletion of p35 (B(p35−/−)) or Il10 (B(Il10−/−)) with WT (B(WT)) controls were generated (top) with expected cell phenotypes shown (bottom). b, Validation of loss of p35 and Il10 in B cells from B(p35−/−) and B(Il10−/−) mice. Genomic DNA was isolated from CD19+ B cells, CD3+ T cells and CD19, CD3 cells (non-T or B cells). Genomic DNA samples from tails of WT, p35−/− and Il10−/− mice were used as controls. Actb was used as the internal control. c, Number of total tumoral CD45+ leukocytes from KPC4662 bearing cGAMP− and control PBS-treated mice as in Fig. 3c. d, Frequency of tumoral IL-35 producing CD4+ T cells from mice as in Fig. 3c. e, Frequency of tumoral IL-10 producing CD4+ T cells from mice as in Fig. 3c. f, Frequency of tumoral IL-35 producing non-T, B cells from mice as in Fig. 3c. g, Frequency of tumoral IL-10 producing non-T, B cells from mice as in Fig. 3c. h, Frequency of tumoral TNF secreting CD4+ T cells from mice as in Fig. 3c. i, Frequency of tumoral IFNγ secreting CD4+ T cells from mice as in Fig. 3c. j, Frequency of tumoral CD4+Foxp3+ Treg cells from mice as in Fig. 3c. Samples analyzed in Extended Data Fig. 4c–j are described in Fig. 3a,b. Representative experiments (Extended Data Fig. 4b) or a combination of three independent experiments (Extended Data Fig. 4c–j) are shown, with each symbol representing an individual animal and mean ± s.e.m. denoted. Unpaired two-tailed Student’s t tests were performed (Extended Data Fig. 4c–j) for statistical analysis. P values indicated; ns, not significant.
Extended Data Fig. 5 |
Extended Data Fig. 5 |. Anti-IL-35 synergizes with cGAMP to restrain tumour growth and enhance overall survival in the B16-ova melanoma mouse model.
a, B16-ova tumour-bearing mice were vaccinated with poly(I:C)-ova on d6, followed by i.v. administration with cGAMP (n=11), i.p. injection of anti-IL-35 (n=12) or IgG (n=11) or cGAMP+anti-IL-35(n=12) on indicated timepoints. Mice were monitored for tumour growth (b, c) and survival (d). A combination of three independent experiments is shown. Mean ± s.e.m. is shown. Unpaired two-tailed Student’s t tests and Log-rank (Mantel-Cox) test were performed for statistical analyses. P values indicated; ns, not significant.
Extended Data Fig. 6 |
Extended Data Fig. 6 |. Immune cells of combination anti-IL-35- plus cGAMP-treated tumours are examined.
All samples analyzed were obtained from KPC4662 tumour-bearing mice that were injected with cGAMP or PBS control in combination with anti-IL-10, anti-IL-35 or control IgG as depicted in Fig. 4a. a, Frequency (left) and number (right) of tumoral IL-35 producing CD19+ B cells in Fig. 4b. b, Number of tumoral CD45+NK1.1+ cells (left) and NK1.1+ cells expressing GzmB (right) as noted in Fig. 4b. c, Number of tumoral CD45+CD8+ cells (left) and CD8+ T cells expressing TNF (right) as noted in Fig. 4b. d, Frequency (left) and number (right) of tumoral CD8+ T cells expressing GzmB from mice as in Fig. 4b. e, Frequency (left) and number (right) of tumoral CD8+ T cells expressing IFNγ from mice as in Fig. 4b. f, Frequency of tumoral CD45+CD4+CD25 T effector cells from mice as in Fig. 4b. g, Frequency of tumoral CD4+ T cells expressing TNF (left) or IFNγ (right) from mice as in Fig. 4b. h, Frequency of tumoral CD4+Foxp3+ Treg cells from mice as in Fig. 4b. A combination of three experiments (Extended Data Fig. 6a–h) are shown. Mean ± s.e.m. is shown. Unpaired two-tailed Student’s t tests were performed for statistical analysis. P values indicated; ns, not significant.
Extended Data Fig. 7 |
Extended Data Fig. 7 |. Immune profiles of combination cGAMP+anti-IL-35 treated tumours are examined.
All samples analyzed were obtained from KPC4662 tumour-bearing mice that were injected with cGAMP or PBS in combination with anti-IL-35 or control IgG as depicted in Fig. 4a. a, H&E, immunohistochemistry with the indicated markers and Sirius red staining of sections from groups as described in Fig. 4a (Scale bars, 100 μm.). b, The frequency of cleaved caspase-3+ in cytokeratin 8+ cells as shown in (a), n=15 per group. c, The number of NK1.1+ cells as shown in (a), n=12 per group. d, The quantification of collagen deposition depicted by Sirius red staining in sections as shown in (a), n=15 per group. e, Real-time PCR results revealed the expression of fibrosis markers Acta2 (αSMA) and Col3a1 in tumour homogenates of indicated groups; n=3 per group. Actb was used as the internal control. A combination of two (Extended Data Fig. 7a–d) or representative of two independent experiments (Extended Data Fig. 7e) are shown. Mean ± s.e.m. is shown, Unpaired two-tailed Student’s t tests was performed for statistical analysis. P values indicated; ns, not significant.
Extended Data Fig. 8 |
Extended Data Fig. 8 |. Dual therapy of cGAMP plus anti-IL-35 depends on TRAIL mediated NK cytotoxity.
a, The efficiency of specific antibody depletion of CD8+ or NK1.1+ cells in spleens from treated mice (n=8 for IgG and anti-NK1.1 groups, n=7 for anti-CD8 group). b, Flow cytometric analysis of TRAIL, shown as MFI, on tumoral NK1.1+ cells in response to IL-35 with IL-15 stimulation for 24 hr (n=5 for Ctrl, n=4 for IL-35-stimulated group). c, Experimental schematic: LLC bearing mice received cGAMP (i.v.) and anti-IL-35 (i.p.) with anti-TRAIL (i.t.). d, Tumour growth of mice described in (c). e, Survival curve of mice described in (c). A representative of two independent experiments is shown for all panels. Mean ± s.e.m. is shown. Unpaired two-tailed Student’s t tests (Extended Data Fig. 8a, b), unpaired two-tailed Student’s t tests for AUC and Log-rank (Mantel-Cox) test (Extended Data Fig. 8d, e) were performed for statistical analysis. P values indicated; ns, not significant.
Extended Data Fig. 9 |
Extended Data Fig. 9 |. RNAseq analysis of tumoral NK cells from KPC tumour-bearing mice under mono or dual therapy of cGAMP+anti-IL-35.
a, GSEA analysis of RNAseq of tumoral NK cells. Normalized Enrichment Score (NES) plot of top 20 hallmark signature gene sets enriched in combination cGAMP+anti-IL-35 vs. Ctrl treated NK cells. b, GSEA showing the enrichment of “interferon alpha response” in tumoral NK cells isolated from mice treated with cGAMP+anti-IL-35 vs. Ctrl NK cells as noted in (a). c, Heatmap of “mitotic spindle pathway” genes in NK cells isolated from animals treated with cGAMP+anti-IL-35 vs untreated Ctrl NK cells. d, Venn diagram showing down-regulated DEGs in combination cGAMP+anti-IL-35, cGAMP or anti-IL-35 vs. Ctrl groups.
Extended Data Fig. 10 |
Extended Data Fig. 10 |. Human pancreatic cancer Breg signatures are associated with STING signaling or activated NK cell signature.
a, Correlations of EBI3 (top), IL12A (P35) (middle) or IL10 (bottom) with TMEM173 expression in TCGA-PAAD patient samples (n=183). b, Real-time PCR assessment of EBI3 (top), IL12A (middle) and IL10 (bottom) transcript levels in B10 cells, plasmablasts, immature B cells and Br1 cells sorted from pancreatic cancer patients and healthy donors (n=10) and stimulated with anti-CD40 +/− cGAMP. HPRT was used as the internal control. c, Correlation of Breg signature to ISG signature or activated NK cell index in TCGA PAAD (n=183) patient samples. d, Correlation of Breg signature to ISG signature or activated NK cell index in TCGA LUAD (n=595) patient samples. e, Model illustrating the effect of STING agonist on IL-35 production by Breg cells through an IRF3-dependent pathway, which suppresses NK cell function in controlling pancreatic cancer. The graphical illustration was made using BioRender (https://biorender.com/). Spearman correlation (Extended Data Fig. 10a, c, d) and Unpaired two-tailed Student’s t tests (Extended Data Fig. 10b) were performed. The shaded gray region indicates the 95% confidence bands of the fit, as shown in Extended Data Fig. 10c, d. P values indicated; ns, not significant.
Fig. 1 |
Fig. 1 |. Inhibition of STING signaling in B cells improves tumor growth control in multiple models.
a, Workflow of the orthotopic pancreatic tumor model and treatment. WT mice were injected with KPC4662 tumor cells on Day 0 (d0) and i.v. injected with cGAMP or PBS at indicated timepoints. Tumors were harvested as indicated. b, Tumor weights at indicated timepoints (n=6 for control(Ctrl) at d11 and d17, n=7 for Ctrl at d21, n=7 for cGAMP-treated groups at d11 and d17, n=8 cGAMP-treated group at d21). c, Representative scatterplots (left) and frequency (right) of intratumoral CD19+ B cells among CD45+ cells (n=6 for Ctrl d11 and d17, n=7 for both cGAMP-treated groups d11 and d17, n=17 for both Ctrl and cGAMP-treated groups at d21). d, Tumor weights at d21 from Cd19cre Tmem173fl/fl or Tmem173fl/fl mice bearing KPC2173 (left) or KPC4662 (right) tumors (KPC2173, n=5 Cd19cre Tmem173fl/fl mice and n=7 Tmem173fl/fl; KPC4662, n=10 Cd19cre Tmem173fl/fl and Tmem173fl/fl mice). e, Tumor growth (left) and survival curves (right) in E0771-bearing Cd19cre Tmem173fl/fl, Cd4cre Tmem173fl/fl or Tmem173fl/fl mice. Data represent two (b-d) or three (e) independent experiments with symbols for individual mice and mean ± s.e.m. (d) shows a representative experiment. Statistical significance was determined by two-way ANOVA (b), unpaired two-tailed Student’s t tests (c-d), unpaired two-tailed Student’s t test for area under the curve (AUC) and log-rank (Mantel-Cox) test (e). P values indicated; NS, not significant.
Fig. 2 |
Fig. 2 |. STING activation contributes to the expansion of IL-35+ and IL-10+ Breg cells.
a, Scatterplots of DEGs in cGAMP-treated vs. untreated WT (left) or cGAMP-treated Tmem173−/− B cells (right) (data adjusted P<0.05; red, upregulated genes; blue, downregulated genes). b, Realtime PCR for Il10, Ebi3 and p35 mRNA in B cells; n=4 per group. c, Percent of IL-35+ or IL-10+ in CD19+ splenic B cells by flow cytometry. d, Percent of IL-35+ B cells (left), Breg cells (middle) and IL-35+ cells among Breg cells (right) stimulated by different STING agonists in WT and Tmem173−/− splenic B cells. e, IL-35+ (top) and IL-10+ (bottom) cells among CD19+ B cells from indicated mice. f, Relative enrichment of IRF3 by ChIP analysis on Ebi3 (left), p35 (middle) and IL-10 (right) promoters in anti-IgM+/−cGAMP treated B cells from WT or Tmem173−/− mice. IRF3 consensus sequences are shown as red rectangles. g, IL-35 (top) and IL-10 (bottom) levels in KPC4662 tumors from samples in Fig. 1a (n=11 per Ctrl group, n=12 per cGAMP group). h, IL-35 (top) and IL-10 (bottom) levels in tumour homogenates at d21 (n=7 WT Ctrl, n=9 WT cGAMP-treated group, n=4 μMT Ctrl and μMT cGAMP-treated groups). i, IL-35 (top) and IL-10 (bottom) levels in tumors from cGAMP-treated KPC4662 (left, n=16) or KPC2173 bearing mice (right, n=12) at d21. j, Correlation of tumor IL-35 (top) and IL-10 (bottom) protein with tumour weights(left) and the number of intratumoral CD8 (column 2), CD4 (column 3) and NK1.1 (right) cells (n = 21). Data represent three independent experiments for all panels except for (j) (two experiments); mean ± s.e.m. Statistical significance was determined by unpaired two-tailed Student’s t tests (b, f, h, i), Spearman correlation (j) and two-way ANOVA (c, d, e, g). P values indicated; NS, not significant .
Fig. 3 |
Fig. 3 |. IL-35 ablation in B cells synergizes with STING agonist to modulate NK cell activity.
a, Workflow of the pancreatic tumor modeling and treatment. B(Ebi3−/−) mice and B(Ebi3+/−) mice were orthotopically injected with KPC4662 or KPC2173 tumor cells and given cGAMP. b, Bone marrow reconstituted chimeric mice with B cell-specific deficiency in Il10 or p35 were orthotopically injected with KPC4662 tumor cells and treated with cGAMP (i.v.) every three days beginning on d8, with tumors harvested on d21. c, Weights of KPC4662 tumors from cGAMP− and PBS-treated B(Ebi3+/−) and B(Ebi3−/−) mice (left) and B(WT), B(Il10−/−) and B(p35−/−) chimeric mice (right) harvested on d21 (n=11 for Ctrl B(Ebi3+/−) and Ctrl B(Ebi3−/−), n=12 for cGAMP-treated B(Ebi3+/−) and cGAMP-treated B(Ebi3−/−), n=12 for Ctrl and cGAMP-treated B(WT), n=13 for Ctrl and cGAMP-treated B(Il10−/−), n=13 for Ctrl and cGAMP-treated B(p35−/−)). d, Tumor weights of cGAMP− or PBS-treated B(Ebi3+/−) and B(Ebi3−/−) mice bearing KPC2173 tumor on d21 (n=6 Ctrl B(Ebi3+/−), Ctrl B(Ebi3−/−) and cGAMP-treated B(Ebi3+/−); n=7, cGAMP-treated B(Ebi3−/−)). e, Frequency of tumoral CD19+IL-35+ B cells from (c). f, Frequency of tumoral CD45+CD8+ T cells from (c). g, Frequency of tumoral CD8+ T cells expressing GzmB from (c). h, Frequency of tumoral TNF+CD8+ T cells from (c). i, Frequency of tumoral CD45+NK1.1+ cells from (c). j, Frequency of tumoral CD45+NK1.1+ cells from (d). k, Frequency of NK1.1+ cells expressing GzmB from (c). Data represent a combination of three independent experiments for all panels except for (d, j – two experiments), with each symbol representing an individual animal and mean ± s.e.m. Statistical significance was determined by unpaired two-tailed Student’s t tests. P values indicated; NS, not significant.
Fig. 4 |
Fig. 4 |. Systemic anti-IL-35 synergizes with STING agonist to potentiate NK cell efficacy.
a, Workflow of the pancreatic tumor modeling with cGAMP+anti-IL-35 or anti-IL-10 treatments. b, Tumor weights from (a) collected at d21 (n=11 for Ctrl IgG, n=12 for anti-IL-10 and anti-IL-35-treated groups with or without cGAMP). c, Schematic workflow of the LLC tumor modeling and treatment with cGAMP and/or anti-IL-35. Tumor growth (d) and survival (e) in the LLC mouse model from (c) (n=11 for IgG and cGAMP groups, n=12 for anti-IL-35 and dual therapy groups). f, Number of total intratumoral CD45+ leukocytes in mice from (b). g, Frequency of tumoral CD45+NK1.1+ cells (left) and GzmB+NK1.1+ cells (right) from (b). h, Frequency of tumoral CD45+CD8+ cells (left) and TNF+CD8+ T cells (right) from (b). i, Schematic workflow of the pancreatic tumor modeling with cGAMP and anti-IL-35 plus either anti-CD8 or anti-NK1.1 depleting antibody treatments. j, Tumor images (middle) and weights (right) at d21 in mice from (i) (n=8 for IgG and anti-NK1.1 groups, n=7 for anti-CD8 group). k, Effect of IL-35 on NK cell-mediated lysis of K562 cells assessed by the lactate dehydrogenase (LDH) cell death assay (n=3 per group). Data represent a combination of three independent replicates (b, d-h) or a representative experiment (j, k), with mean ± s.e.m. Statistical significance was determined by unpaired two-tailed Student’s t tests (b, f-h, j, k), unpaired two-tailed Student’s t tests for AUC and Log-rank (Mantel-Cox) test (e). P values indicated; NS, not significant.
Fig. 5 |
Fig. 5 |. STING agonist therapy suppresses NK cell-mediated anti-tumor responses via IL-35.
a, PCA of RNAseq results from intratumoral NK cells from Ctrl and mice(n=3 per group) treated with cGAMP, anti-IL-35 or a combination of cGAMP+anti-IL-35. b, Enrichment of “glycolysis”, “Pi3k, Akt, mTOR signaling” and “mitotic spindle” pathways in tumoral NK cells from cGAMP+anti-IL-35 vs. Ctrl groups by GSEA as noted in Extended Data Fig. 9a. c, Venn diagram of upregulated DEGs in combination cGAMP+anti-IL-35, cGAMP or anti-IL-35-treated groups vs. control. d, Heatmap showing n=358 upregulated genes noted in (c) in the Venn diagram. e, Top 10 enriched pathway terms in intratumoral NK cells from dual cGAMP+anti-IL-35-treated group in (d). f, Heatmap showing upregulated Mitotic cell cycle phase transition genes in intratumoral NK cells as noted in (e). g, Representative microscopy images of tumor sections from indicated groups as described in Fig. 4a. NK1.1+ cell (red) and Ki67+ marker (green) stainings are shown. (Scale bars, 100 μm.) h, Quantification of the data in (g); n=15 per group. i, Realtime-PCR of EBI3, IL12A and IL10 mRNA in human B cells collected from pancreatic cancer patients and healthy donors (n=15, each group) stimulated with anti-IgM +/− cGAMP. HPRT was used as the internal control. The box plots show minima, maxima and median, displaying the 10-90 percentile at the whiskers. j, EBI3, IL12A and IL10 transcript levels in B10, plasmablasts, immature B cells and Br1 cells sorted from peripheral blood of pancreatic cancer patients and healthy donors (n=10 each) and stimulated with anti-IgM +/− cGAMP. For RNAseq, each group has n=3 biological repetitions. Two experiments were combined (h) with mean ± s.e.m. Statistical significance was determined by unpaired two-tailed Student’s t tests (h-j). P values indicated; NS, not significant.

References

    1. Evans RA et al. Lack of immunoediting in murine pancreatic cancer reversed with neoantigen. JCI insight 1, doi:10.1172/jci.insight.88328 (2016). - DOI - PMC - PubMed
    1. Hegde PS & Chen DS Top 10 Challenges in Cancer Immunotherapy. Immunity 52, 17–35, doi:10.1016/j.immuni.2019.12.011 (2020). - DOI - PubMed
    1. Lutz ER et al. Immunotherapy converts nonimmunogenic pancreatic tumors into immunogenic foci of immune regulation. Cancer immunology research 2, 616–631, doi:10.1158/2326-6066.Cir-14-0027 (2014). - DOI - PMC - PubMed
    1. Cheng N et al. A nanoparticle-incorporated STING activator enhances antitumor immunity in PD-L1-insensitive models of triple-negative breast cancer. JCI insight 3, doi:10.1172/jci.insight.120638 (2018). - DOI - PMC - PubMed
    1. Amouzegar A, Chelvanambi M, Filderman JN, Storkus WJ & Luke JJ STING Agonists as Cancer Therapeutics. Cancers (Basel) 13, doi:10.3390/cancers13112695 (2021). - DOI - PMC - PubMed