. 2022 Oct;610(7932):547-554.
doi: 10.1038/s41586-022-05259-y. Epub 2022 Oct 5.

The γδ IEL effector API5 masks genetic susceptibility to Paneth cell death

Affiliations

The γδ IEL effector API5 masks genetic susceptibility to Paneth cell death

Yu Matsuzawa-Ishimoto et al. Nature. 2022 Oct.

Abstract

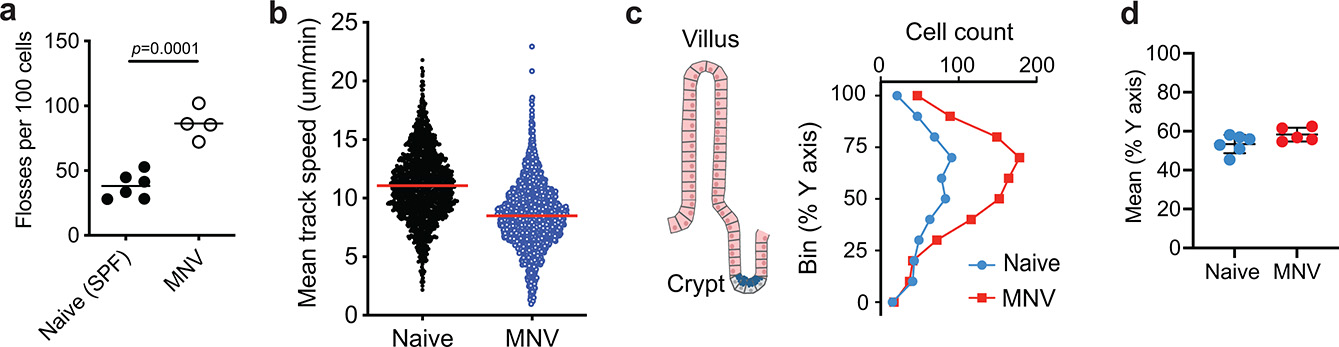
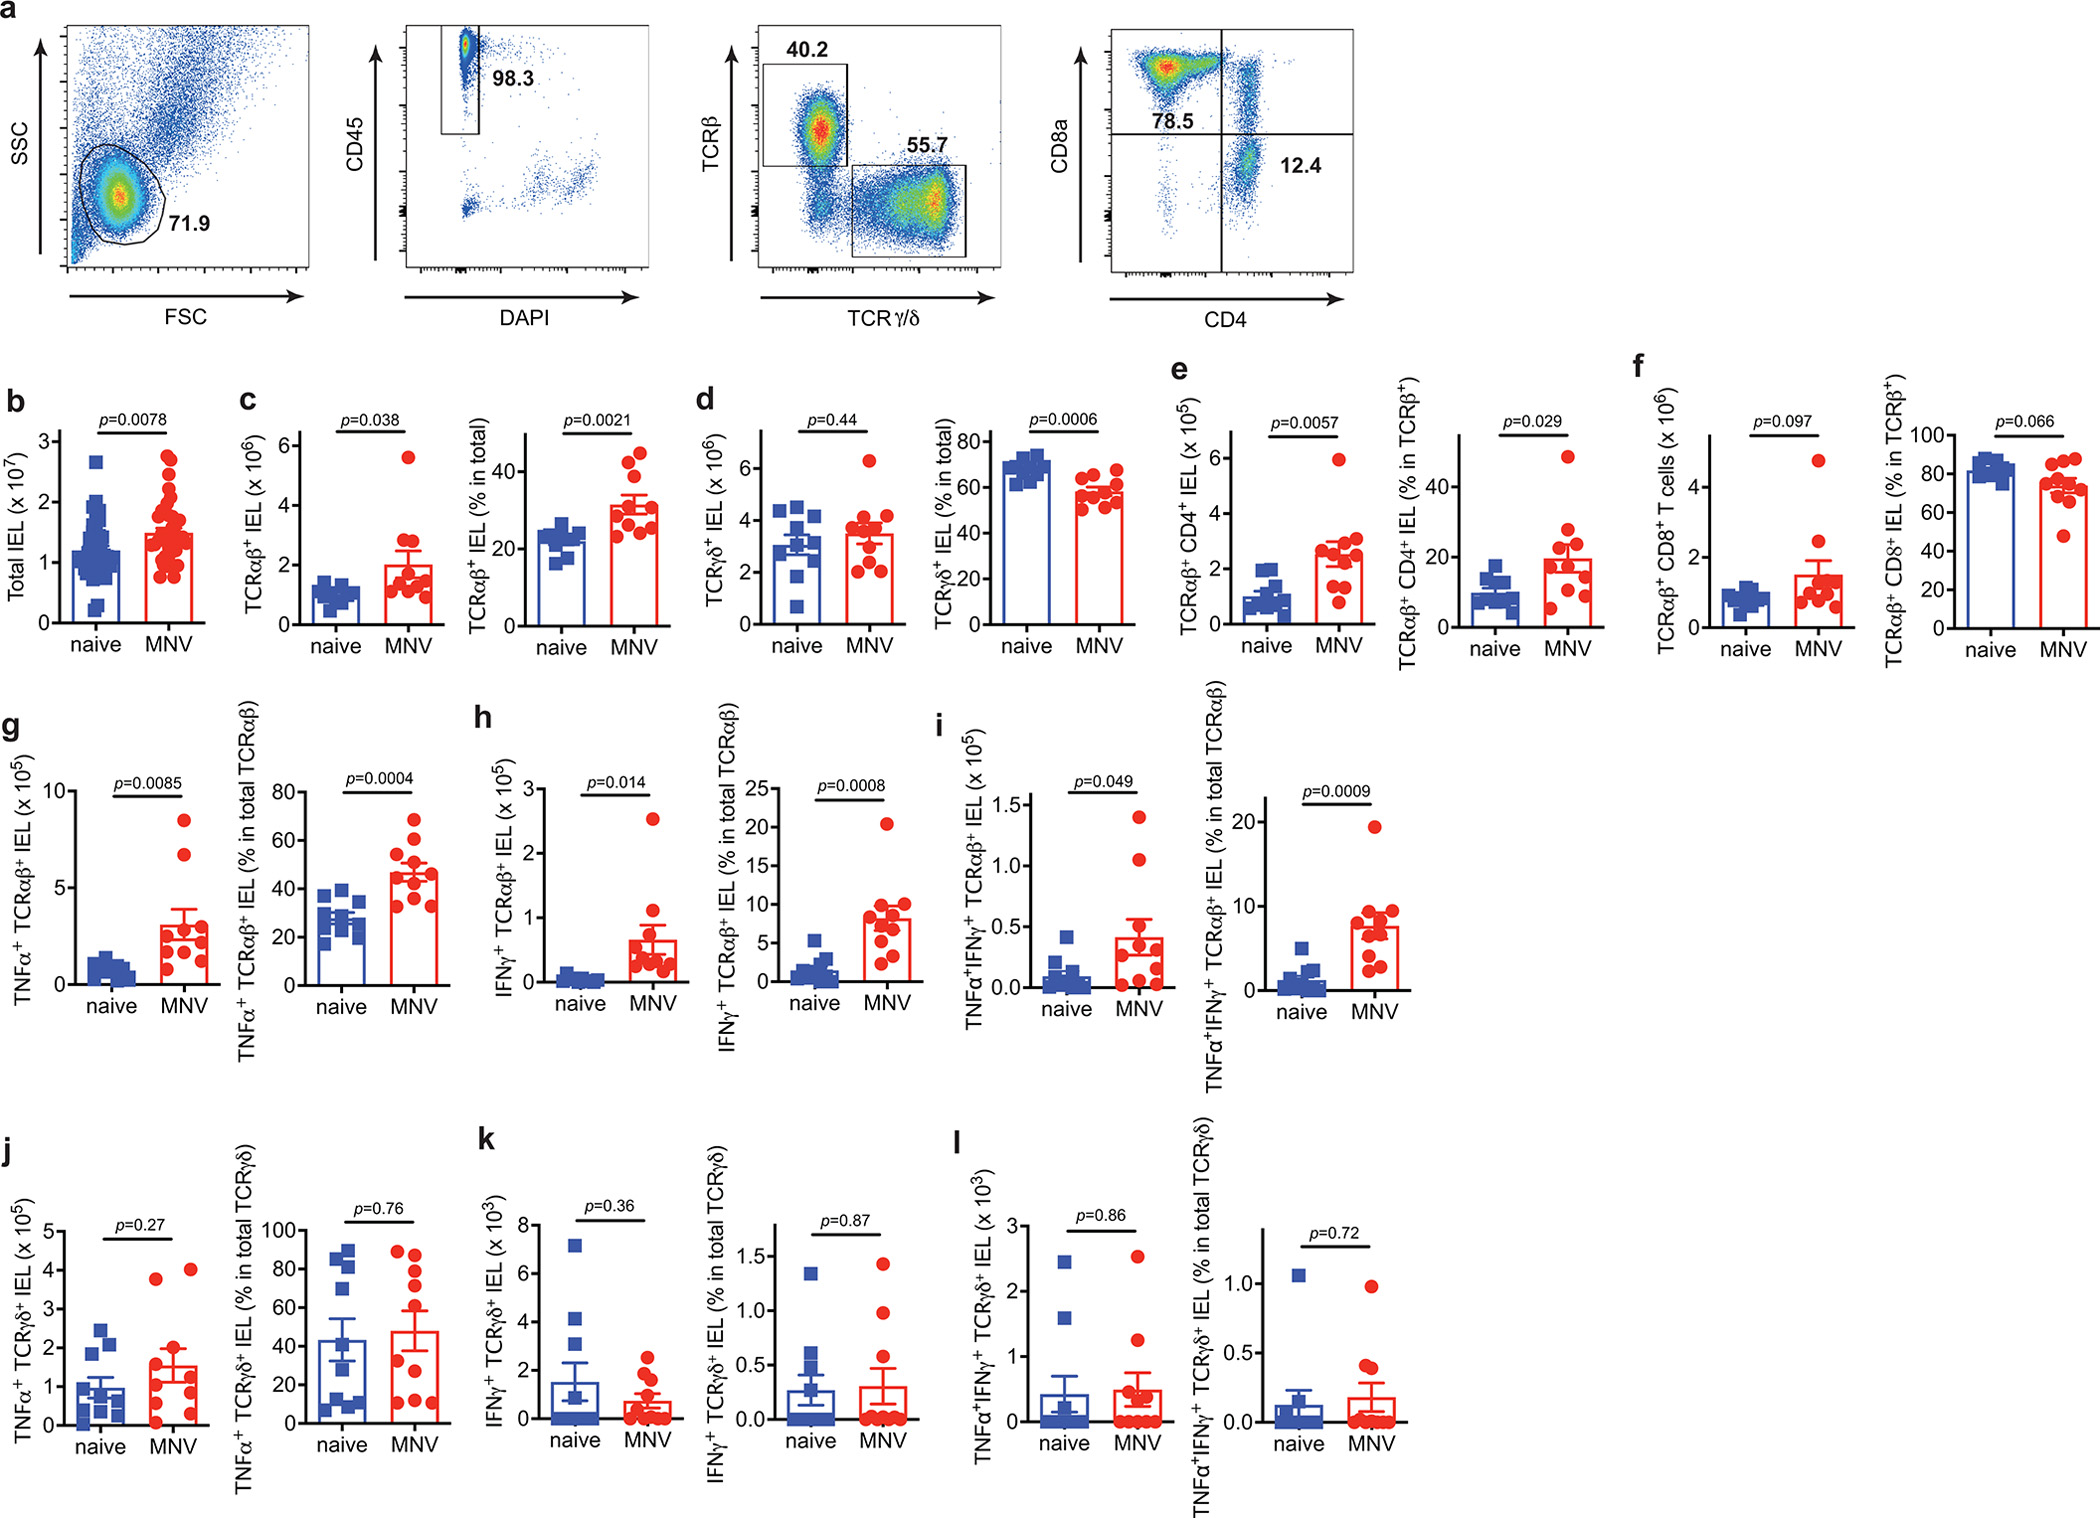
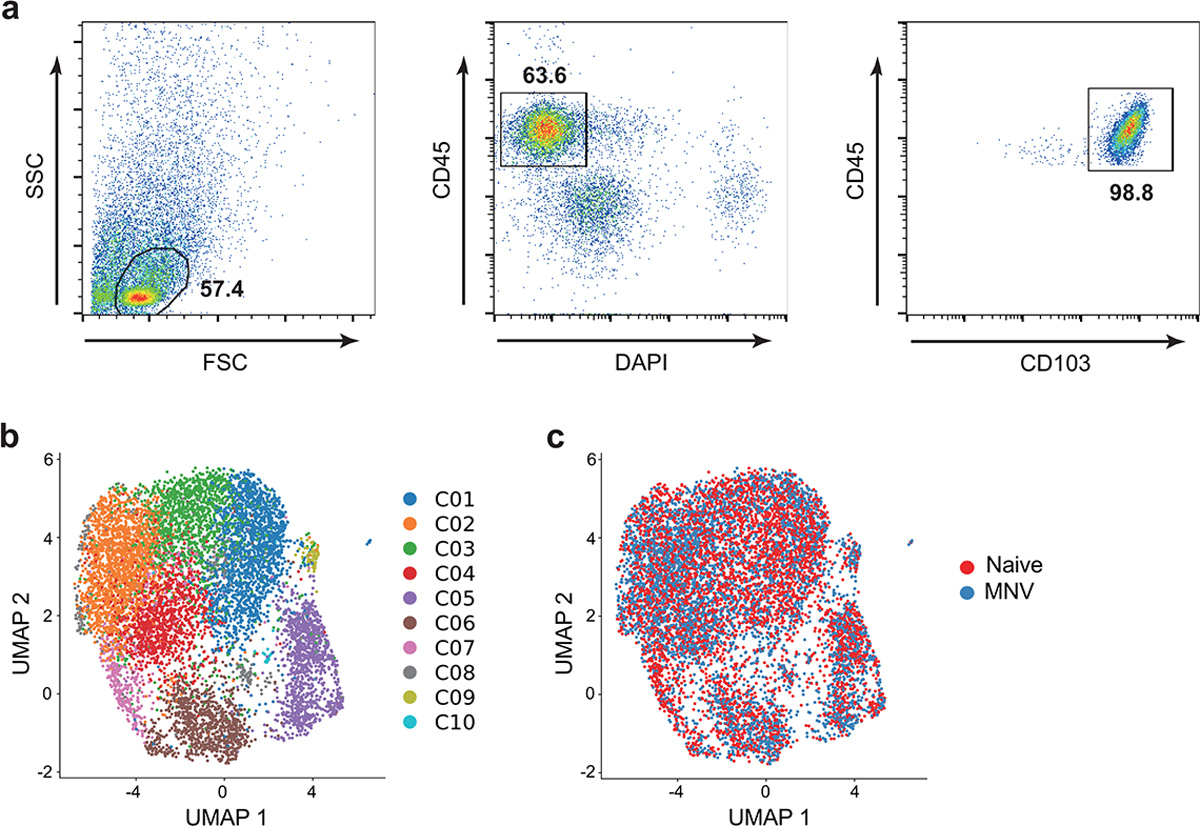
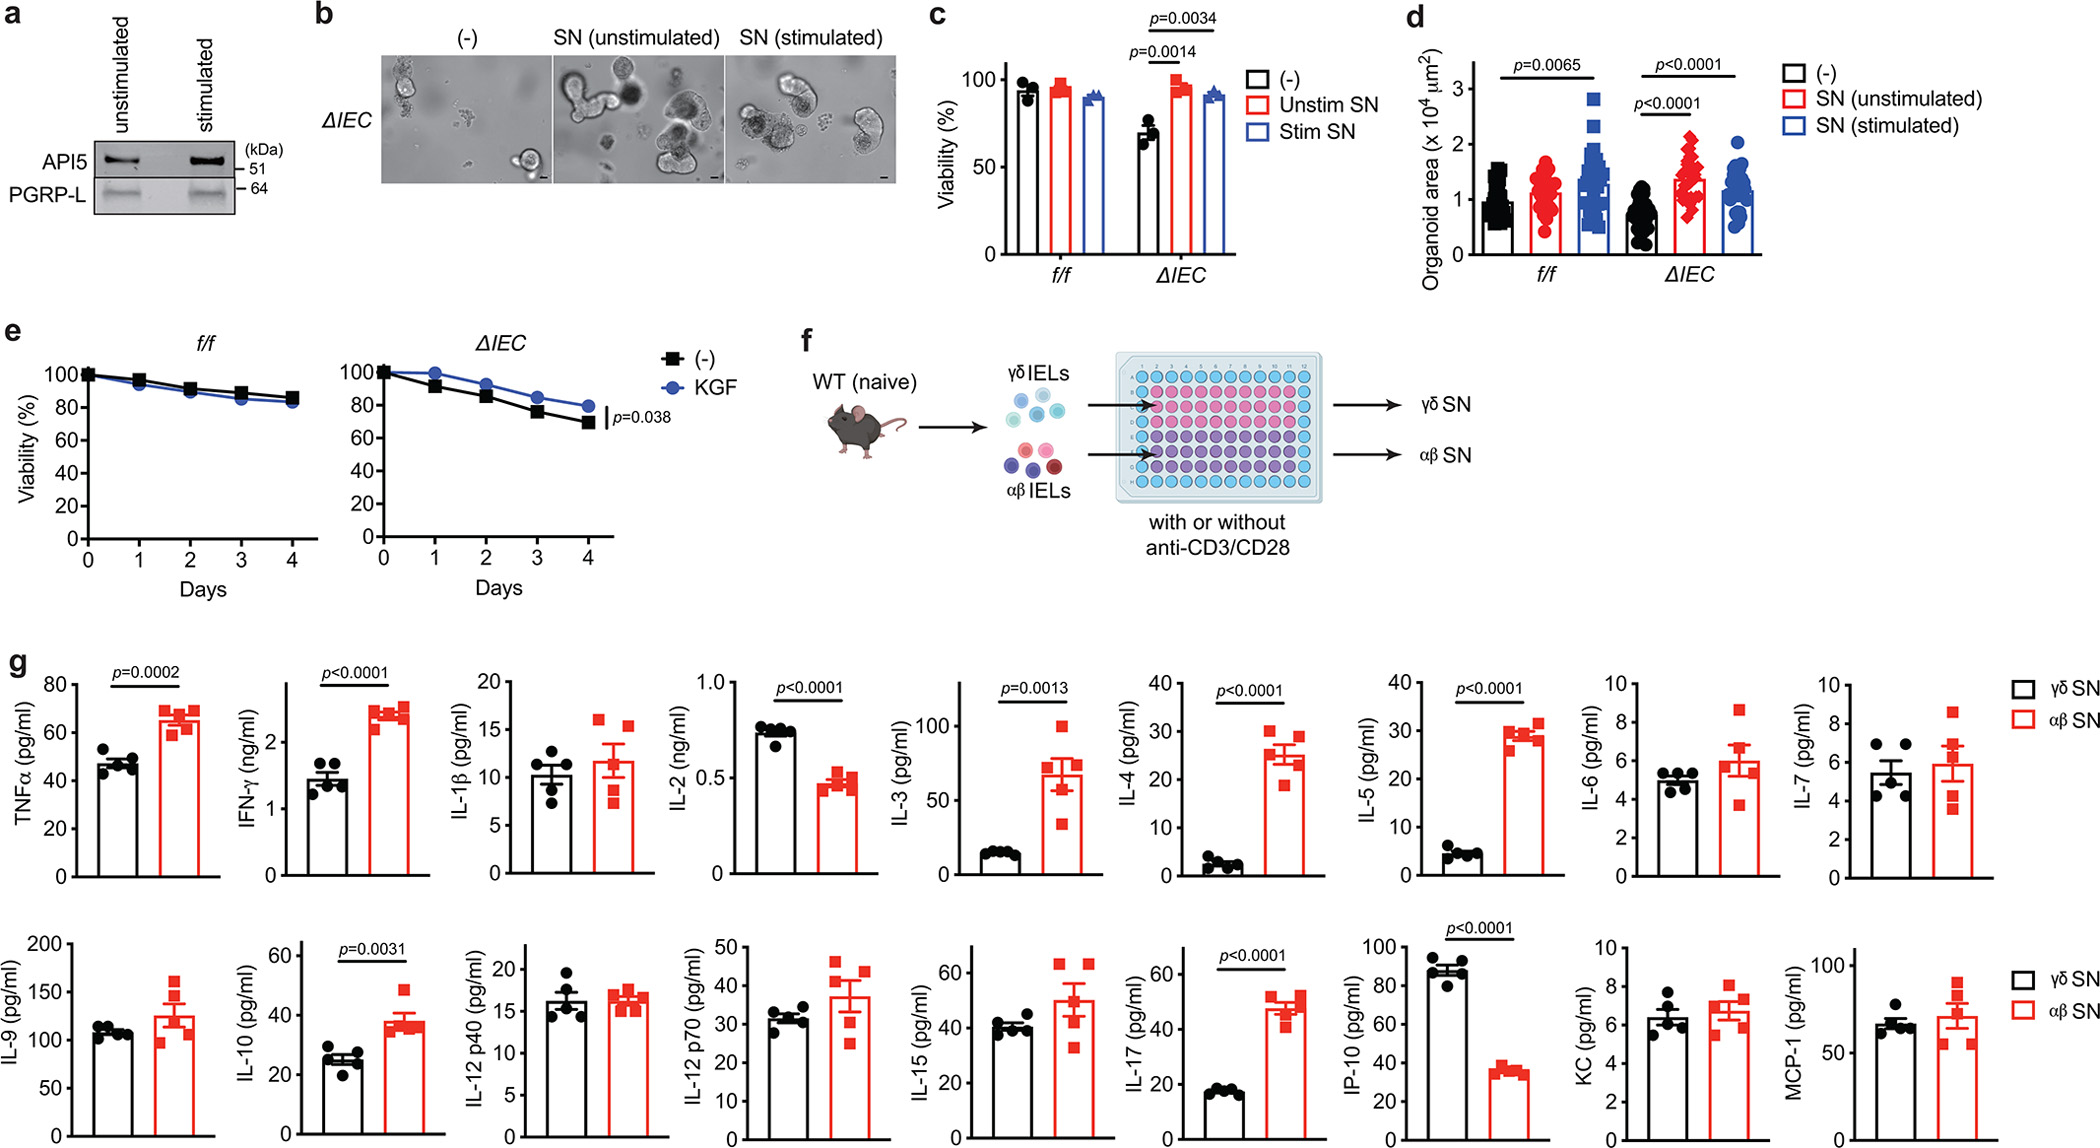
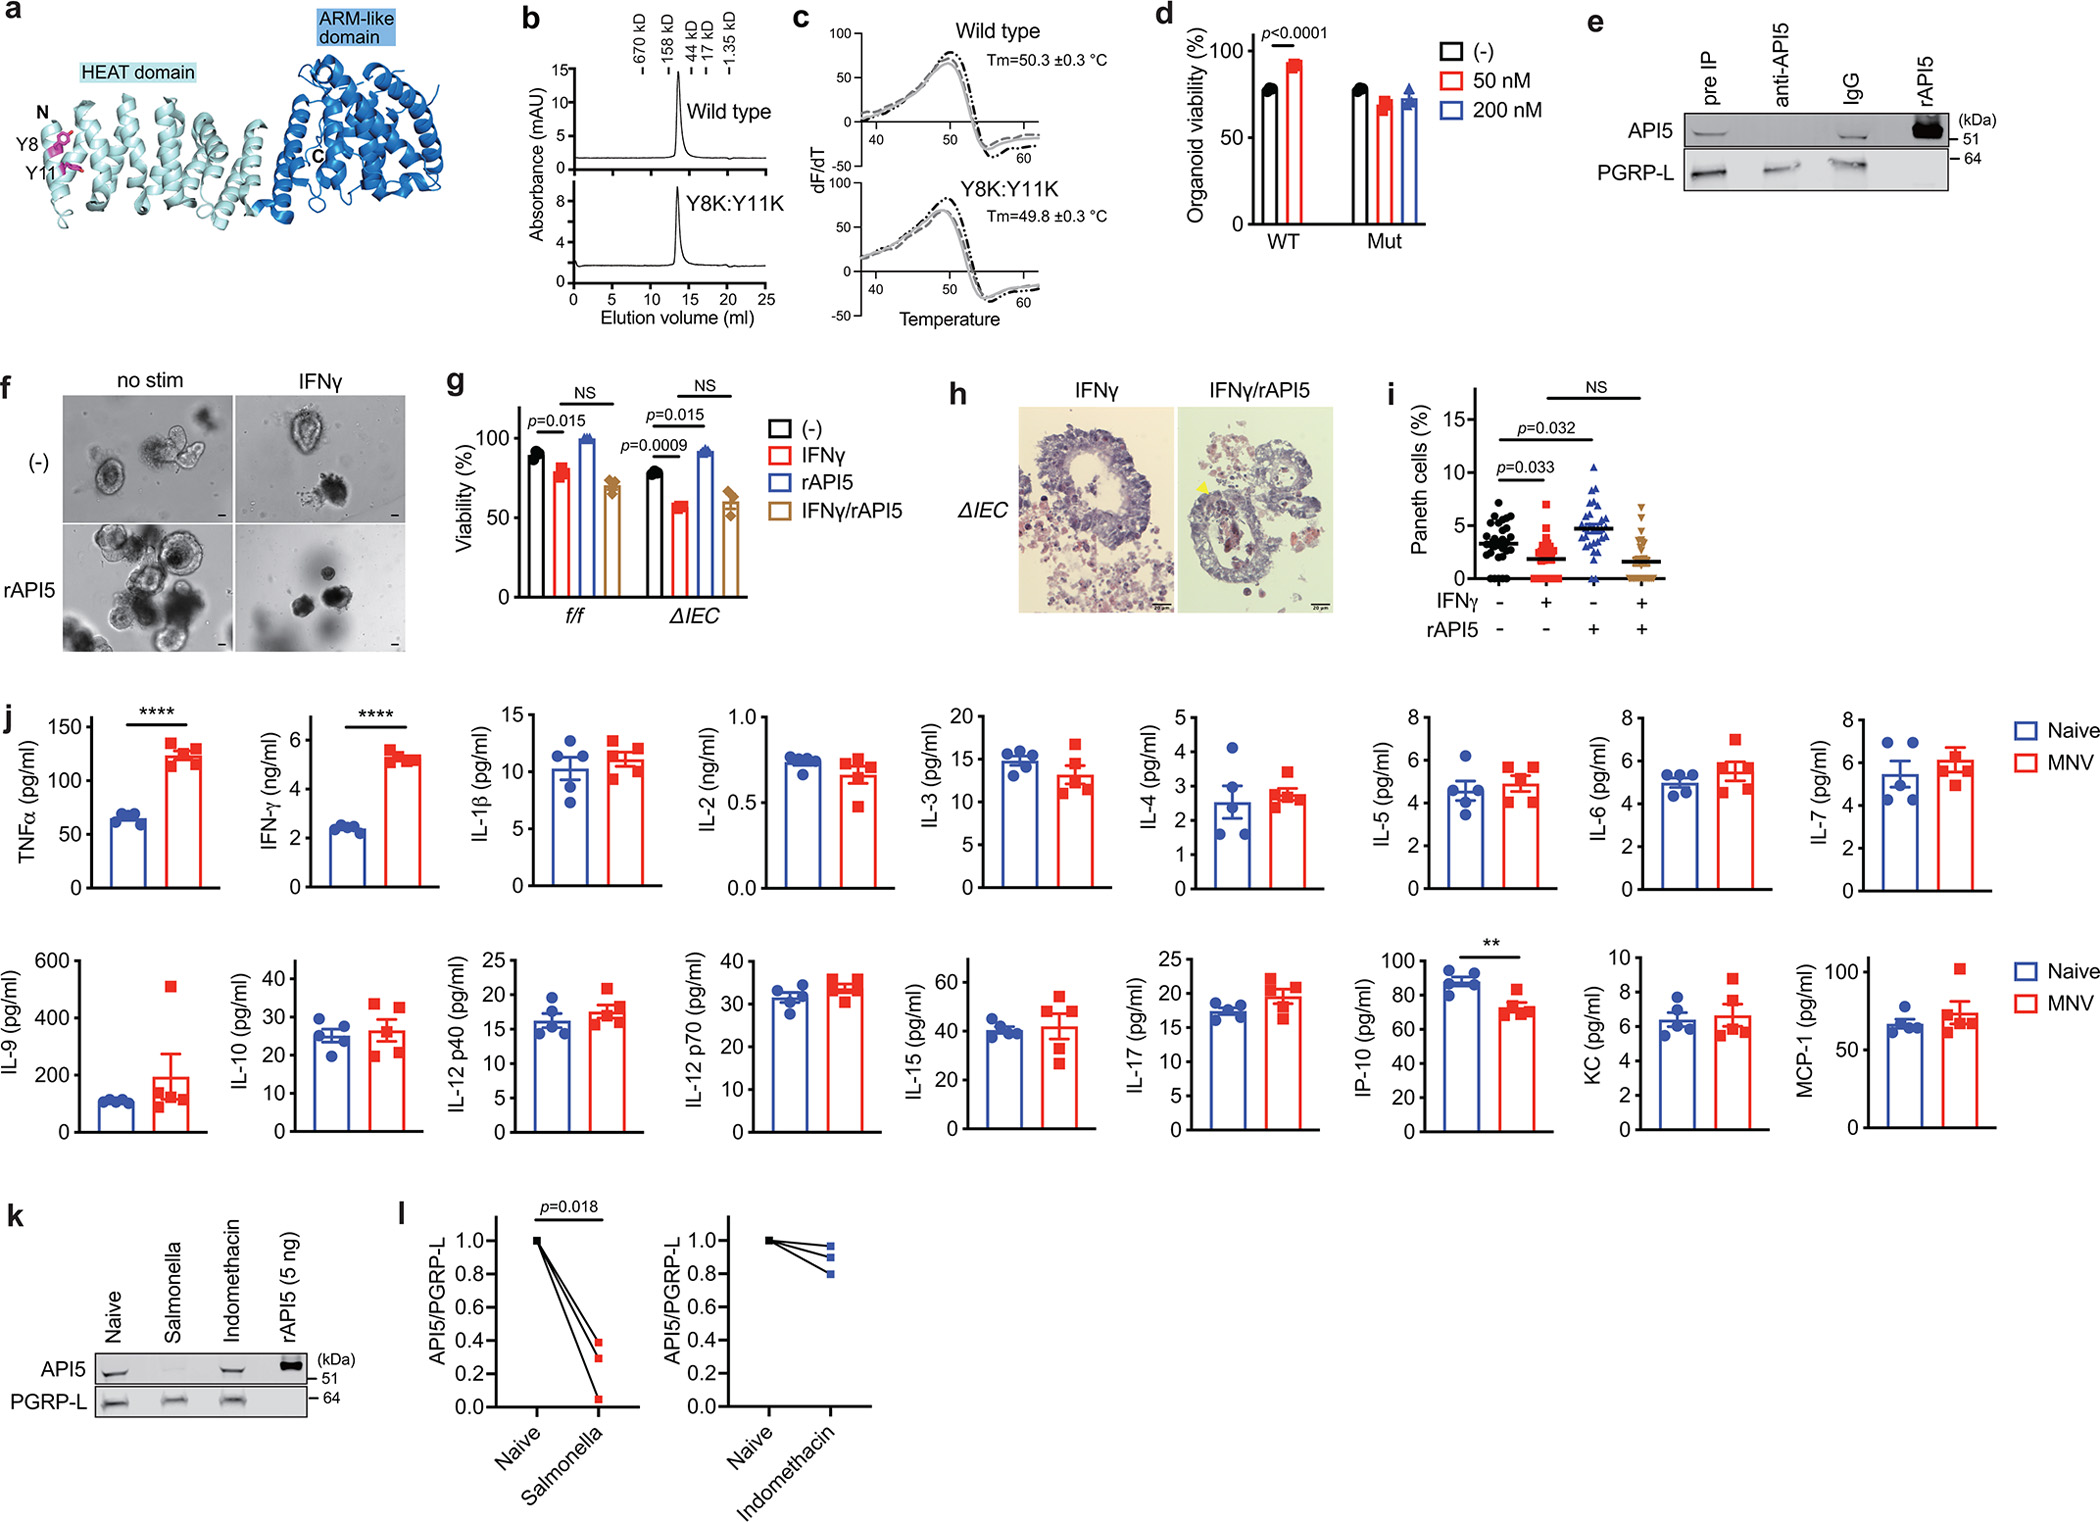
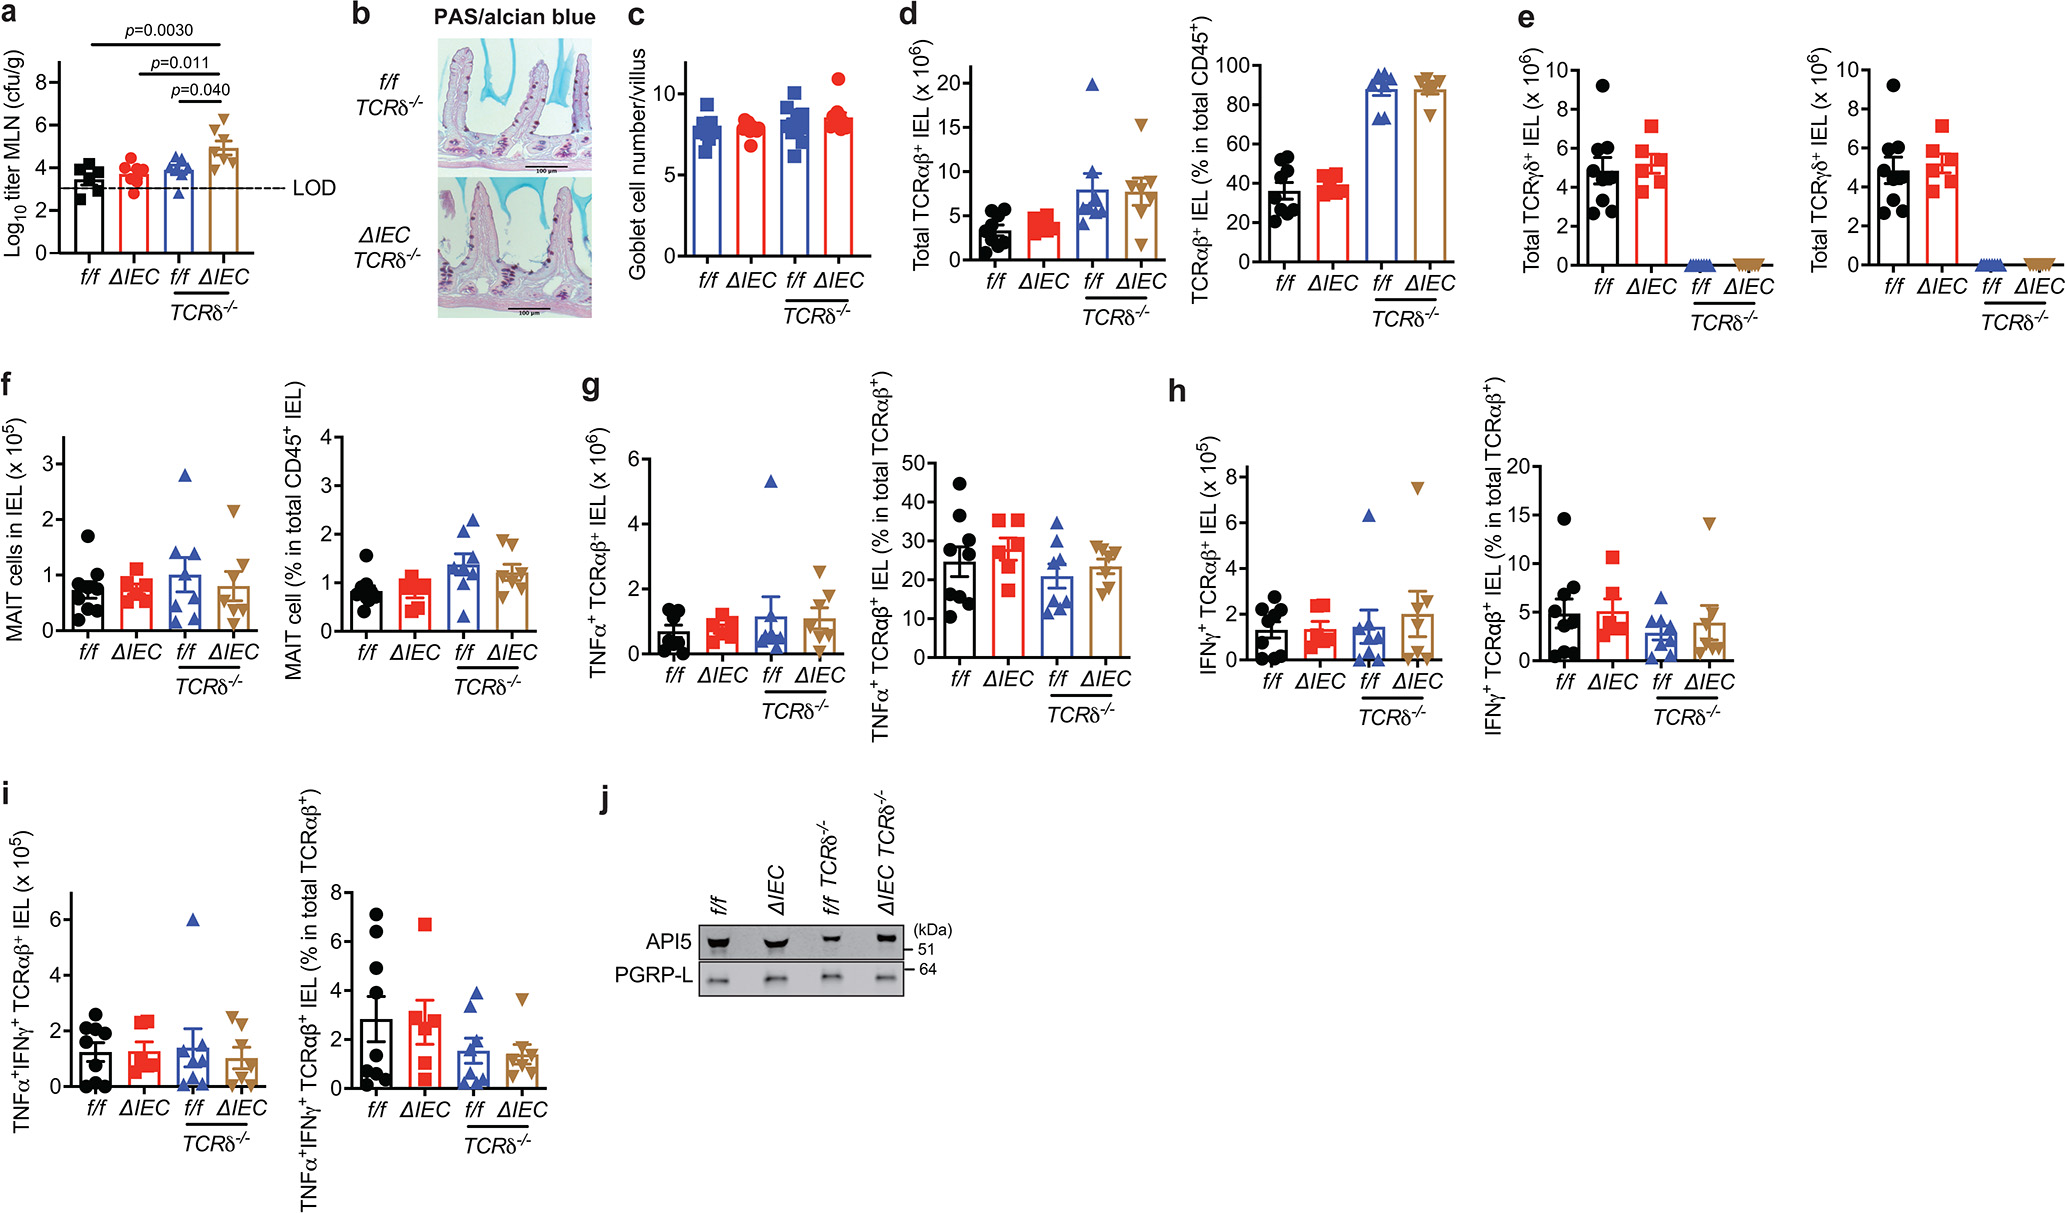
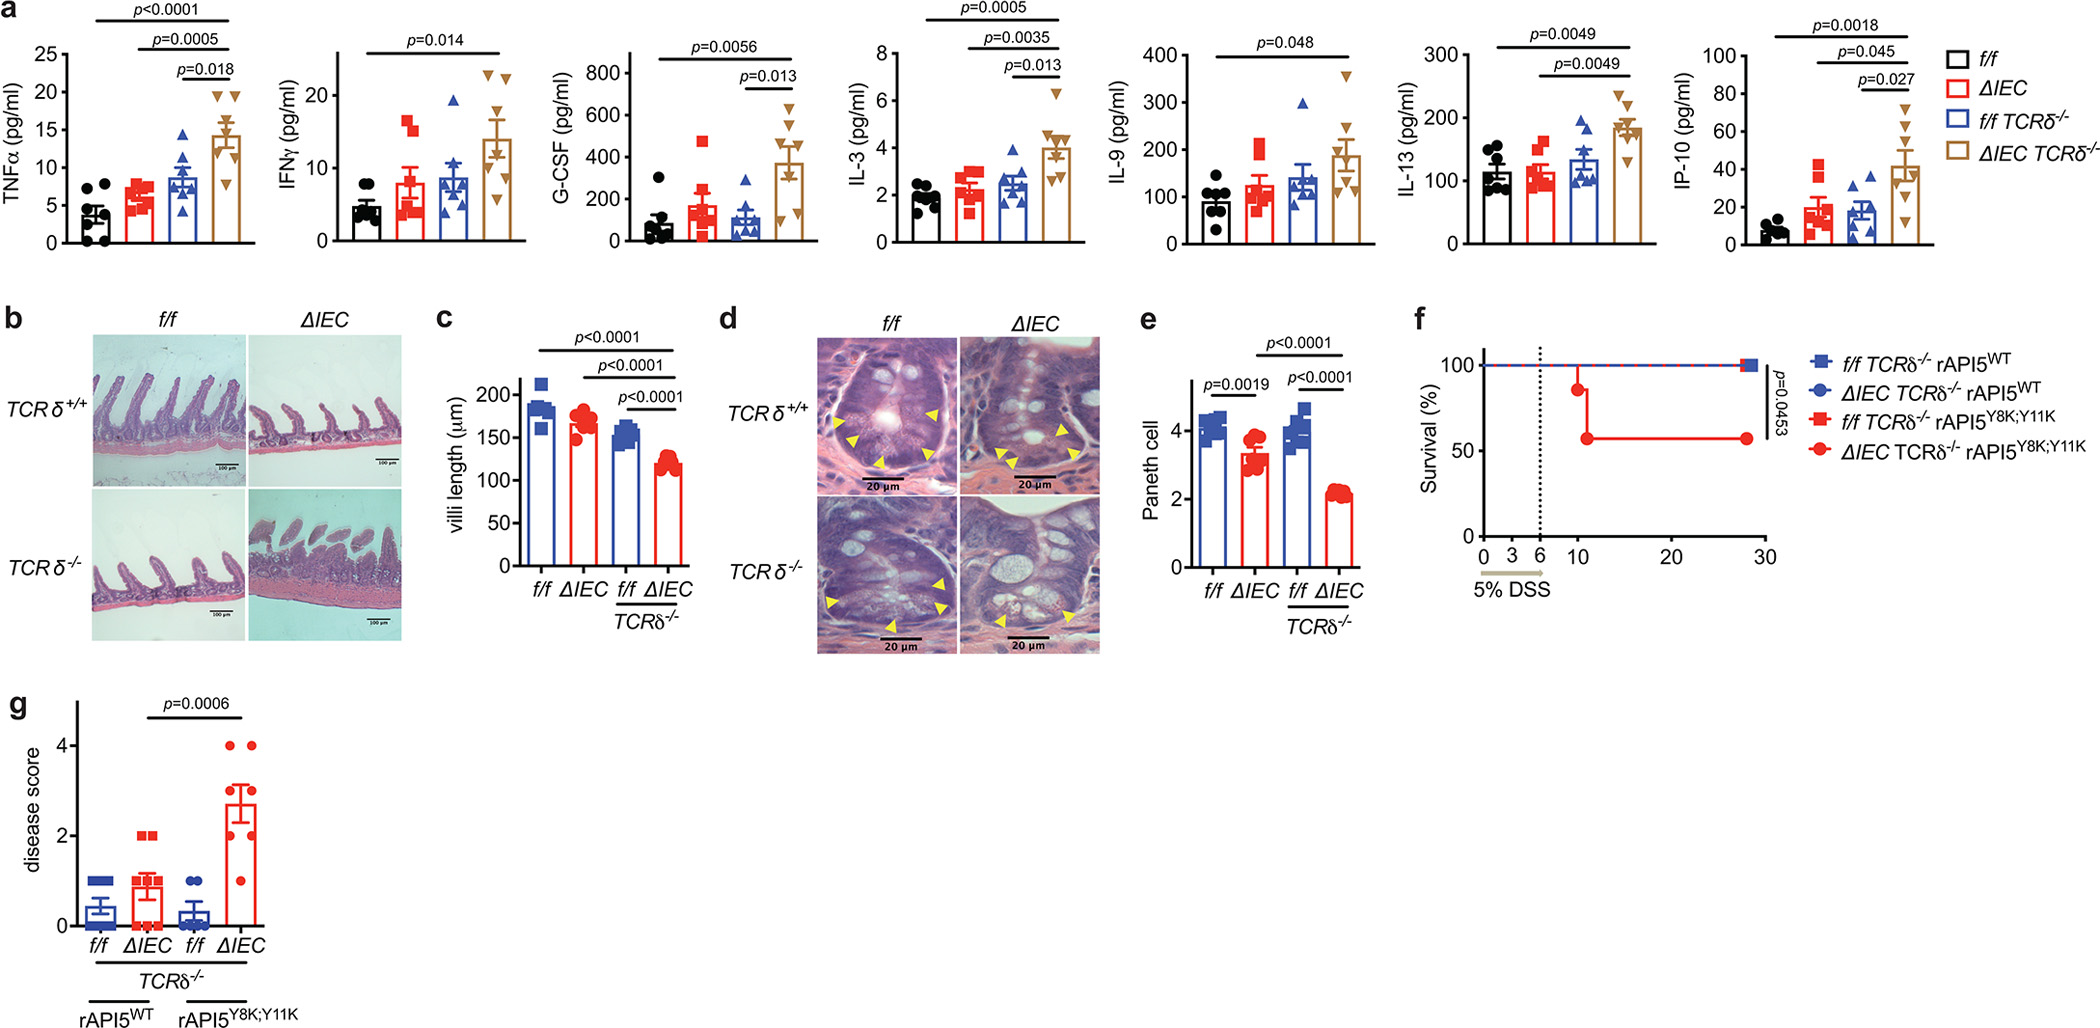
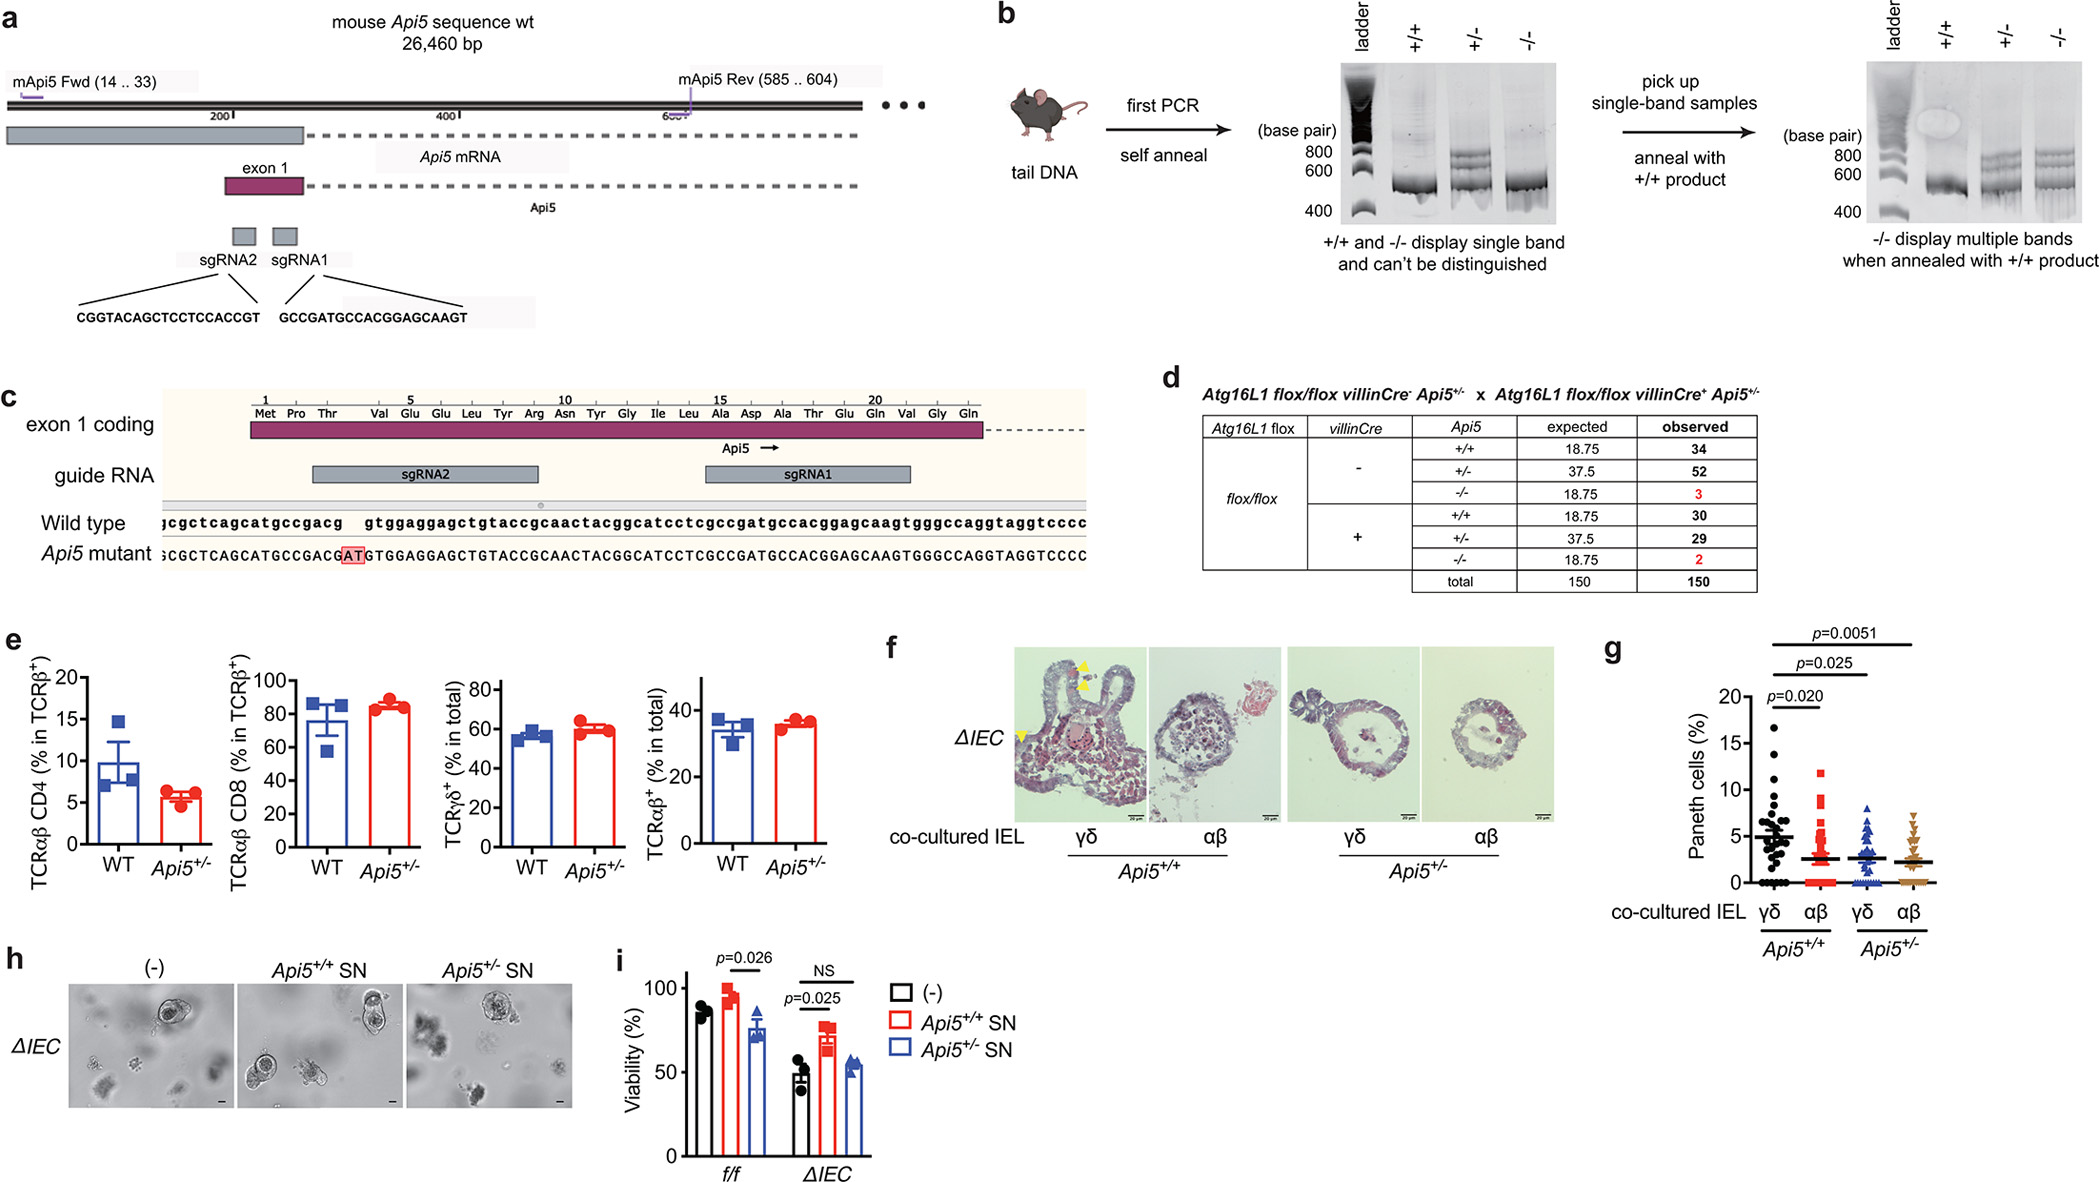
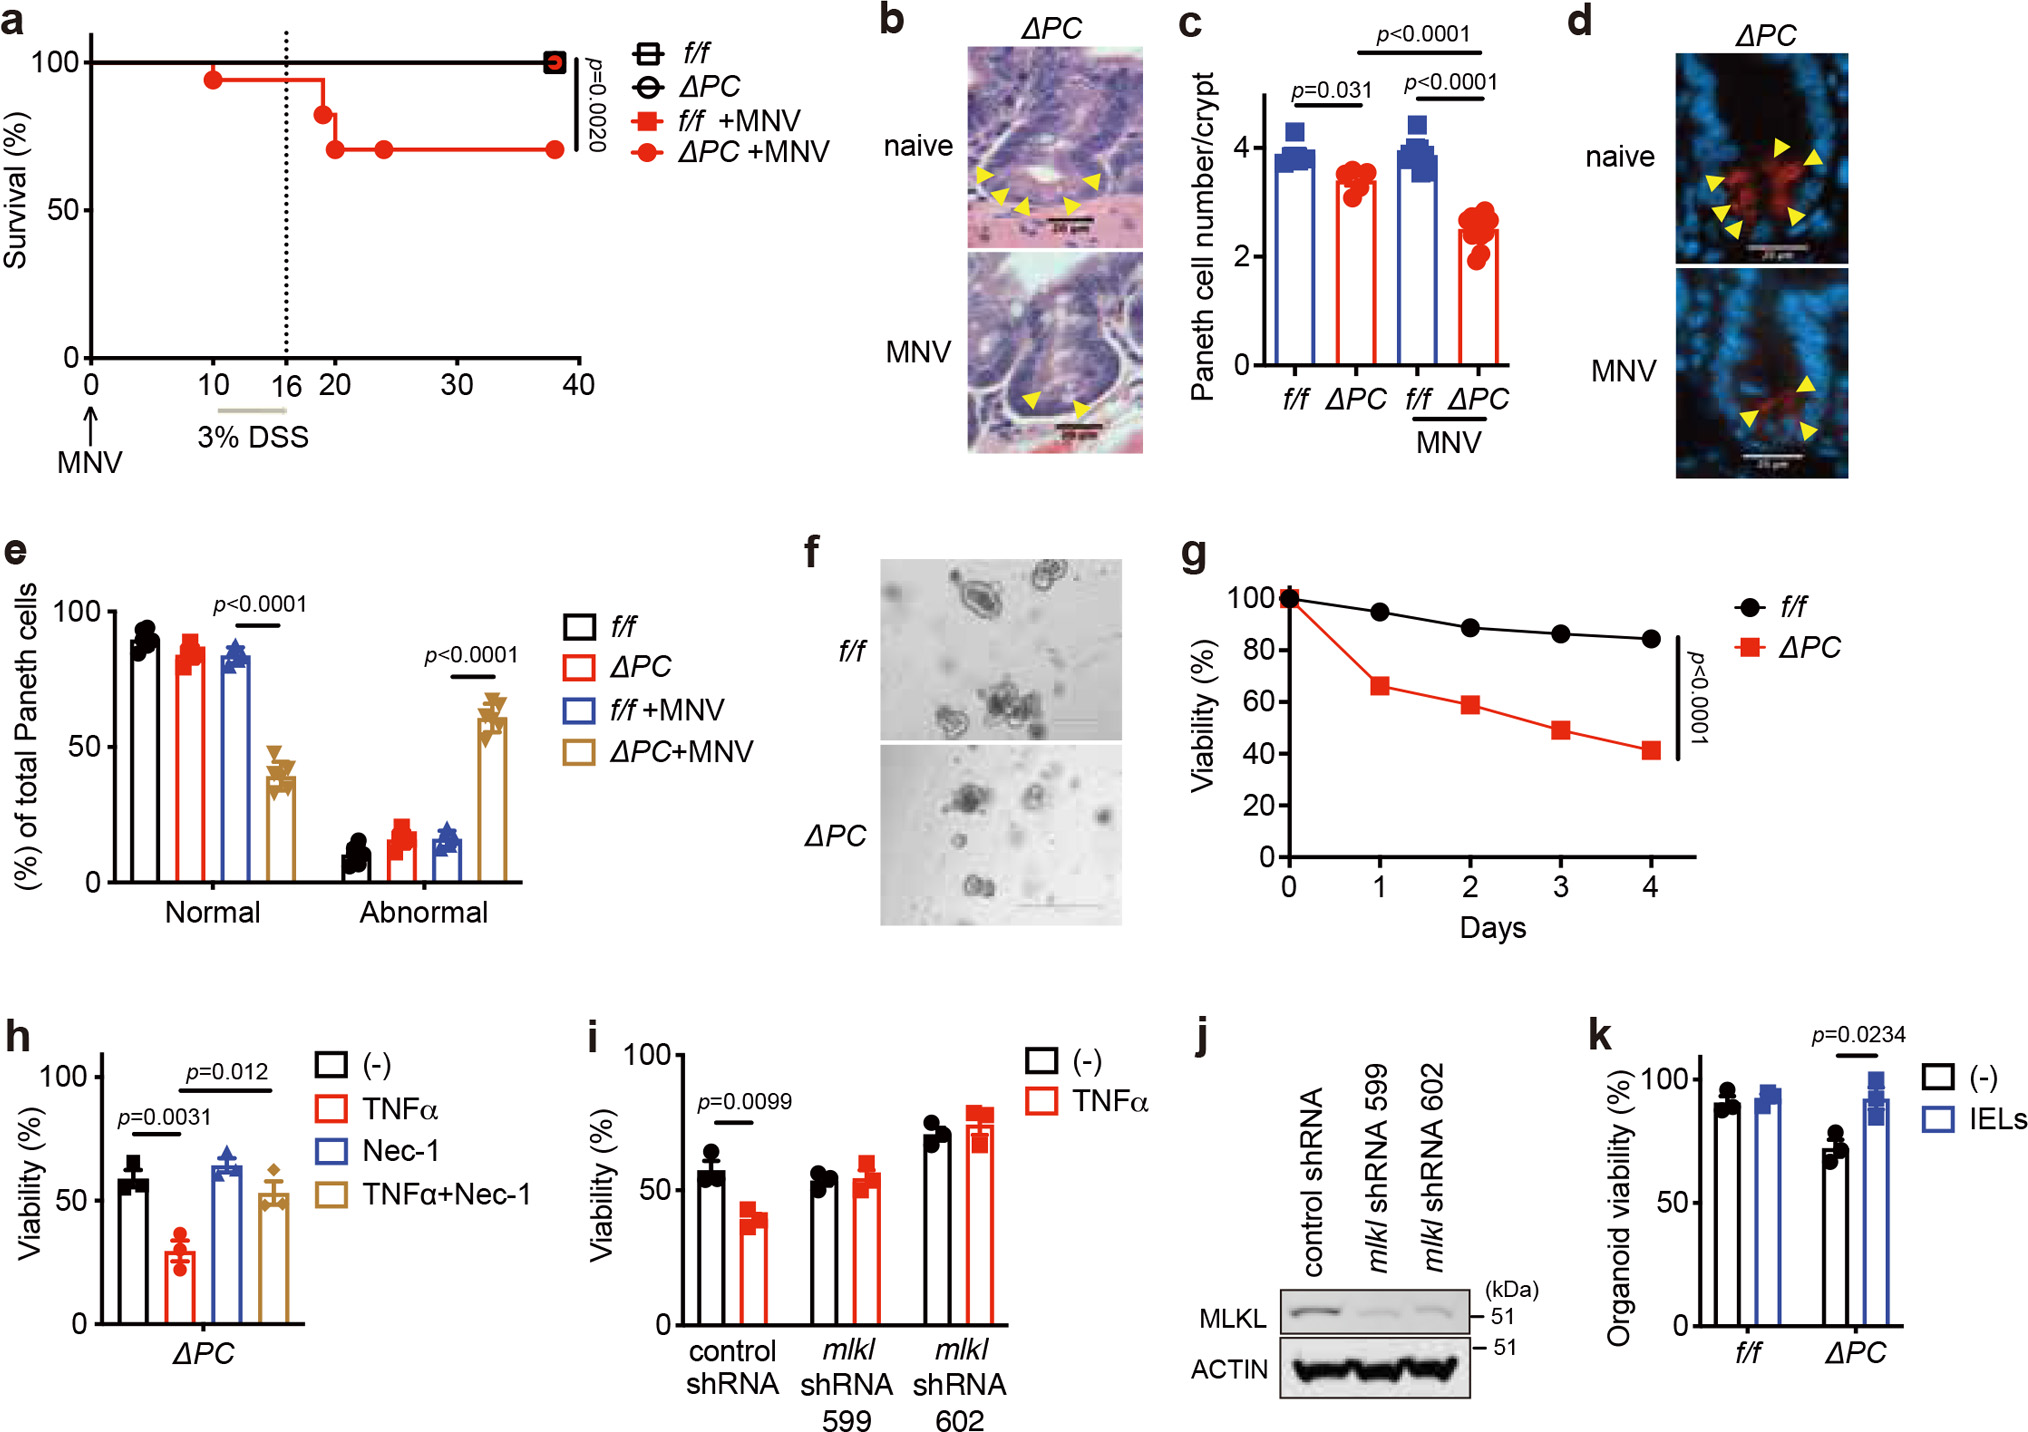
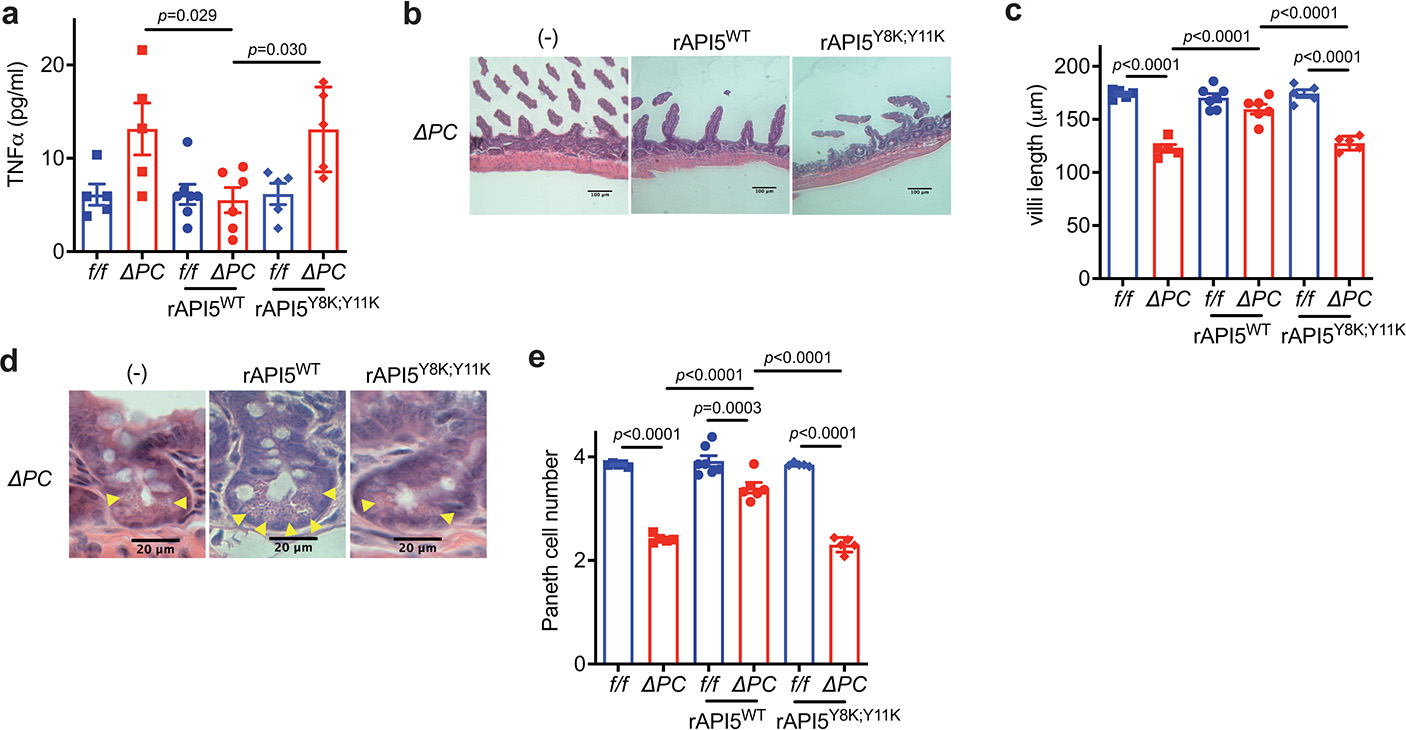
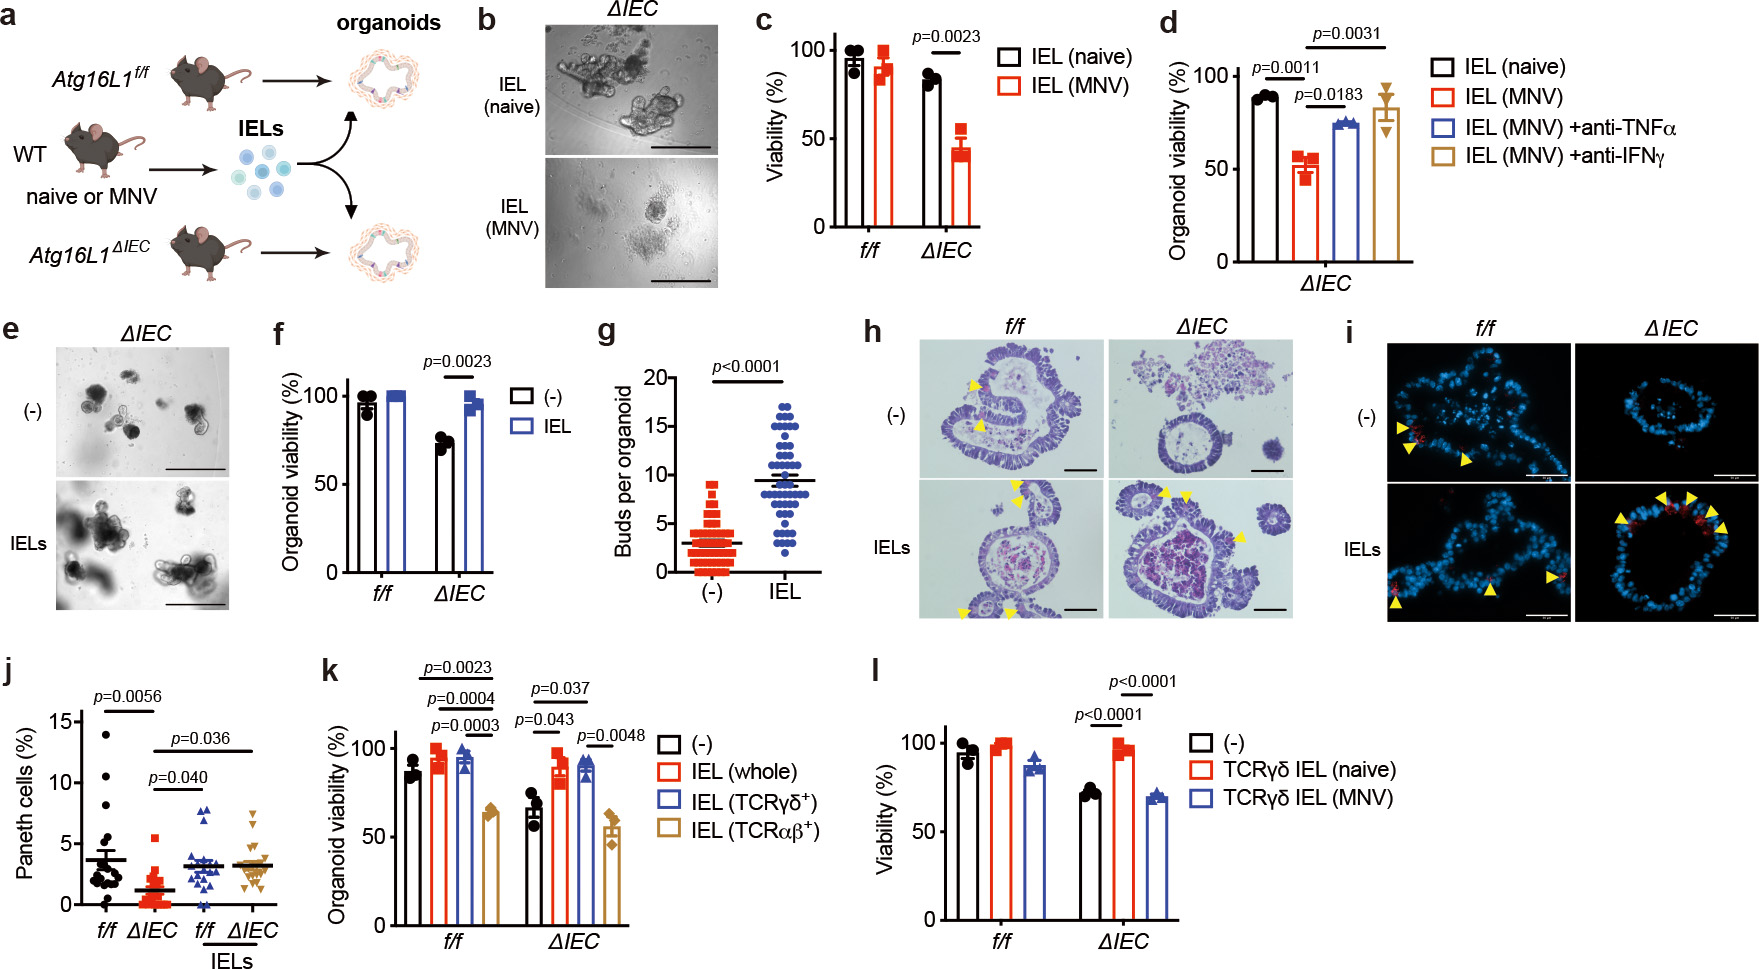
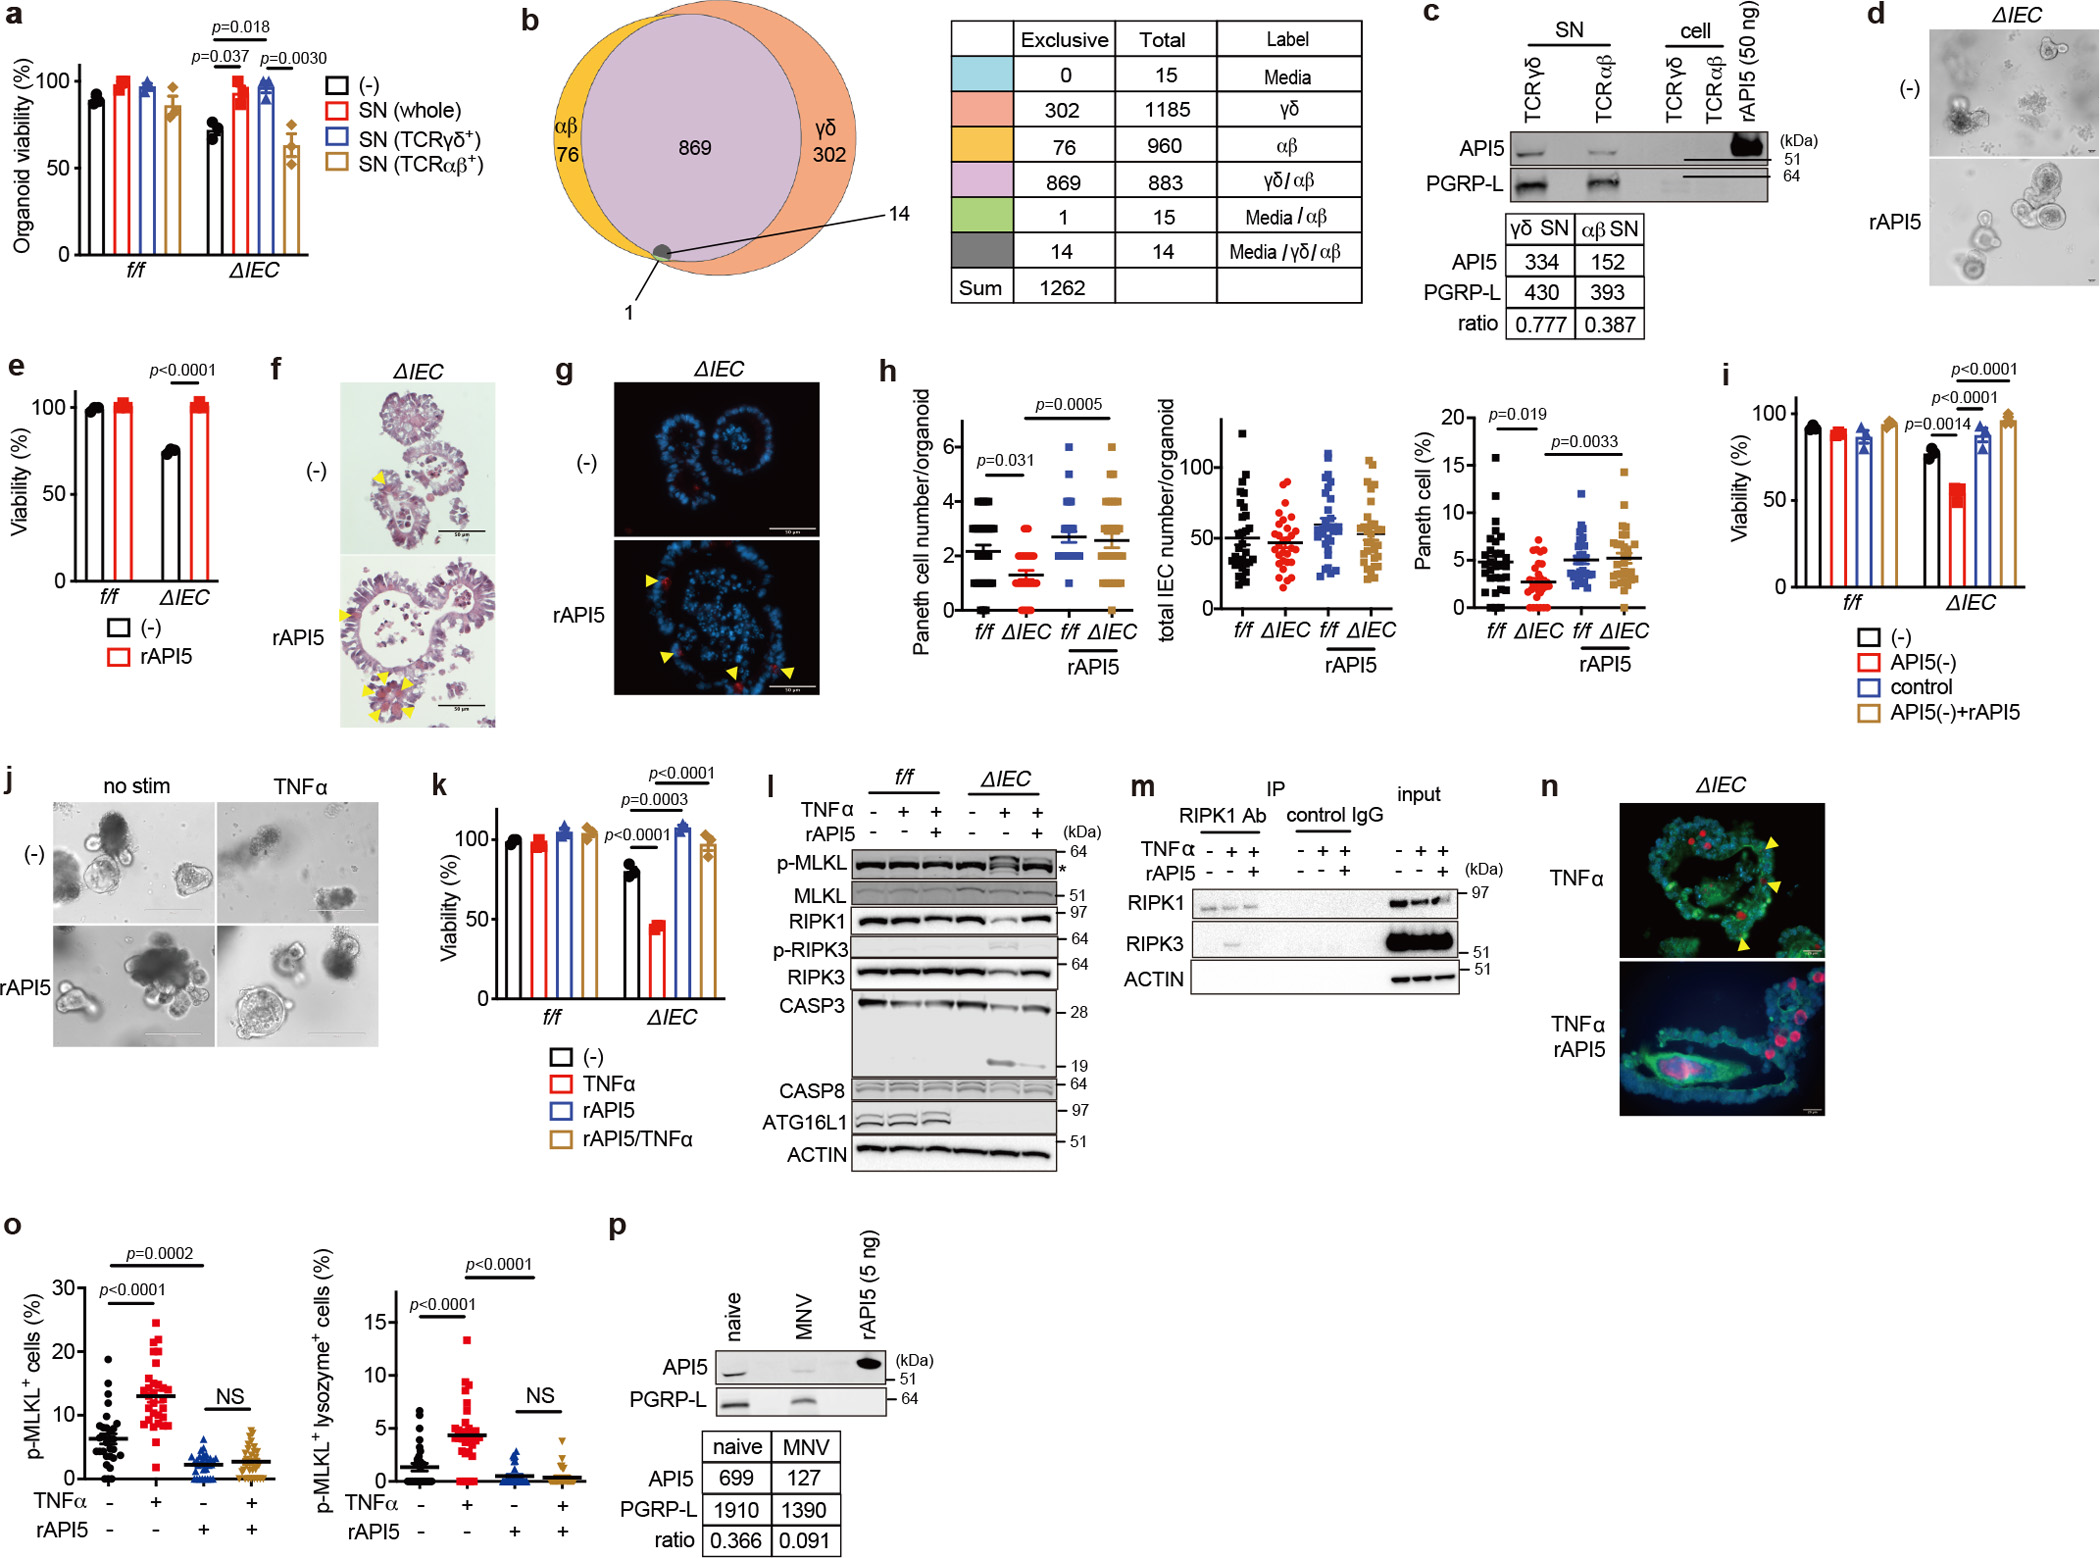
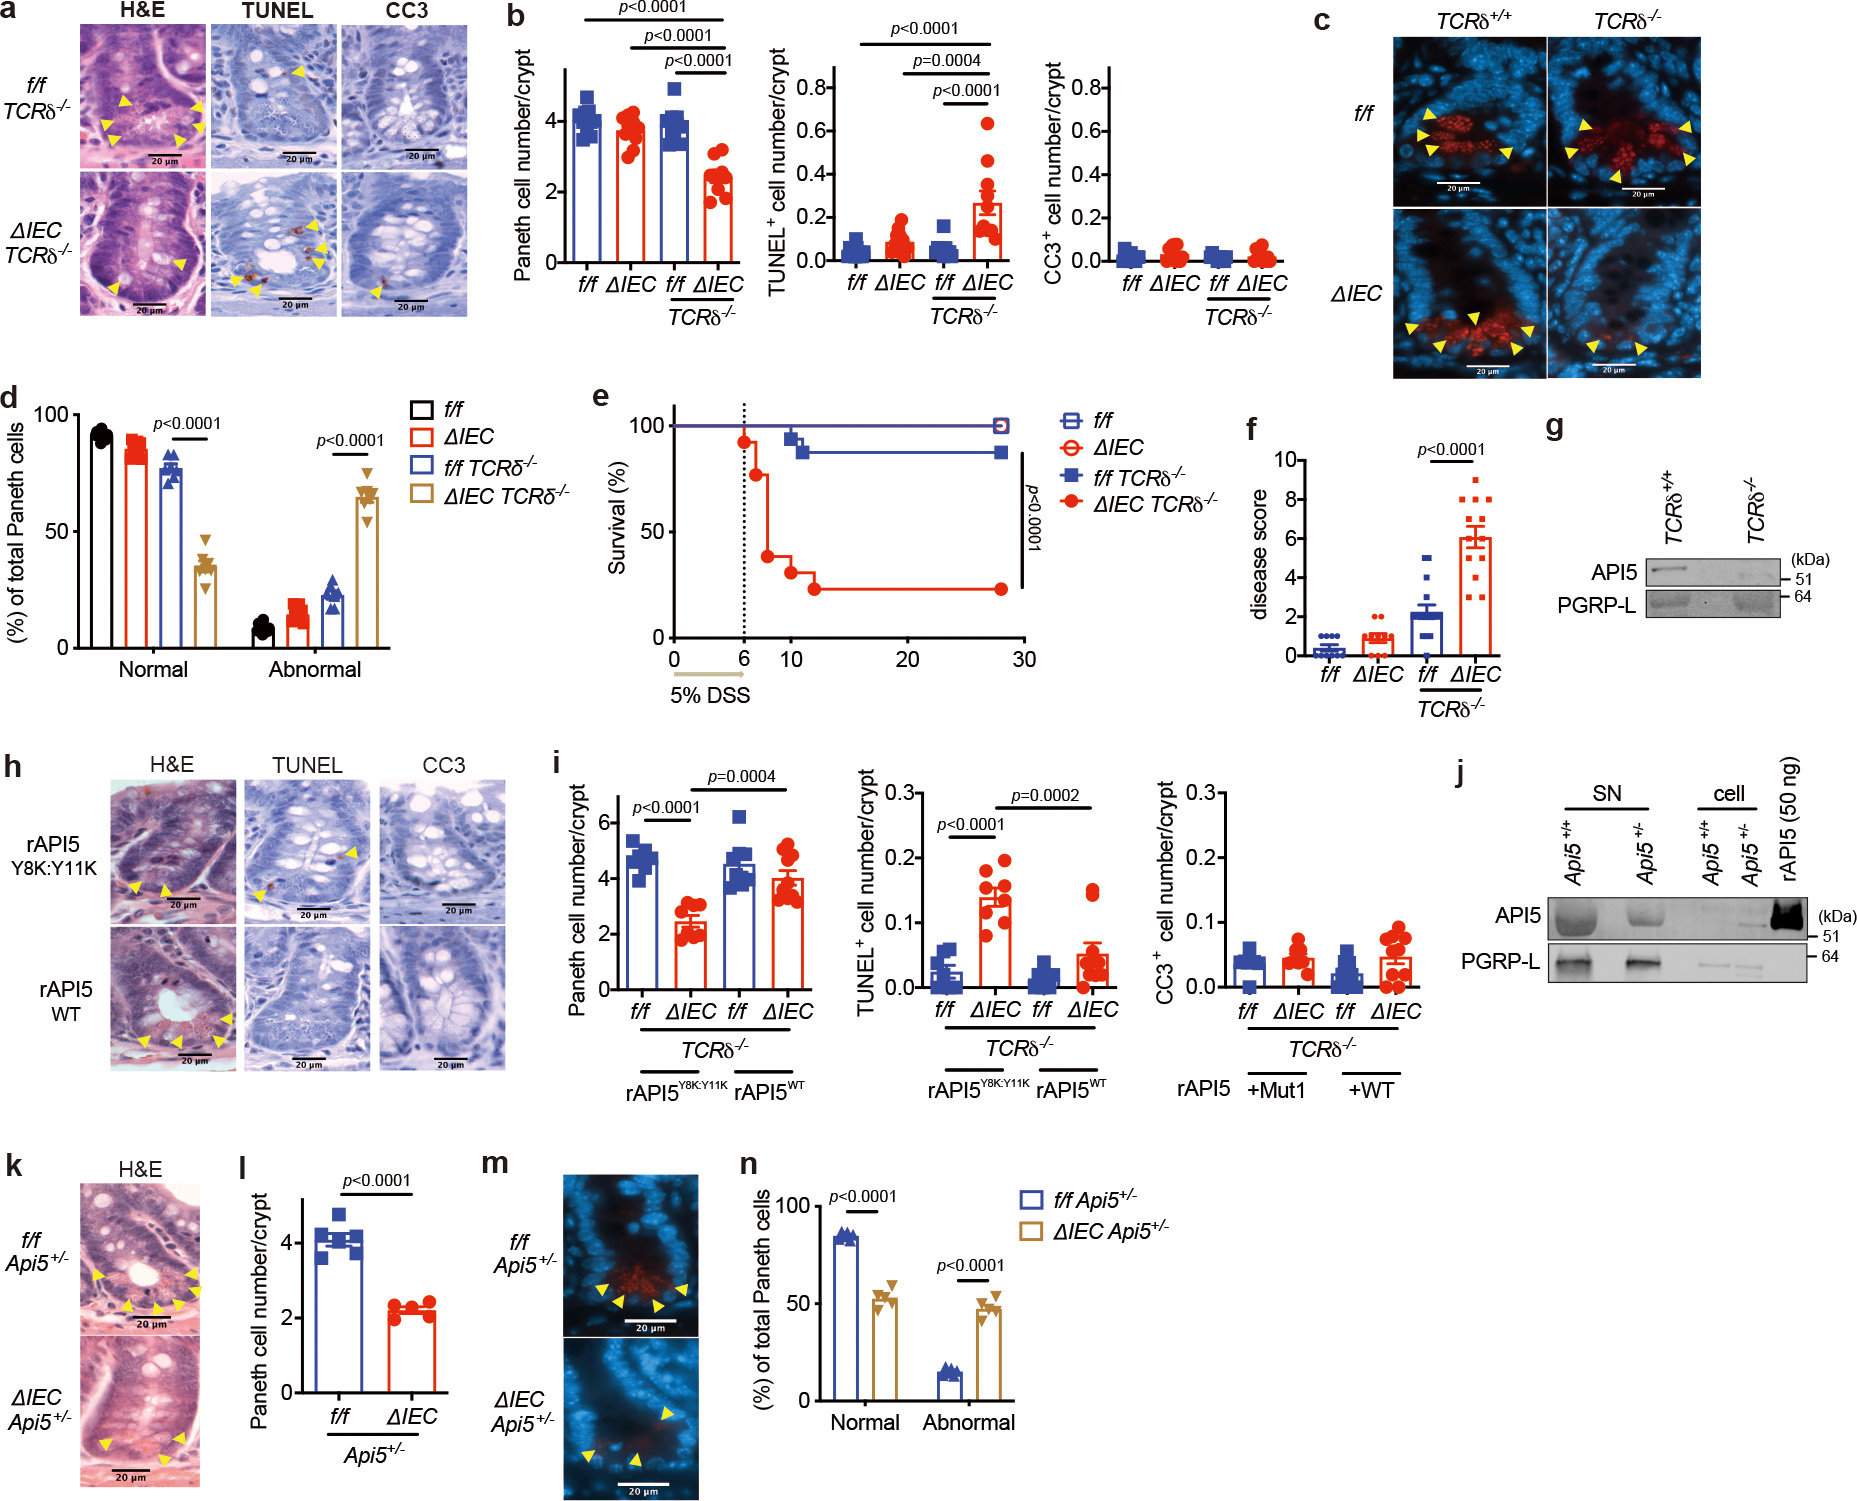
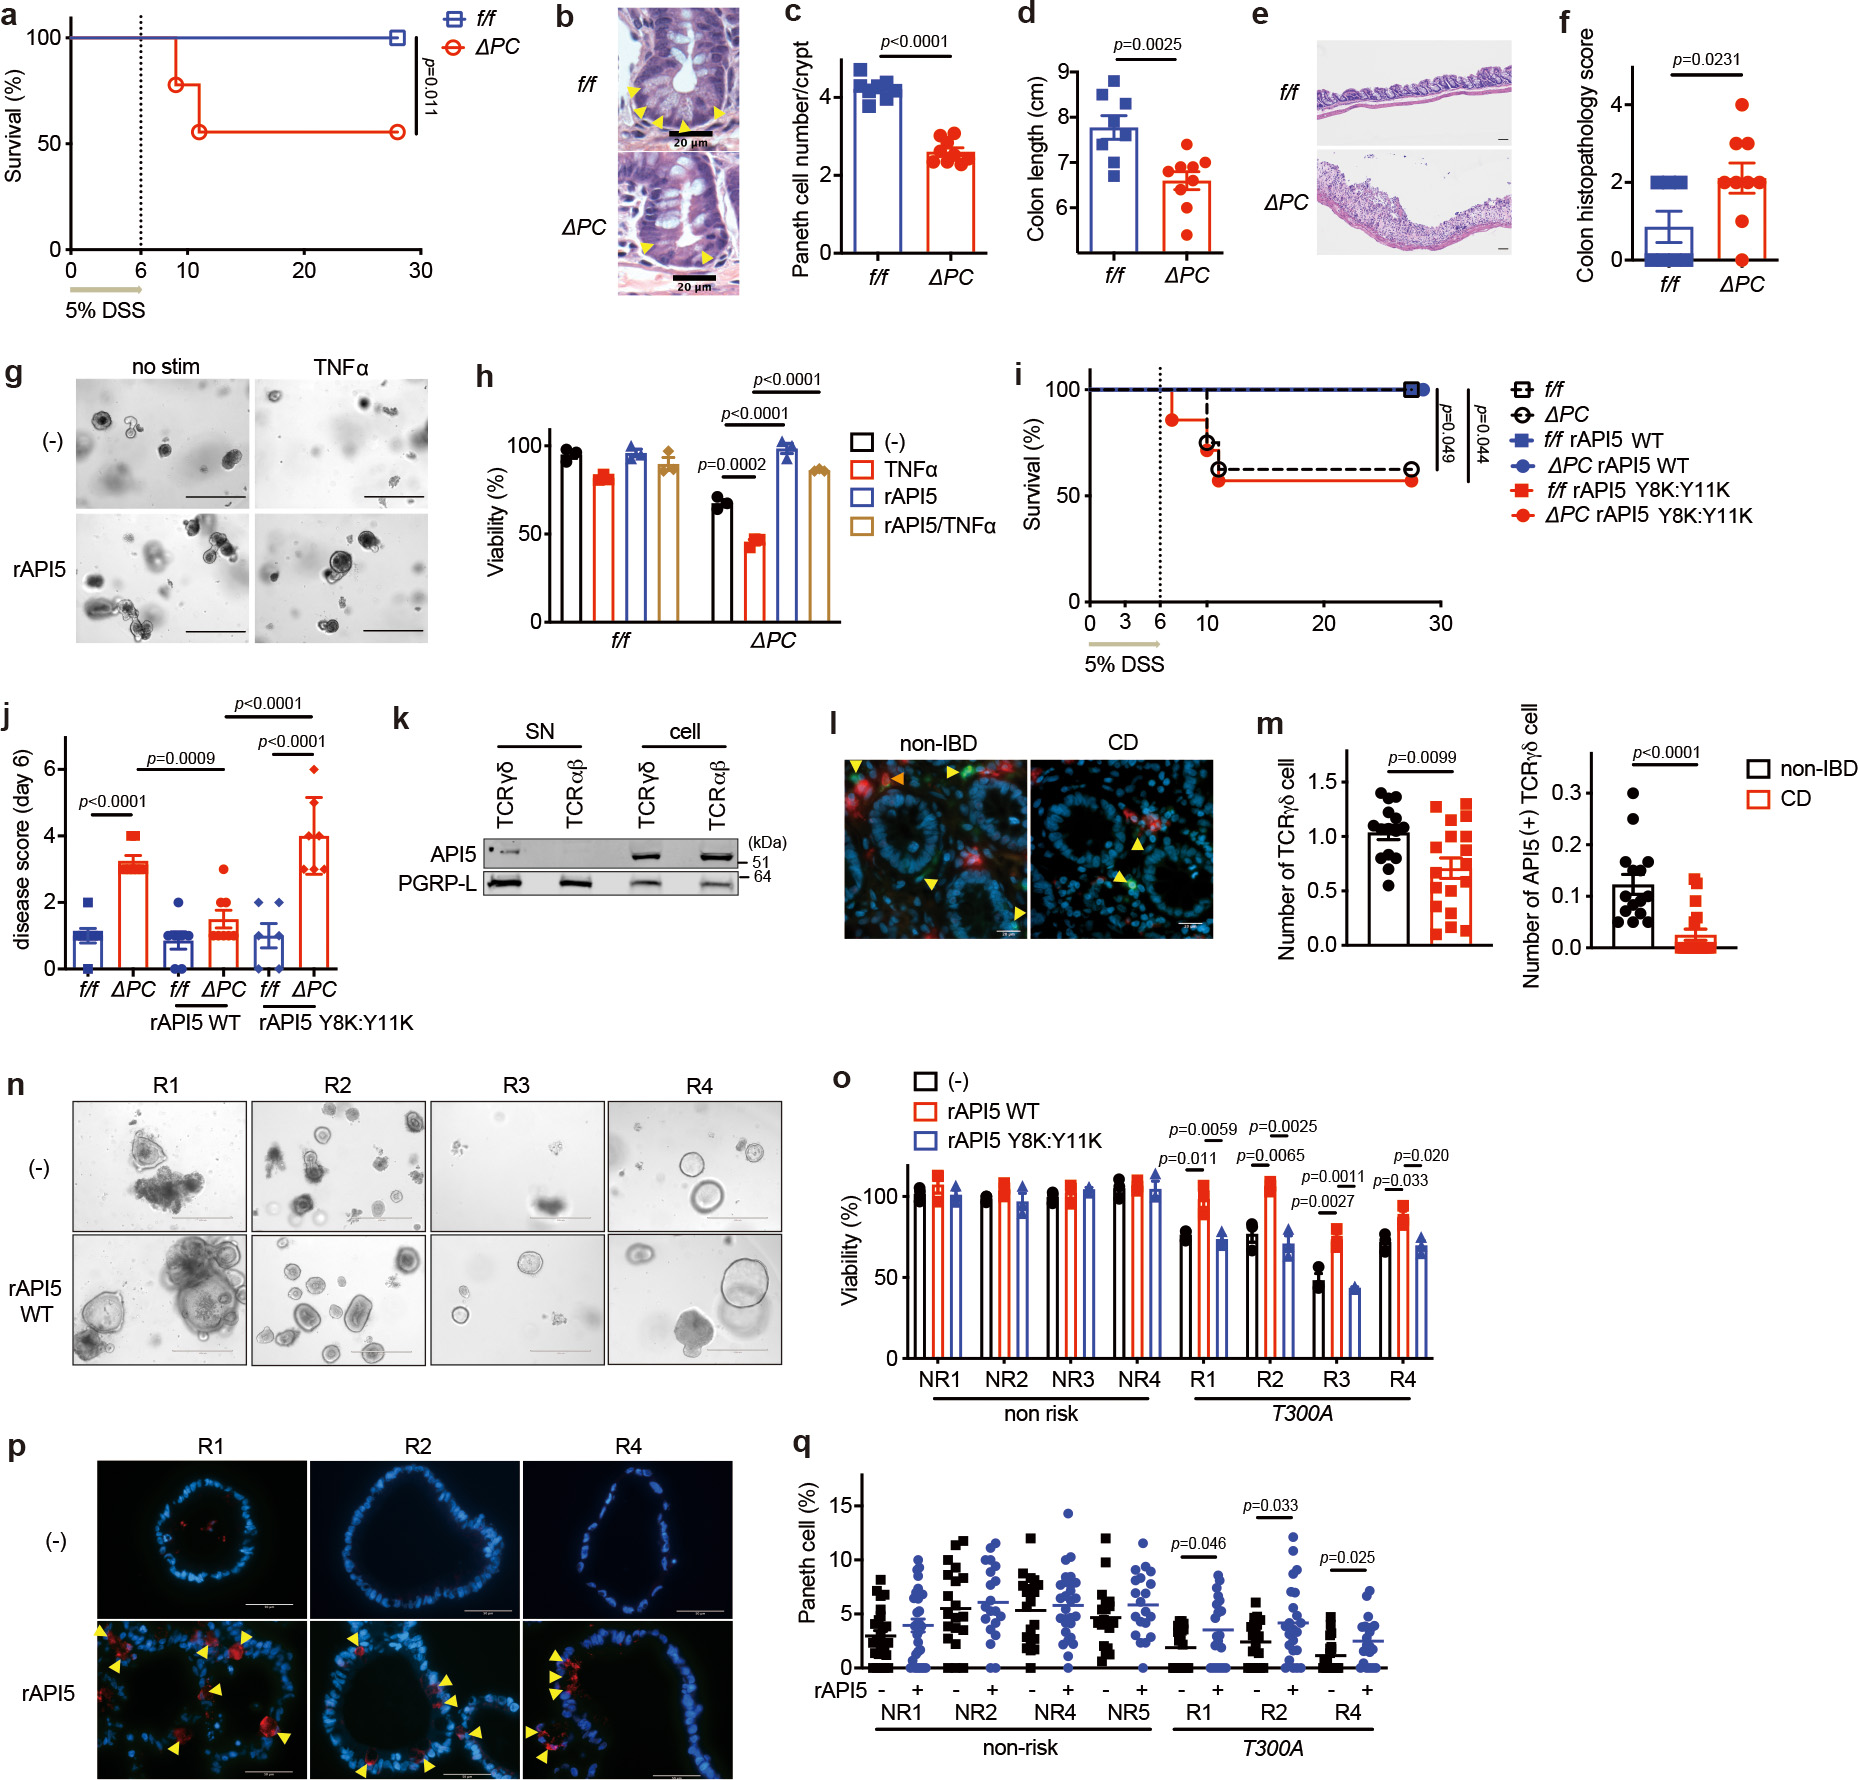
Loss of Paneth cells and their antimicrobial granules compromises the intestinal epithelial barrier and is associated with Crohn's disease, a major type of inflammatory bowel disease1-7. Non-classical lymphoid cells, broadly referred to as intraepithelial lymphocytes (IELs), intercalate the intestinal epithelium8,9. This anatomical position has implicated them as first-line defenders in resistance to infections, but their role in inflammatory disease pathogenesis requires clarification. The identification of mediators that coordinate crosstalk between specific IEL and epithelial subsets could provide insight into intestinal barrier mechanisms in health and disease. Here we show that the subset of IELs that express γ and δ T cell receptor subunits (γδ IELs) promotes the viability of Paneth cells deficient in the Crohn's disease susceptibility gene ATG16L1. Using an ex vivo lymphocyte-epithelium co-culture system, we identified apoptosis inhibitor 5 (API5) as a Paneth cell-protective factor secreted by γδ IELs. In the Atg16l1-mutant mouse model, viral infection induced a loss of Paneth cells and enhanced susceptibility to intestinal injury by inhibiting the secretion of API5 from γδ IELs. Therapeutic administration of recombinant API5 protected Paneth cells in vivo in mice and ex vivo in human organoids with the ATG16L1 risk allele. Thus, we identify API5 as a protective γδ IEL effector that masks genetic susceptibility to Paneth cell death.


Conflict of interest statement

DECLARARION OF INTERESTS

K.C. has received research support from Pfizer, Takeda, Pacific Biosciences, Genentech, and Abbvie. K.C. has consulted for or received an honoraria from Puretech Health, Genentech, Abbvie, GentiBio, and Synedgen. K.C. is an inventor on U.S. patent 10,722,600 and provisional patent 62/935,035, and K.C., S.K., A.K., and Y.M-I. on 63/157,225. S.K. was a SAB member and held equity in and received consulting fees from Black Diamond Therapeutics and has received research support from Argenx BVBA, Black Diamond Therapeutics and Puretech Health, and is a co-founder of Revalia Bio.

Figures

Extended Data Fig. 1 |
Extended Data Fig. 1 |. IELs display altered motility and positioning in MNV-infected mice (related to supplementary videos 1–4).
a-b, TCRδGFP mice were anesthetized and prepped for intravital imaging analyses 18 hours post MNV-infection. Naïve TCRδGFP mice were used as control (see supplementary movies 3 and 4). a, Unbiased computational quantification (mean and SEM) of flossing. Data analysis with two-sided unpaired Student’s t-test. Data points are the average flossing per animal, from 2 independent experiments. b, Unbiased computational quantification (mean and SEM) of cell speed. Each dot represents the average speed of each cell. Data pooled of 3 animals, from 2 independent experiments. c, d, Transversal segments of the ileum from MNV-infected (red) and naïve (blue) TCRδGFP mice were fixed in 4% PFA and imaged using multiphoton microscope. c, γδ T cell distribution along the villi, from crypt (0) to tip of the villus (100). d, Mean distribution of γδ T cell along the villi. Data points in (c) and (d) represent a segment. Bars represent means ± SEM.
Extended Data Fig. 2 |
Extended Data Fig. 2 |. Flow cytometric characterization of IELs in MNV-infected mice.
a-l, The IEL compartment of the small intestine from WT mice euthanized on day 10 post MNV infection were analyzed by flow cytometry and compared with naïve WT control mice. a, Representative flow cytometry plots showing gating strategy. b, Total number of live IELs harvested from whole small intestine. n= 40 (naïve) and 40 (MNV). c-l, Absolute number and proportion of the indicated subpopulations in the small intestine. n= 10 (naïve) and 10 (MNV). Data analysis with two-sided unpaired Student’s t-test in (b-l). Data points in (b) - (l) are individual mice. Bars represent means ± SEM, and at least two independent experiments were performed.
Extended Data Fig. 3 |
Extended Data Fig. 3 |. Single cell RNA sequencing of IELs in MNV-infected mice.
a-c, CD45+CD103+ IELs from the small intestines of WT mice euthanized on day 10 post MNV-infection or naïve mice were analyzed for single cell RNA sequencing (scRNA-seq). a, Representative flow cytometry plots showing the gating strategy used to sort CD45+CD103+ IELs. b,c, UMAP analysis of CD45+CD103+ IELs profiled by scRNA-Seq and colored by unbiased louvain clustering (b) and MNV infection status (c). n= 4 (naïve) and 4 (MNV).
Extended Data Fig. 4 |
Extended Data Fig. 4 |. Analyses of secreted products by γδ IELs.
a, Western blot analysis of supernatant (SN) harvested from TCRγδ+ IELs sorted from naïve WT mice either unstimulated (incubated in the medium for 4 hours) or stimulated with anti-CD3/CD28 for 24 hours. b-d, Representative images (b), viability (c), and area (d) of small intestinal organoids from ΔIEC mice cultured for 48 hours with either unstimulated or stimulated γδ SN in (a). Scale bar 25 μm. e, Viability of small intestinal organoids from Atg16L1f/f (f/f) and Atg16L1ΔIEC (ΔIEC) mice cultured ± 10 ng/ml recombinant KGF. Intestinal crypts were harvested from 3 mice per genotype. f, Schematic representation for the preparation of IEL SN for LC-MS. IELs were harvested from small intestine of naïve WT mice, and cultured with serum free medium stimulated with anti-CD3/CD28 for 24 hours. g, Quantification of the indicated cytokines in either γδ or αβ SN harvested from naïve WT mice (n=5). An ANOVA with Tukey’s multiple-comparison test in (c, d). Two-sided unpaired Student’s t-test in (e, g). Data points in (c) represent organoid viability in each well, data points in (d) represent individual organoids, data points in (e) are mean of organoid viabilities performed in triplicate, and data points in (g) represent individual mice. Bars represent means ± SEM, and at least two independent experiments were performed.
Extended Data Fig. 5 |
Extended Data Fig. 5 |. Generation of recombinant API5 protein and effect of environmental triggers on the secretome of IELs.
a, Architecture of API5. The N and C termini, the HEAT and ARM-like domains, residues mutated in our study (Y8, Y11) are indicated. b, Size-exclusion chromatograms of Superdex200 (GE Healthcare) of wild-type and (Y8K:Y11K) rAPI5, indicating that they are predominantly monomeric. c, Thermal denaturation of API5 monitored using SYPRO Orange binding. The graph shows the first derivative of fluorescence intensity (n=3). d, Viability of small intestinal organoids from Atg16L1ΔIEC (ΔIEC) mice cultured ± 50 nM and 200 nM wild-type or mutant (Y8K:Y11K) recombinant API5 for 48 hours. e, Western blot analysis of SN samples harvested from TCRγδ+ IELs stimulated with anti-CD3/CD28 for 24 hours corresponding to Fig. 2i. Total SN was equally divided into three; 1 left untreated (Pre-IP), and the other 2 were immunoprecipitated with anti-API5 antibody or control IgG antibody-conjugated magnetic beads for 24 hours. f, g, Representative images (f) and viability (g) of small intestinal organoids from ΔIEC mice stimulated ± 0.5 ng/ml IFNγ for 48 hours after pretreatment with 50 nM wild-type rAPI5 for 3 days. Scale bar 25 μm. h, i, Representative H&E images (h) and quantification (i) of Paneth cell and total IEC number per organoid stimulated ± 0.5 ng/ml IFNγ ± 50 nM wild-type rAPI5 for 24 hours after pretreatment with 50 nM wild-type rAPI5 for 4 days. Arrowheads indicate Paneth cells. Scale bar 20 μm. j, Quantification of the indicated cytokines in SN of γδ IELs harvested either from naïve or MNV-infected WT mice (n=5 per condition). k, Western blot analysis of SN from γδ IELs harvested from naïve, Salmonella-infected, or indomethacin-treated WT mice following stimulation with anti-CD3/CD28 for 24 hours. l, Quantification of API5 normalized to PGRP-L by densitometric analyses of (k). Each value is divided by naïve. In organoid experiments, intestinal crypts were harvested from 3 mice per genotype. Two-sided unpaired Student’s t-test in (d, j). An ANOVA with Tukey’s multiple-comparison test in (g, i). Two-sided paired Student’s t-test in (l). Data points in (d) and (g) represent organoid viability in each well, data points in (i) represent individual organoids, data points in (j) represent individual mice, and data points in (l) represent API5/PGRP-L value in each western blot. Bars represent means ± SEM, and at least two independent experiments were performed.
Extended Data Fig. 6 |
Extended Data Fig. 6 |. Additional characterization of mice deficient in γδ T cells and ATG16L1 in the epithelium.
a, Colony forming units (CFU) of bacteria in mesenteric lymph nodes harvested from naïve Atg16L1f/f (f/f), Atg16L1ΔIEC (ΔIEC), Atg16L1f/f TCRδ−/− (f/f TCRδ−/−), and Atg16L1ΔIEC TCRδ−/− (ΔIEC TCRδ−/−) mice. n=7 (f/f), 7 (ΔIEC), 7 (f/f TCRδ−/−), and 7 (ΔIEC TCRδ−/−). LOD; limit of detection. Data analysis with an ANOVA with Tukey’s multiple-comparison test. b, c, Representative images of periodic acid-Schiff (PAS)/Alcian blue staining (b) and quantification of goblet cells (c) in the small intestinal samples harvested from naïve f/f, ΔIEC, f/f TCRδ−/−, and ΔIEC TCRδ−/− mice. n= 11 (f/f), 11 (ΔIEC), 10 (f/f TCRδ−/−), and 10 (ΔIEC TCRδ−/−). Scale bar 100 μm. d-i, Absolute number and proportion of the indicated subpopulations in the small intestine. n=9 (f/f), 6 (ΔIEC), 8 (f/f TCRδ−/−), and 7 (ΔIEC TCRδ−/−). j, Western blot analysis of SN harvested from TCRαβ+ IELs sorted from naïve f/f, ΔIEC, f/f TCRδ−/−, and ΔIEC TCRδ−/− mice. The IELs were stimulated with anti-CD3/CD28 for 24 hours. Each cell was pooled from 3 mice per genotype. Data points in (a), (c) - (i) are individual mice. Bars represent means ± SEM, and at least two independent experiments were performed.
Extended Data Fig. 7 |
Extended Data Fig. 7 |. γδ IELs and rAPI5 protect Atg16L1ΔIEC mice against DSS-induced intestinal inflammation.
a-e, Atg16L1f/f (f/f), Atg16L1ΔIEC (ΔIEC), Atg16L1f/f TCRδ−/− (f/f TCRδ−/−), and Atg16L1ΔIEC TCRδ−/− (ΔIEC TCRδ−/−) mice were treated with 5% DSS, and euthanized on day 5. n=7 (f/f), 7 (ΔIEC), 7 (f/f TCRδ−/−), and 7 (ΔIEC TCRδ−/−). a, Quantification of the indicated cytokines in SN harvested from gut explants. b, c, d, e, Representative images of H&E staining (b and d) and quantification of villi length (c) and Paneth cells (e). Scale bar 100 μm (b) and 20 μm (e). f, g, Survival (f) and disease score on day 6 (g) of f/f TCRδ−/− and ΔIEC TCRδ−/− mice injected intravenously with 40 μg/mouse of wild-type or Y8K:Y11K rAPI5 protein on day 0, 3, and 6, while treated with 5% DSS for 6 days. n=9 (f/f TCRδ−/− rAPI5WT), 8 (ΔIEC TCRδ−/− rAPI5WT), 6 (f/f TCRδ−/− rAPI5Y8K:Y11K), and 7 (ΔIEC TCRδ−/− rAPI5Y8K:Y11K). An ANOVA with Tukey’s multiple-comparison test in (a, c, e, g). Mantel-Cox log-rank test in (f). Data points in (a), (c), and (e) are individual mice, and data points in (g) are mean of disease scores of viable mice. Bars represent means ± SEM, and at least two independent experiments were performed.
Extended Data Fig. 8 |
Extended Data Fig. 8 |. Generation and additional characterization of Api5-knockout mice.
a, Schematic strategy for the generation and genotyping of Api5 knockout mouse. The CRISPR-Cas9 gene targeting mixture containing sgRNAs #1 and #2 targeting exon 1 of Api5 and Cas9 mRNA were injected into zygotes generated from Atg16L1f/f females impregnated by Atg16L1ΔIEC males. The 23 resulting chimeras were screened through a PAGE-based genotyping approach in which amplicons generated using the indicated primers and tail DNA from chimeras and wildtype mice as templates were annealed. Heteroduplexes signifying mismatches between the wildtype sequence and the disrupted locus were used to identify 12 candidate knockout mice. Three candidates were selected for further backcrossing and breeding, one of which successfully produced reproductively viable offspring. b, Representative genotyping gel images. Middle gel shows byproducts from first PCR reaction and annealing process using primers from (a). Since Api5+/+ and Api5−/− mice cannot be distinguished by this approach, their PCR products were denatured and annealed with wild-type B6 tail DNA in a second reaction shown in the right gel, which yields multiple bands in the presence of sequence mismatches in Api5−/− and Api5+/− mice but not Api5+/+ mice. c, Sequencing of the Api5 locus from Api5 mutant mice identified a dinucleotide AT insertion after the third codon that causes a frameshift leading to an early stop codon at amino acid position 30. d, Expected and observed number of offspring mice with indicated genotypes from Atg16L1 flox/flox villinCre+ Api5+/− and Atg16L1 flox/flox villinCre Api5+/− breeders. e, Proportion of the indicated IEL subpopulations of the small intestine from Api5+/+and Api5+/− mice. n=3 (Api5+/+) and 3 (Api5+/−). f, g, Representative H&E images (f) and quantification (g) of Paneth cells per organoid from Atg16L1ΔIEC (ΔIEC) mice co-cultured with ~5 × 10⁴ γδ or αβ IELs harvested from Api5+/+ or Api5+/− mice. n=30 per condition. h, i, Representative images (h) and viability (i) of small intestinal organoids from ΔIEC mice. Scale bar 50 μm. In organoid experiments, intestinal crypts were harvested from 3 mice per genotype, and the viability assay was performed in triplicate. An ANOVA with Tukey’s multiple-comparison test in (g, i). Data points in (e) are individual mice, data points in (g) represent individual organoids, and data points in (i) represent organoid viability in each well. Bars represent means ± SEM. At least two independent experiments were performed.
Extended Data Fig. 9 |
Extended Data Fig. 9 |. Additional characterization of mice deficient in ATG16L1 in Paneth cells.
a, Survival of Atg16L1f/f (f/f) and Atg16L1ΔPC (ΔPC) mice treated with 3% DSS ± MNV-infection. n=13 (f/f), 14 (ΔPC), 18 (f/f +MNV) and 14 (ΔPC +MNV). b, c, Representative images of H&E (b) and quantification of Paneth cells (c) of indicated mice euthanized on day 10 post MNV-infection. Arrowheads indicate Paneth cells. n=5 (f/f), 5 (ΔPC), 10 (f/f +MNV) and 12 (ΔPC +MNV). Scale bar 20 μm. d, e, Representative images (d) and quantification of lysozyme staining (e) of indicated mice euthanized on day 10 post MNV-infection. Arrowheads indicate Paneth cells. n=6 (f/f), 5 (ΔPC), 5 (f/f +MNV) and 6 (ΔPC +MNV). Scale bar 20 μm. f, g, Representative images (f) and viability (g) of small intestinal organoids from f/f and ΔPC mice. Scale bar 400 μm. h, Viability of small intestinal organoids from ΔPC mice stimulated ± 20 ng/ml TNFα and/or 20 μM Necrostatin-1 (Nec-1) for 48 hours. i, Viability of small intestinal organoids from ΔPC mice transduced with lentiviruses encoding shRNA targeting Mlkl or nonspecific control and stimulated ± 20 ng/ml TNFα for 48 hours. j, Representative Western blot image of MLKL and β-actin in small intestinal organoids from ΔPC mice after transduction with lentiviruses encoding indicated shRNAs. k, Viability of small intestinal organoids co-cultured for 48 hours with 1 × 10⁵ IELs harvested from naïve WT mice. In organoid experiments, intestinal crypts were harvested from 3 mice per genotype. Mantel-Cox log-rank test in (a). An ANOVA with Tukey’s multiple-comparison test in (c, e, h). Two-sided unpaired Student’s t-test in (g, i, k). Data points in (c) and (e) represent individual mice, data points in (g) are mean of organoid viabilities performed in triplicate, data points in (h), (i), and (k) represent organoid viability in each well. Bars represent means ± SEM, and survival data in (a) are combined results of at least 3 experiments performed independently. At least two independent experiments were performed in (j).
Extended Data Fig. 10 |
Extended Data Fig. 10 |. rAPI5 protects Atg16L1ΔPC mice against DSS-induced intestinal inflammation.
Atg16L1f/f (f/f) and Atg16L1ΔPC (ΔPC) mice were treated with 5% DSS with or without injection of rAPI5 (either rAPI5WT or rAPI5Y8K; Y11K) on day 0, 3, and 6, and euthanized on day 8. n=5 (f/f), 5 (ΔPC), 7 (f/f rAPI5WT), and 6 (ΔPC rAPI5WT), 5 (f/f rAPI5Y8K; Y11K), and 5 (ΔPC rAPI5Y8K; Y11K). a, Quantification of TNFα in SN harvested from gut explants. b, c, d, e, Representative images of H&E staining (b and d) and quantification of villi length (c) and Paneth cells (e). Scale bar 100 μm (b) and 20 μm (e). An ANOVA with Tukey’s multiple-comparison test in (a, c, e). Data points in (b), (c), and (e) are individual mice. Bars represent means ± SEM, and at least two independent experiments were performed.
Fig. 1 |
Fig. 1 |. γδIELs restore Paneth cells and improve viability of ATG16L1-deficient intestinal organoids.
a, Schematic of the organoid-IEL co-culture system. Small intestinal (SI) organoids were derived from Atg16L1f/f (f/f) and Atg16L1ΔIEC (ΔIEC) mice, and IELs were separately harvested from naive or MNV CR6 (persistent strain)-infected wild-type (WT) mice. b, c, Representative images (b) and viability (c) of SI organoids cultured for 48 hours with 1 × 10⁵ IELs from naïve or MNV-infected WT mice. Scale bar 400 μm. d, Viability of SI organoids from ΔIEC mice cultured for 48 hours with 1 × 10⁵ IELs harvested from naïve or MNV-infected WT mice and treated with 0.2 μg/ml anti-TNFα or 20 ng/ml anti-IFNγ antibody. e, f, Representative images (e) and viability (f) of f/f and ΔIEC organoids cultured for 48 hours with 1 × 10⁵ IELs from naïve WT mice or media control. Scale bar 400 μm. g, Bud number per organoid in (e). h-j, Representative hematoxylin and eosin (H&E) images (h), immunofluorescence (IF) microscopy images of lysozyme (red) and DAPI (blue) (i), and frequency of Paneth cells (PCs) normalized to total IECs (j) in organoids cultured for 48 hours with 1 × 10⁵ IELs from naïve WT mice. Scale bar 50 μm. Arrowheads indicate PCs. k, l, Viability of f/f and ΔIEC organoids cultured for 48 hours with 1 × 10⁵ whole (unsorted), 5 × 10⁴ TCRγδ+, or 3 × 10⁴ TCRαβ+ IELs from naïve WT mice (k) or 5 × 10⁴ TCRγδ+ IELs from naïve or MNV-infected WT mice (l). Amount of TCRγδ+ and TCRαβ+ IELs added to the culture reflect their approximate numbers in the unsorted fraction. Intestinal crypts to generate organoids and IELs were harvested from 3 mice per genotype/condition. Viability assays were performed in triplicate. Two-sided unpaired Student’s t-test in (c, f, g). An ANOVA with Tukey’s multiple-comparison test in (d, j, k, l). Data points in (c), (d), (f), (k), and (l) represent organoid viability in each well, and data points in (g) and (j) represent individual organoids. Bars represent means ± SEM, and at least two independent experiments were performed.
Fig. 2 |
Fig. 2 |. API5 secreted from γδIELs promotes viability of ATG16L1-deficient organoids.
a, Viability of SI organoids from Atg16L1f/f (f/f) and Atg16L1ΔIEC (ΔIEC) mice cultured for 48 hours with supernatant (SN) from whole (unsorted), TCRγδ+, and TCRαβ+ IELs from naïve WT mice. b, Venn diagram of proteins detected in LC/MS. c, Western blot (WB) analysis of SN and cell lysate from TCRγδ+ and TCRαβ+ IELs sorted from naïve WT mice and stimulated with anti-CD3/CD28 for 24 hours. Values obtained through densitometric analyses of SN samples shown below. d, e, Representative images (d) and viability (e) of f/f and ΔIEC organoids cultured ± 50 nM recombinant API5 (rAPI5) for 48 hours. Scale bar 25 μm. f, g, h, Representative H&E images (f), IF images of lysozyme (red) and DAPI (blue) (g), and quantification (h) of PC and total IEC number per organoid cultured ± 50 nM recombinant API5 (rAPI5) for 48 hours. Scale bar 50 μm. i, Viability of organoids cultured for 48 hours with indicated SN samples supplemented with growth factors ± 50 nM rAPI5. See Extended Data Fig. 6e for additional information. j, k, Representative images (j) and viability (k) of organoids stimulated ± 20 ng/ml TNFα for 48 hours after pretreatment with 50 nM wild-type rAPI5 for 3 days. Scale bar 200 μm. l, WB analysis of cell death-related proteins of organoids cultured in the presence or absence of rAPI5 for 3 days and stimulated ± 20 ng/ml TNFα for 2 hours on day 3. * denotes non-specific bands. m, WB analysis of RIPK1 and RIPK3 in lysates of ΔIEC organoids cultured and stimulated as in (l), followed by immunoprecipitation with anti-RIPK1 for 6 hours. n, o, Representative IF images (n) of phospho (p)-MLKL (green), lysozyme (red), and DAPI (blue) in ΔIEC organoids stimulated ± 20 ng/ml TNFα for 4 hours after pretreatment with 50 nM wild-type rAPI5 for 3 days, and quantification of p-MLKL+ cells (o, left) and p-MLKL+ lysozyme+ cells (o, right) in organoids. Arrowheads indicate p-MLKL+ lysozyme+ cells. Scale bar 20 μm. p, WB analysis of γδ SN harvested from naïve or MNV-infected WT mice stimulated with anti-CD3/CD28 for 24 hours. Intestinal crypts for organoids were harvested from 3 mice per genotype. Viability assays were performed in triplicate. An ANOVA with Tukey’s multiple-comparison test in (a, h, i, k, o) Two-sided unpaired Student’s t-test in (e). Data points in (a), (e), (i), and (k) represent organoid viability in each well, and data points in (h) and (o) represent individual organoids. Bars represent means ± SEM, and at least two independent experiments were performed.
Fig. 3 |
Fig. 3 |. γδIELs and API5 prevent PC loss and protect against intestinal injury in Atg16L1 mutant mice
a-d, Representative images (a, c) and quantification (b, d) of H&E, TUNEL, and cleaved caspase-3 (CC3) staining (a) and IF images of lysozyme (red) and DAPI (blue) (c) of Atg16L1f/f (f/f), Atg16L1ΔIEC (ΔIEC), Atg16L1f/fTCRδ−/− (f/f TCRδ−/−), and Atg16L1ΔIECTCRδ−/− (ΔIEC TCRδ−/−) mice. Arrowheads indicate PCs or IECs positive for the individual markers. Lysozyme staining in (d) was quantified based on whether PCs displayed a typical staining pattern with distinguishable granules (normal) or depleted and/or diffuse staining (abnormal). n=11 (f/f), 11 (ΔIEC), 10 (f/f TCRδ−/−), and 10 (ΔIEC TCRδ−/−) in (a) and (b), and n=11 (f/f), 9 (ΔIEC), 7 (f/f TCRδ−/−), and 7 (ΔIEC TCRδ−/−) in (c) and (d). Scale bar 20 μm. e, f, Survival (e) and disease score on day 6 (f) of f/f, ΔIEC, f/f TCRδ−/−, and ΔIEC TCRδ−/− mice treated with 5% DSS for 6 days. n=10 (f/f), 10 (ΔIEC), 16 (f/f TCRδ−/−), and 13 (ΔIEC TCRδ−/−). g, WB analysis of SN harvested from gut explants derived from TCRδ+/+ or TCRδ−/− mice. h, i, Representative images (h) and quantification (i) of H&E, TUNEL, and CC3 staining of f/f TCRδ−/− and ΔIEC TCRδ−/− mice injected intravenously with 40 μg/mouse of wild-type or Y8K:Y11K rAPI5 protein. Arrowheads indicate PCs or IECs positive for the individual markers. n=7 (f/f TCRδ−/− rAPI5Y8K:Y11K), 8 (ΔIEC TCRδ−/− rAPI5Y8K:Y11K), 8 (f/f TCRδ−/− rAPI5WT), 10 (ΔIEC TCRδ−/− rAPI5WT). Scale bar 20 μm. j, WB analysis of γδ SN and cell lysates from Api5+/+ or Api5+/− mice and stimulated with anti-CD3/CD28 for 24 hours. k, l, m, n, Representative images (k, m) and quantification (l, n) of H&E images (l) and IF images of lysozyme (red) and DAPI (blue) (n) of Atg16L1f/f Api5+/− (f/f Api5+/−) and Atg16L1ΔIEC Api5+/− (ΔIEC Api5+/−) mice. Arrowheads indicate PCs. n=6 (f/f Api5+/−) and 5 (ΔIEC Api5+/−). Scale bar 20 μm. An ANOVA with Tukey’s multiple-comparison test in (b, d, f, i). Mantel-Cox log-rank test in (e). Two-sided unpaired Student’s t-test in (l, n). Data points in (b), (d), (i), (l), and (n) represent individual mice, data points in (f) are mean of disease scores of viable mice. Bars represent means ± SEM, and survival data in (e) are combined results of 2 experiments performed independently. At least two independent experiments were performed in (g, j).
Fig. 4 |
Fig. 4 |. API5 protects mouse and human PCs against the detrimental effects of ATG16L1 mutation.
a, Survival of Atg16L1f/f (f/f) and Atg16L1ΔPC (ΔPC) mice treated with 5% DSS for 6 days. n=12 (f/f) and 9 (ΔPC). b-f, Representative images of H&E (b, e) and quantification of PCs (c), colon length (d), and colon histopathology score (f) of mice treated as in (a) and euthanized on day 6 post 5% DSS. Arrowheads indicate PCs. n=8 (f/f) and 9 (ΔPC). Scale bar 20 μm (b) and 100 μm (e). g, h, Representative images (g) and viability (h) of SI organoids from f/f and ΔPC mice ± 20 ng/ml TNFα for 48 hours after pretreatment with 50 nM wild-type rAPI5 for 3 days. Scale bar 400 μm. i, j, Survival (i) and disease score on day 6 (j) of f/f and ΔPC mice injected intravenously with 40 μg/mouse of wild-type or Y8K:Y11K rAPI5 protein on day 0, 3, and 6 while treated with 5% DSS for 6 days. 100% survival for f/f, f/f rAPI5WT, ΔPC rAPI5WT, and f/f rAPI5Y8K:Y11K. n=7 (f/f), 8 (ΔPC), n=7 (f/f rAPI5WT), 9 (ΔPC rAPI5WT), n=6 (f/f rAPI5Y8K:Y11K), 7 (ΔPC rAPI5Y8K:Y11K). k, WB analysis of γδ SN and cell lysate sorted from mixed human PBMCs and stimulated with anti-CD3/CD28 for 24 hours. l, m, Representative IF images (l) of TCRγ/δ (green), API5 (red), and DAPI (blue) in terminal ileum derived from Crohn’s disease (CD) patients or non-IBD individuals, and quantification of γδIELs (m, left) and API5+ γδIELs (m, right) near crypts (< 20 μm). Yellow arrowheads indicate TCRγδ+ IEL, and orange ones indicate API5+ TCRγδ IEL. n=15 (non-IBD) and n=18 (CD). Scale bar 20 μm. n, o, Representative images (n) and viability (o) of SI organoids derived from indicated individuals harboring 0–1 (non-risk, NR1–4) or 2 (T300A, R1-4) copies of ATG16L1T300A risk allele. Viability was measured 48 hours after the culture medium was changed to the differentiation medium ± 100 nM wild-type or Y8K:Y11K rAPI5. Scale bar 400 μm. p, q, Representative IF images of lysozyme (red) and DAPI (blue) (p) and quantification of PCs (q) in organoids derived from the indicated individuals as in (o). Arrowheads indicate PCs. Organoids were cultured with the differentiation medium for at least 2 months ± 100 nM wild-type rAPI5. Scale bar 50 μm. In mouse organoid experiments in (h), intestinal crypts were harvested from 3 mice per genotype. Organoid viability assays were performed in triplicate. Mantel-Cox log-rank test in (a, i). Two-sided unpaired Student’s t-test in (c, d, f, m, o, q). An ANOVA with Tukey’s multiple-comparison test in (h, j). Data points in (c), (d), and (f) represent individual mice, data points in (h) represent organoid viability in each well, data points in (j) are mean of disease scores of viable mice, data points in (m) represent individual patients, and data points in (o) and (q) represent individual organoids. Bars represent means ± SEM, and survival data in (a) and (e) are combined results of at least 2 experiments performed independently. At least two independent experiments were performed in (k).

Comment in

References

    1. Cadwell K et al. A key role for autophagy and the autophagy gene Atg16l1 in mouse and human intestinal Paneth cells. Nature 456, 259–263 (2008). 10.1038/nature07416 - DOI - PMC - PubMed
    1. Bevins CL, Stange EF & Wehkamp J Decreased Paneth cell defensin expression in ileal Crohn’s disease is independent of inflammation, but linked to the NOD2 1007fs genotype. Gut 58, 882–883; discussion 883–884 (2009). - PubMed
    1. Liu B et al. Irgm1-deficient mice exhibit Paneth cell abnormalities and increased susceptibility to acute intestinal inflammation. Am J Physiol Gastrointest Liver Physiol 305, G573–584 (2013). 10.1152/ajpgi.00071.2013 - DOI - PMC - PubMed
    1. VanDussen KL et al. Genetic variants synthesize to produce paneth cell phenotypes that define subtypes of Crohn’s disease. Gastroenterology 146, 200–209 (2014). 10.1053/j.gastro.2013.09.048 - DOI - PMC - PubMed
    1. Liu TC, Gao F, McGovern DP & Stappenbeck TS Spatial and temporal stability of paneth cell phenotypes in Crohn’s disease: implications for prognostic cellular biomarker development. Inflamm Bowel Dis 20, 646–651 (2014). 10.1097/01.MIB.0000442838.21040.d7 - DOI - PMC - PubMed

Publication types

MeSH terms