. 2022 Nov;611(7934):105-114.
doi: 10.1038/s41586-022-05288-7. Epub 2022 Oct 5.

Nuclear-embedded mitochondrial DNA sequences in 66,083 human genomes

Affiliations

Nuclear-embedded mitochondrial DNA sequences in 66,083 human genomes

Wei Wei et al. Nature. 2022 Nov.

Abstract

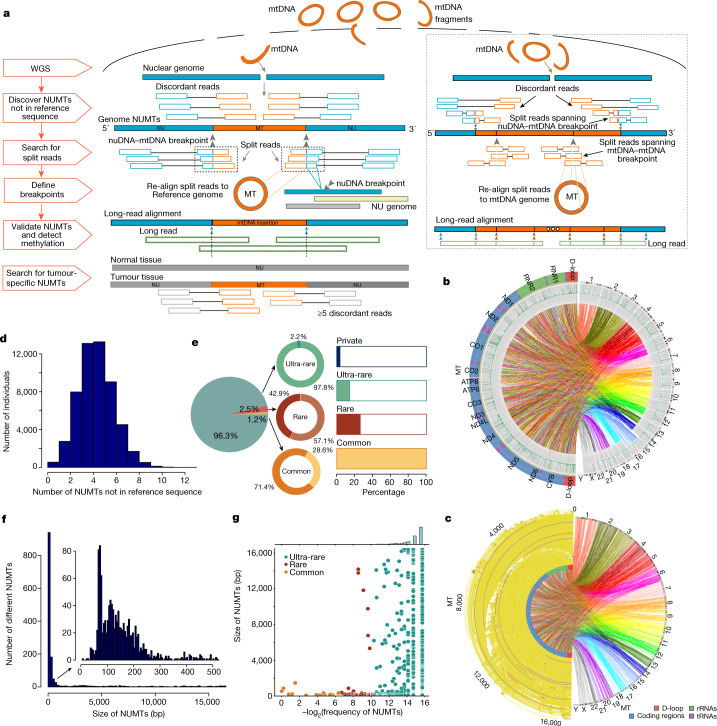
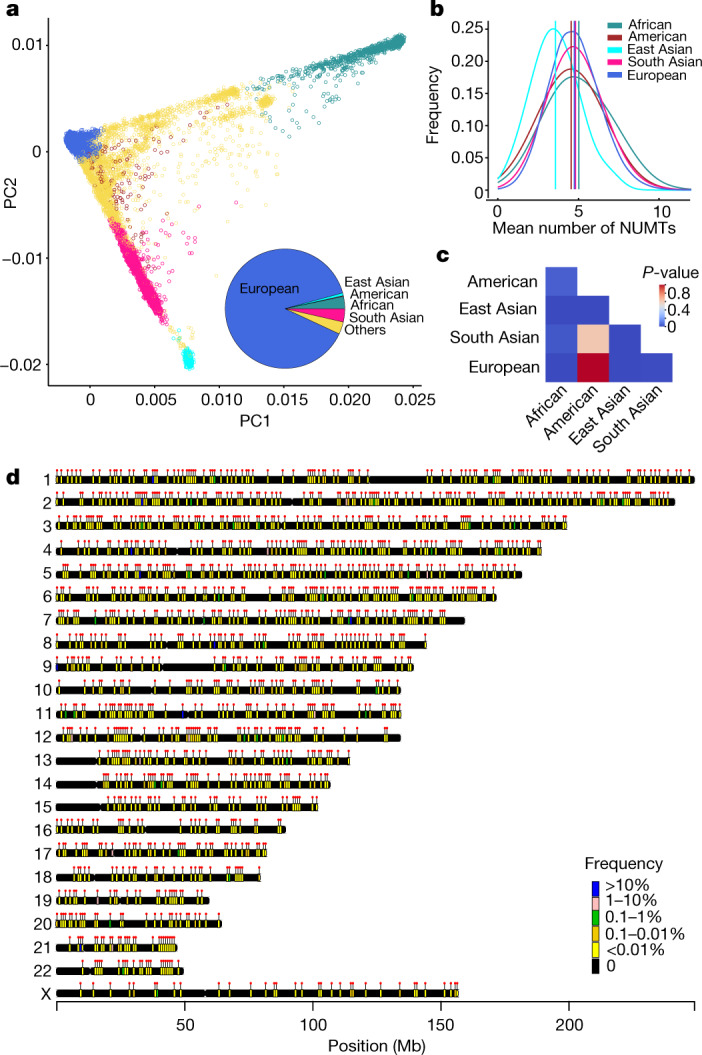
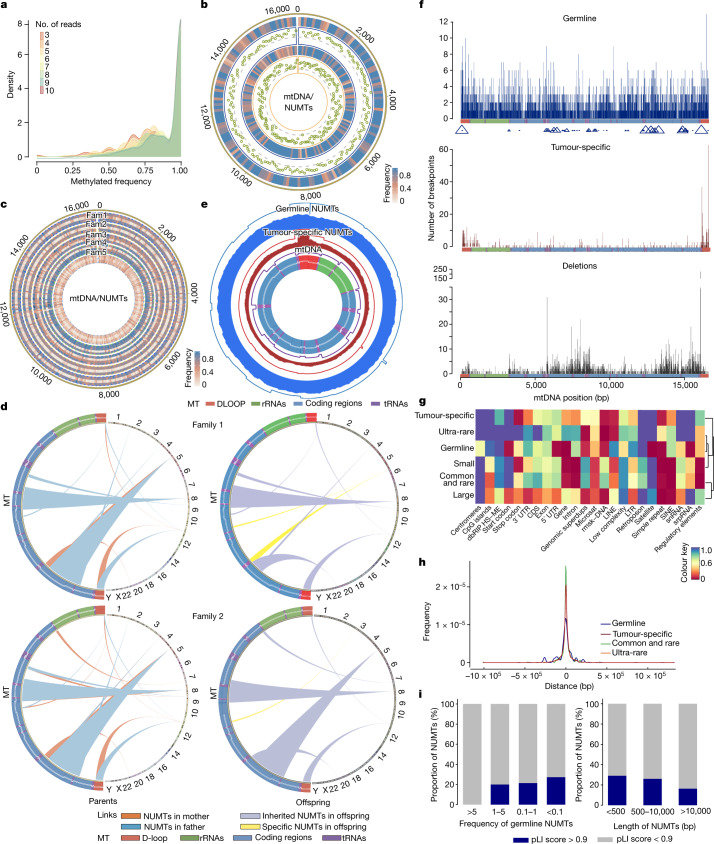
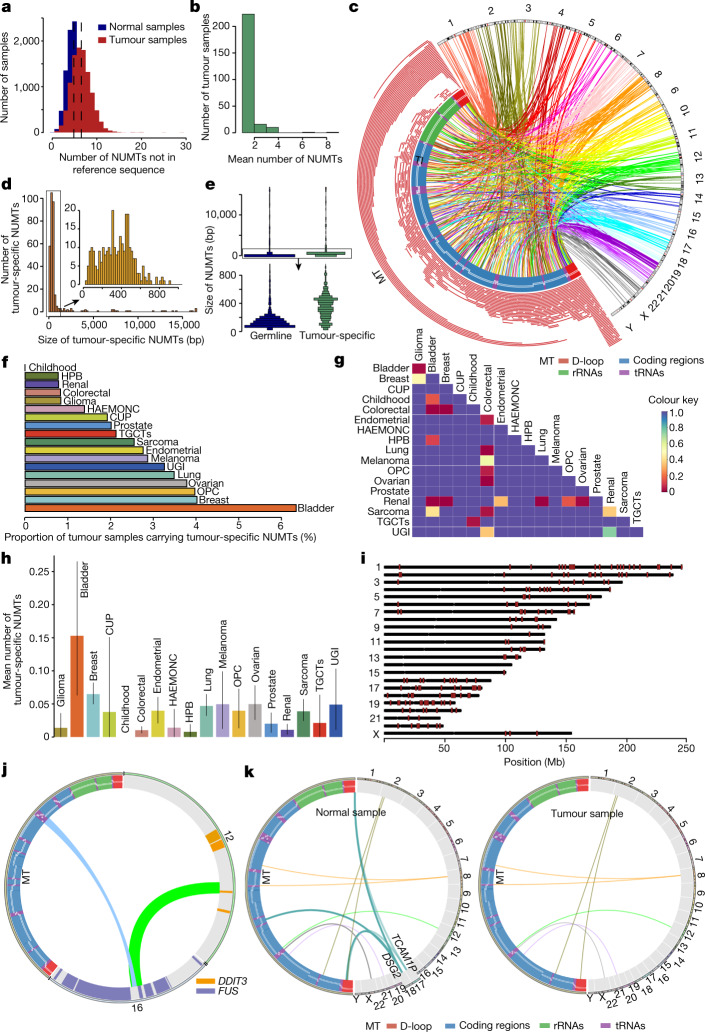
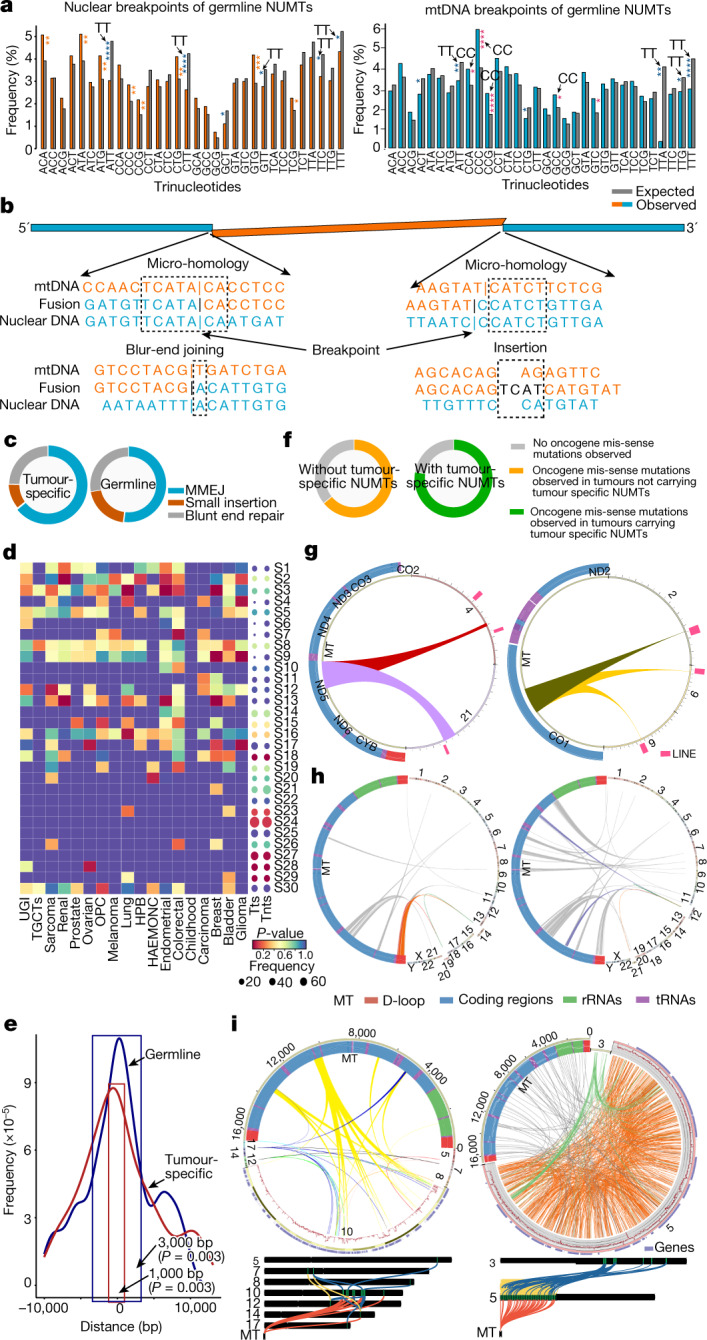
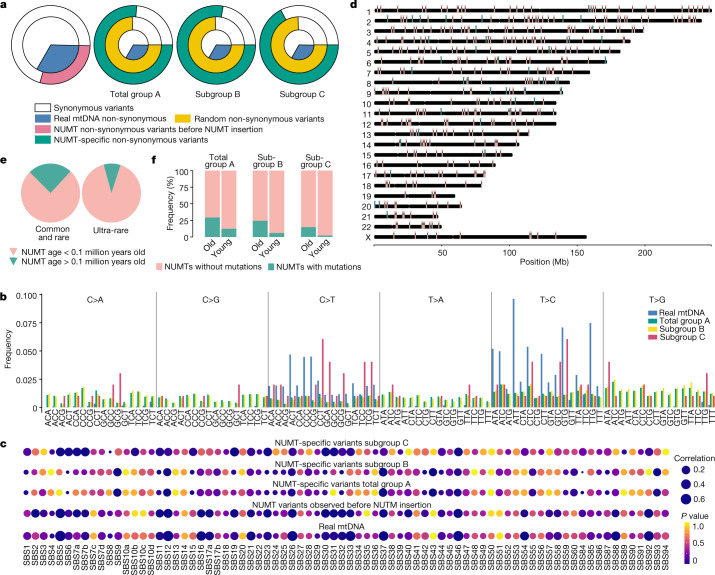
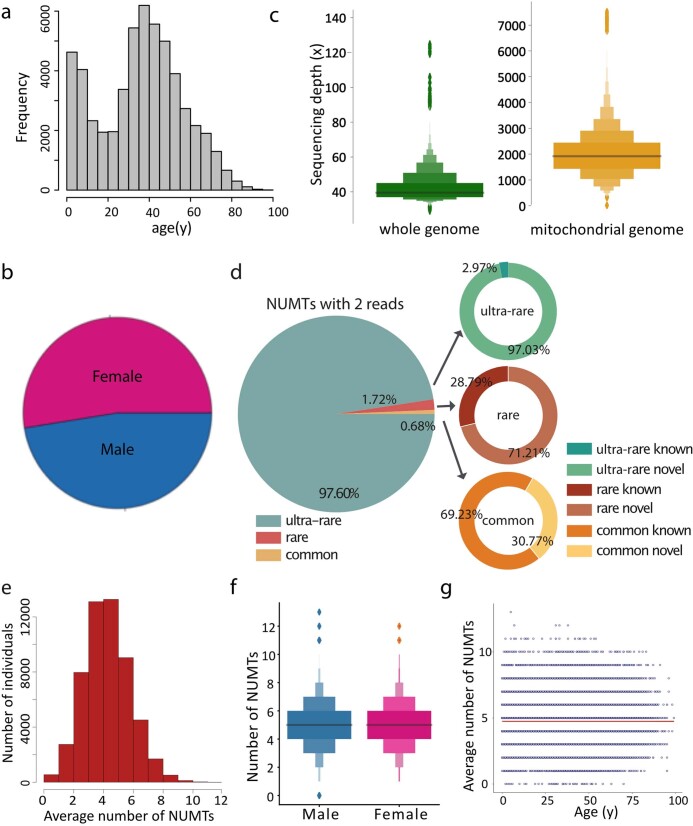
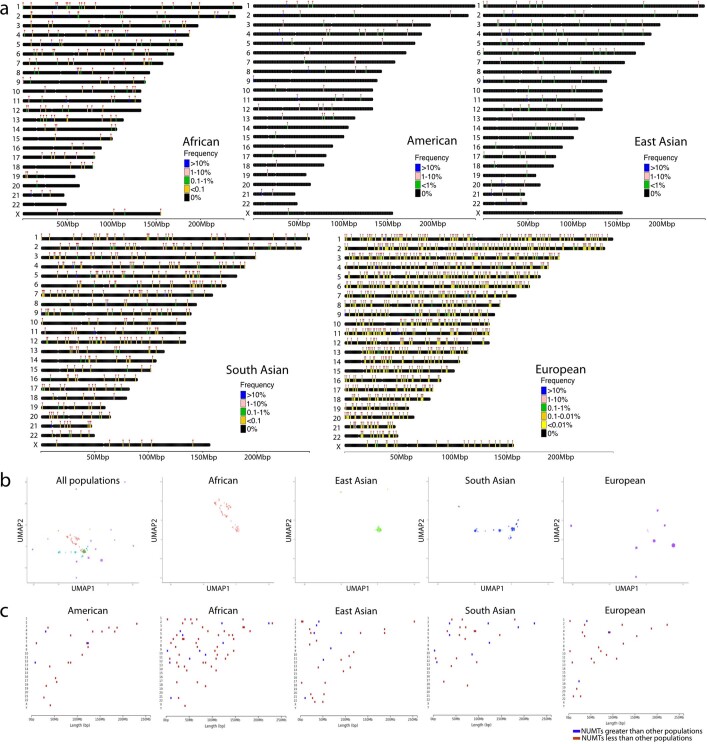
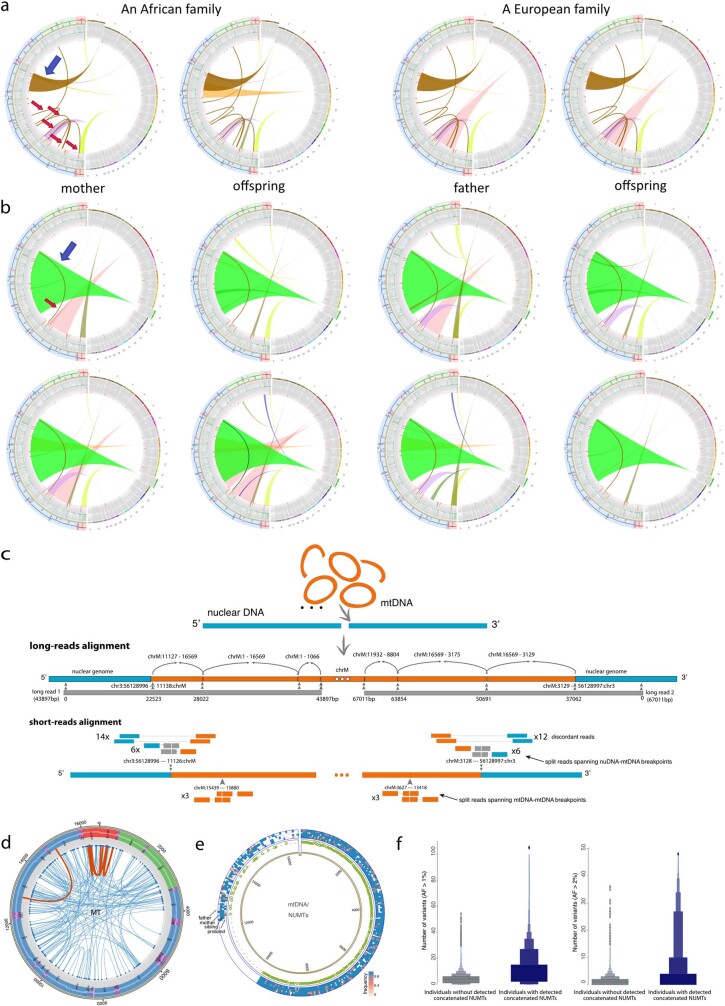
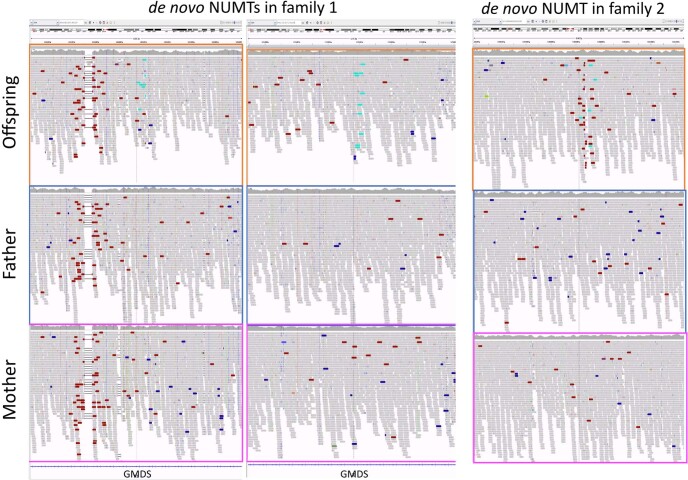
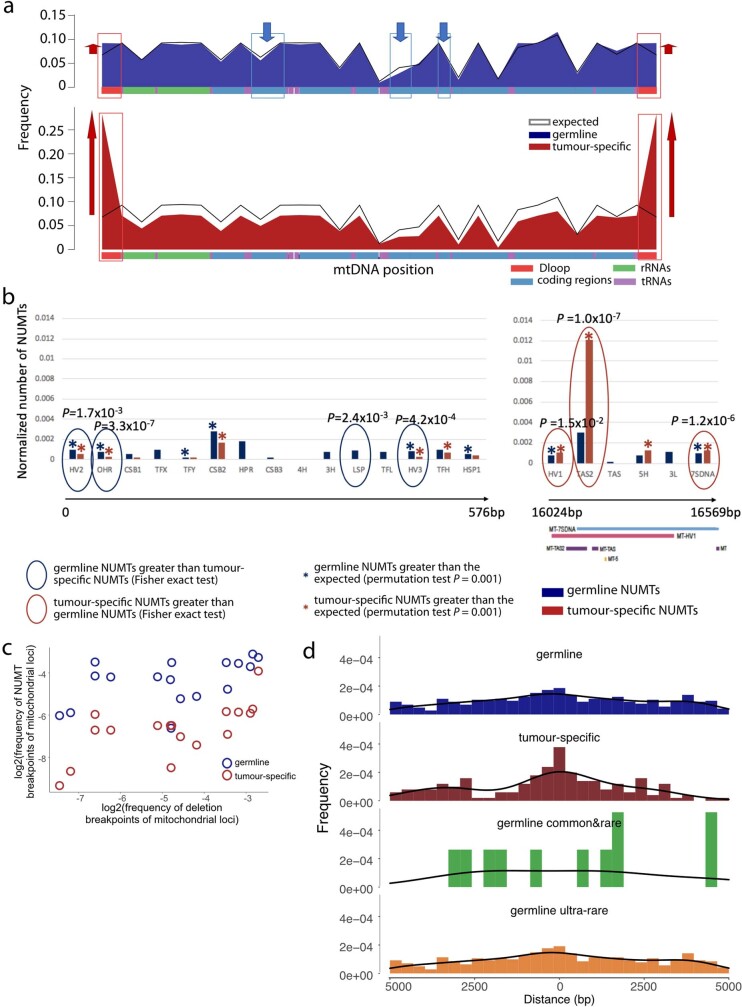
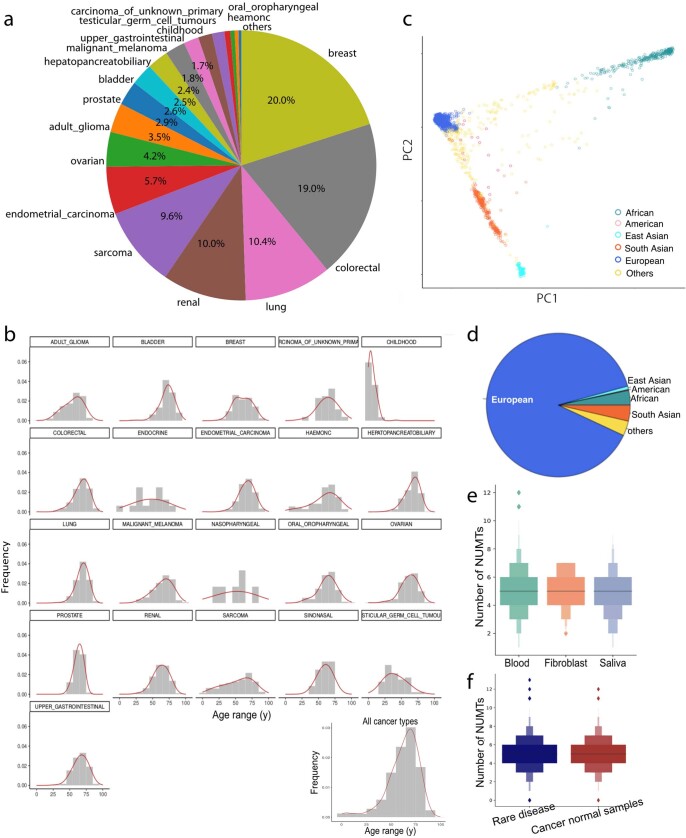
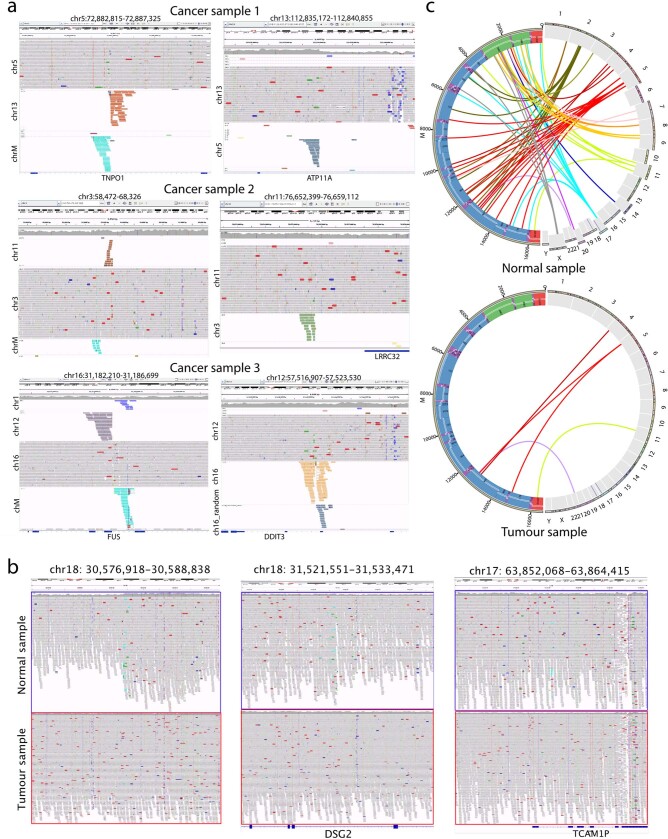
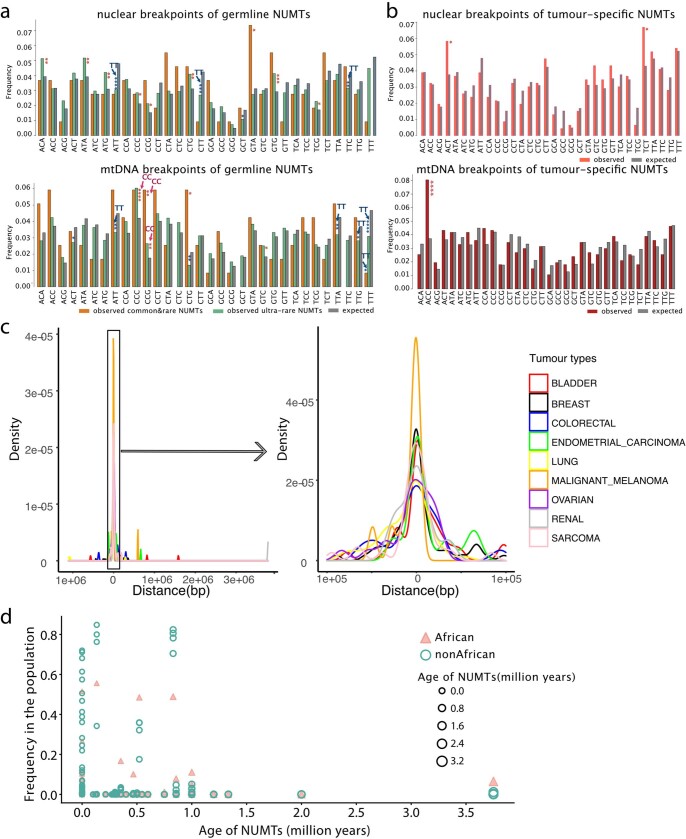
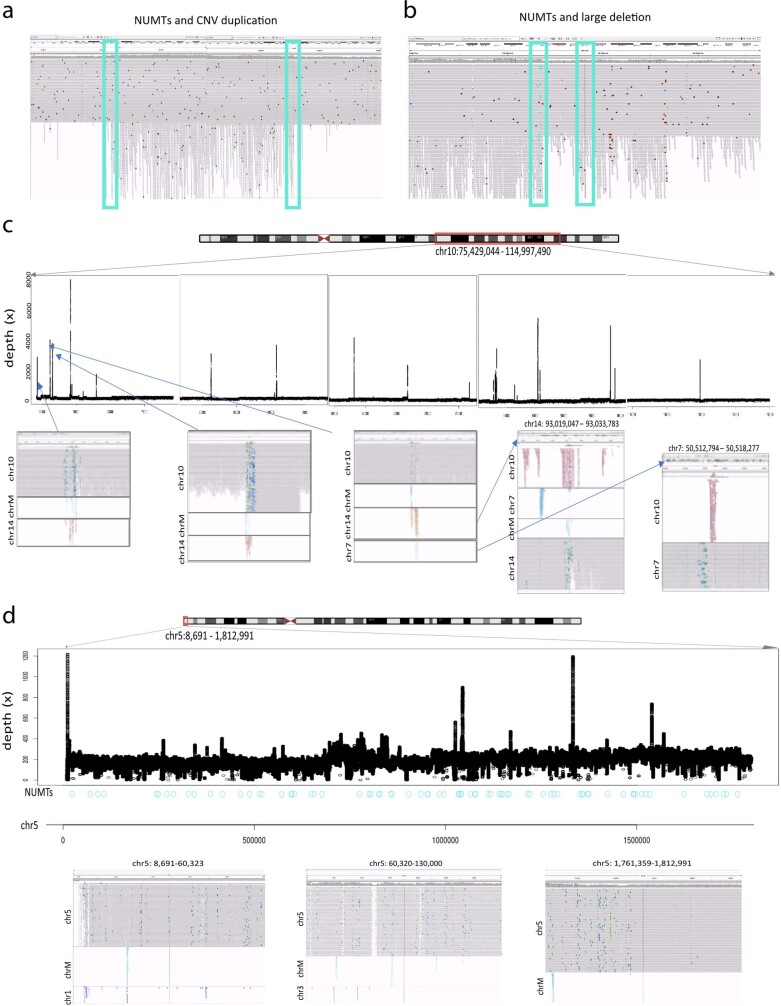
DNA transfer from cytoplasmic organelles to the cell nucleus is a legacy of the endosymbiotic event-the majority of nuclear-mitochondrial segments (NUMTs) are thought to be ancient, preceding human speciation1-3. Here we analyse whole-genome sequences from 66,083 people-including 12,509 people with cancer-and demonstrate the ongoing transfer of mitochondrial DNA into the nucleus, contributing to a complex NUMT landscape. More than 99% of individuals had at least one of 1,637 different NUMTs, with 1 in 8 individuals having an ultra-rare NUMT that is present in less than 0.1% of the population. More than 90% of the extant NUMTs that we evaluated inserted into the nuclear genome after humans diverged from apes. Once embedded, the sequences were no longer under the evolutionary constraint seen within the mitochondrion, and NUMT-specific mutations had a different mutational signature to mitochondrial DNA. De novo NUMTs were observed in the germline once in every 104 births and once in every 103 cancers. NUMTs preferentially involved non-coding mitochondrial DNA, linking transcription and replication to their origin, with nuclear insertion involving multiple mechanisms including double-strand break repair associated with PR domain zinc-finger protein 9 (PRDM9) binding. The frequency of tumour-specific NUMTs differed between cancers, including a probably causal insertion in a myxoid liposarcoma. We found evidence of selection against NUMTs on the basis of size and genomic location, shaping a highly heterogenous and dynamic human NUMT landscape.


Conflict of interest statement

The authors declare no competing interests.

Figures

Fig. 1
Fig. 1. NUMT detection in 53,574 individuals.
a, Bioinformatics pipeline for detecting NUMTs that are not present in the reference sequence, including concatenated NUMTs (boxed). Short reads: mtDNA is shown in orange, nuclear DNA (nuDNA) is shown in blue. Long reads are shown in green. MT, mitochondrial genome; NU genome, nuclear genome. b, 1,637 distinct NUMTs were detected in 53,574 individuals. From the outside: (1) nuclear chromosomes (right) and mtDNA genes (left); (2) frequencies of ultra-rare and rare NUMTs; (3) frequencies of common NUMTs; (4) links connect the mtDNA and nuclear breakpoints. c, mtDNA fragments of the 1,637 distinct NUMTs from 53,574 individuals. Left, size and location of NUMTs on mtDNA. Links connect mtDNA fragments and nuclear insertion site. d, The average number of NUMTs per individual that is not present in the reference sequence and was detected by at least five discordant reads. e, Left, the proportion of NUMTs by population frequency (common, F ≥ 1%; rare, 0.1% ≤ F < 1%; and ultra-rare, F < 0.1%). Middle, donut plots show the proportion of known (darker colour) and newly (lighter colour) identified NUMTs. Right, bar charts show the frequency of individuals carrying common, rare, ultra-rare and private NUMTs. 99.87% of individuals carry at least one common NUMT (F > 1%), 26.2% of individuals carry at least one NUMT with F < 1%, 14.2% of individuals carry at least one NUMT with F < 0.1% and 3.6% of individuals carry at least one private NUMT. f, Size distribution of germline NUMTs. NUMTs smaller than 500 bp are shown in the inset. g, Correlation between NUMT frequency and size.
Fig. 2
Fig. 2. NUMTs in the different populations.
a, Nuclear genotypes at common single nucleotide polymorphisms (SNPs) projected onto two leading principal components (PC1 and PC2). Individuals are coloured according to the assigned ancestry of their nuclear genome. The pie chart shows the proportion of each group overall: East Asian (cyan), South Asian (pink), African (green), American (red), European (blue) and unassigned (yellow). b, The average number of NUMTs detected in populations with different ancestries. Vertical lines show the average number of NUMTs from each population. c, Heat map showing P values from pairwise comparison of the average number of NUMTs detected between populations of different ancestries (two-sided Wilcoxon rank-sum test). d, Chromosomal locations of NUMT insertions detected in this study, coloured by the frequency of NUMTs. Dots show the locations of the NUMTs. Chromosomal locations of different NUMT insertions detected for each ancestry are shown in Extended Data Fig. 2.
Fig. 3
Fig. 3. Characteristics of NUMTs in humans.
a, Methylation frequency of NUMTs in 39 individuals. Colours correspond to the number of long reads that are not affected by the sequencing depth. b, Methylation status of a concatenated NUMT from a father–proband pair. From the outside: (1) methylation frequency of the concatenated NUMT in the father; (2) the ratio of methylation frequency between the NUMT and the non-methylated mtDNA sequence in the father; (3) methylation frequency of the concatenated NUMT in the proband; (4) the ratio of methylation frequency between the NUMT and the non-methylated mtDNA sequence in the proband. Green dots show methylated sites. This analysis includes only reads that were definitively nuclear in origin. The colour corresponds to the methylation frequency. c, Methylation profile for five families (fam1–fam5) with concatenated NUMTs (Supplementary Table 7). From the outside: father, mother, sibling (when available) and proband. Individuals harbouring concatenated NUMTs had higher methylation levels than the individuals without concatenated NUMTs. The colour corresponds to the methylation frequency. d, Three de novo NUMTs from two trios. e, The frequency of mtDNA insertion from germline and tumour-specific NUMTs. From the outside: (1) frequencies of breakpoints from germline NUMTs; (2) frequencies of mtDNA fragments from germline NUMTs; (3) frequencies of breakpoints from tumour-specific NUMTs; (4) frequencies of mtDNA fragments from tumour-specific NUMTs; (5) frequencies of mtDNA sequences expected by chance; (6) mtDNA regions. f, Distribution of breakpoints on mitochondrial genes with germline NUMTs, tumour-specific NUMTs and mitochondrial deletions (window size = 100 bp). The triangle size indicates the frequency of NUMTs within each window. g, P values for enrichment analysis of different genome regions (Supplementary Figs. 1–3 and Methods). Microsat, microsatellite; rmsk-DNA, repetitive DNA; snRNA, small nuclear RNA; srpRNA, signal recognition particle RNA; superdups, superduplications. h, The distance of NUMT locations from the TSS. i, The proportion of NUMTs within genes with high and low pLI scores grouped by NUMT frequency (left) and grouped by NUMT size (right).
Fig. 4
Fig. 4. NUMTs in human cancers.
a, Average number of NUMTs detected per normal and tumour sample that are not present in the reference sequence. b, Average number of tumour-specific NUMTs detected in tumours. c, Tumour-specific NUMTs detected in 12,509 normal–tumour pairs. Left, NUMT size and location on mtDNA. Links connect breakpoints between mtDNA and nuclear genomes. d, Size distribution of tumour-specific NUMTs (red) and tumour-specific NUMTs smaller than 1,000 bp (orange). e, Size distribution of all germline and tumour-specific NUMTs (top) and germline and tumour-specific NUMTs smaller than 1,000 bp (bottom). f, The percentage of different types of tumours with at least one tumour-specific NUMT. g, P values from pairwise comparison of the average number of tumour-specific NUMTs from different tumour types. h, Average number of tumour-specific NUMTs for each tumour type. Data are mean ± s.e.m. Glioma, n = 359; bladder, n = 268; breast, n = 2,038; CUP, n = 52; childhood, n = 170; colorectal, n = 1,934; endometrial, n = 579; HAEMONC, n = 72; HPB, n = 258; lung, n = 1,061; melanoma, n = 244; OPC, n = 151; ovarian, n = 423; prostate, n = 298; renal, n = 1,022; sarcoma, n = 979; TGCTs, n = 47; UGI, n = 184. i, Chromosomal locations of tumour-specific NUMTs, shown as red bars. j, NUMTs involved in FUS–DDIT3 chimeric fusion. NUMTs are shown as a blue link and the FUS–DDIT3 fusion is shown as a green link. The chromosome number and mitochondrial genome are indicated. k, Example of lost NUMTs in a breast tumour sample. The links represent NUMTs detected in either normal (left) or tumour (right) samples. The chromosome number and mitochondrial genome are indicated. CUP, carcinoma of unknown primary; endometrial, endometrial carcinoma; glioma, adult glioma; HAEMONC, haemato-oncology; HPB, hepato-pancreato-biliary cancer; melanoma, malignant melanoma; OPC, oral and oropharyngeal cancers; TGCTs, testicular germ cell tumours; UGI, upper gastrointestinal cancer.
Fig. 5
Fig. 5. Molecular mechanism of NUMT formation.
a, Trinucleotide frequencies around NUMT breakpoints in the nuclear genome (left) and mtDNA (right) (details in Extended Data Fig. 8a). Arrows point to the nCC/CCn or nTT/TTn trinucleotides significantly enriched in NUMTs. *P < 0.05, **P < 0.01, ***P < 0.001, ****P < 0.0001. b, Microhomology-mediated end joining during formation of NUMTs. c, The proportion of microhomology sequences, small insertions and blunt-end joining between nuclear and mtDNA sequences around NUMT breakpoints. d, Cancer signature enrichment for each cancer type (heat map) and all cancer types (dots). Dot size is proportional to the number of samples with each signature in tumour-specific NUMTs (Tts) and non-tumour-specific NUMTs (Tnts). e, The distance between NUMTs and PRDM9-binding sites in germline and tumour-specific NUMTs. f, NUMTs in tumours with and without missense mutations in human DNA repair genes. g, Two examples of the same mtDNA fragment detected at two locations in the nuclear genome, showing evidence that the NUMT inserted into one location and then moved to another. h, Left, an mtDNA fragment inserted into chromosome 14 and 19, and a translocation between chromosome 14 and 19. NUMTs were detected on chromosomes 14 and 19, suggesting that the NUMTs inserted into the nuclear genome before translocation occurred, then moved to another location with the translocation. Right, an mtDNA fragment inserted into chromosome 12, and a translocation between chromosome 12 and 21. NUMTs were seen on chromosome 12, but not on chromosome 21, suggesting that the NUMTs inserted into the nuclear genome after translocation occurred. i, Two examples of samples carrying mito-chromothripsis observed in this study. Circos plots show the locations of NUMTs in both nuclear and mtDNA genomes, and the structural variants in the nuclear genome. Nuclear genome sequencing depth is shown in the red line. Chromosome maps show the structural variants involved in multiple chromosomes in the nuclear genome. The read alignment from Integrated Genomics Viewer is shown in Extended Data Fig. 9c,d.
Fig. 6
Fig. 6. Molecular evolution of NUMT sequences.
a, Synonymous and non-synonymous variants. The proportion of non-synonymous variants from different variant groups are shown as different colours. b, Trinucleotide mutational signatures. c. Correlation of trinucleotide mutational signatures of NUMT variants with cancer signatures. d, Chromosome map of NUMTs estimated to be less than 0.1 million years old (red) and those estimated to be more than 0.1 million years old (blue). e, The proportion of older and younger NUMTs among common and rare, and ultra-rare NUMTs. f, The frequency of NUMTs observed with at least one variant in older and younger NUMTs, and in total group A, subgroup B and subgroup C NUMTs.
Extended Data Fig. 1
Extended Data Fig. 1. Whole genome sequencing in 53,574 individuals from the Genomics England Rare Disease Project and detected NUMT insertions.
a. Histogram of individuals’ age. b. Pie chart of individuals’ sex determined from the rare disease genomes. c. Letter-value plots of sequencing depth of whole genome sequencing (left) and mitochondrial genome sequencing (right) from the rare disease genomes. The middle line represents the median (50th percentile). Each successive level outward contains half of the remaining data. The first two sections out from the centre line contain 50% of the data. The next two sections contain 25% of the data. This continues until at the outlier level. The outliers are plotted as diamonds. d. Overview of the frequencies of the NUMTs detected by at least 2 pairs of discordant reads. Common = population frequency (F) > = 1%; rare = F < 1% but > = 0.1%; ultra-rare F < 0.1% in the population. e. Histogram of the average number of NUMTs per individual that were not present in the reference sequence and were detected by at least 2 pairs of discordant reads. f. Letter-value plots of the average number of NUMTs detected by at least 5 pairs of discordant reads from each individual, male and female shown separately. The middle line represents the median (50th percentile). Each successive level outward contains half of the remaining data. The first two sections out from the centre line contain 50% of the data. The next two sections contain 25% of the data. This continues until at the outlier level. The outliers are plotted as diamonds. g. Correlation of individual age and the average number of NUMTs detected. Regression line shown in red.
Extended Data Fig. 2
Extended Data Fig. 2. NUMTs detected in the different populations.
a. Chromosome map of NUMTs detected in African, American, East Asian, South Asian and European genomes. Chromosomal locations of different NUMT insertions coloured by the frequency (F) of NUMTs. Dots show the locations of the NUMTs. b. A uniform manifold approximation and projection (UMAP) of germline NUMTs in all populations and 4 sub-populations. c. Chromosomal locations of NUMTs were significantly greater / less detected in the different populations.
Extended Data Fig. 3
Extended Data Fig. 3. Concatenated NUMTs and long-read sequencing validation.
a. Circos plots show 4 individuals from 2 families shared 5 mtDNA-mtDNA breakpoints which were exclusively present in 4 individuals, and also shared an ultra-rare NUMT insertion which was only seen in the same 4 individuals. b. Circos plots show 8 individuals shared 1 mtDNA-mtDNA breakpoint which was exclusively present in these 8 individuals, and also shared a NUMT insertion which was only seen in the same 8 individuals. Blue arrows point to the shared NUMTs. Red arrows point to the shared mtDNA-mtDNA breakpoints. c. Model showing the formation of concatenated NUMTs and our strategy for their detection using both long-read sequencing and short-read sequencing. mtDNA and nuclear genome sequences are shown in orange and blue. Reads mapped to both mtDNA and nuclear genome sequences are shown in grey, mapped to only mtDNA sequences are in orange and mapped to only nuclear genome sequences in blue. d. Circos plot of mtDNA-mtDNA breakpoints detected in the rare disease genomes. mtDNA-mtDNA breakpoints were detected by split reads mapping only to mtDNA. Complex concatenated NUMTs contain multiple mtDNA fragments. Detection of mtDNA-mtDNA breakpoints support the putative concatenated NUMTs. Common and rare mtDNA-mtDNA breakpoints (frequency > = 0.1%) shown in red links. Ultra-rare mtDNA-mtDNA breakpoints (frequency < 0.1%) shown in blue links. e. Circos plot shows the methylation frequency of a rare NUMT (insertion mt.12314 – 9526 bp, frequency  = 0.26%) detected in 4 members from the same family (father, mother, sibling and proband). Circles from the outside to the inside indicate the following: (1) methylation frequency of NUMTs detected by split long-reads in father, mother, sibling and proband, (2) ratio of methylation frequency between NUMTs and “true” mtDNA sequences in all 4 family members. Green dots were the sites methylated in NUMTs. Colour key corresponds to the methylation frequencies. f. Letter-value plots of the average number of observed mtDNA variants (left – variant frequency > 1%, right - variant frequency > 2%), individuals carrying putative concatenated NUMTs and without putative concatenated NUMTs shown, separately. Variants observed in the individuals carrying putative concatenated NUMTs are mixed variants from both mtDNA sequence and NUMTs. The middle line represents the median (50th percentile). Each successive level outward contains half of the remaining data. The first two sections out from the centre line contain 50% of the data. The next two sections contain 25% of the data. This continues until at the outlier level. The outliers are plotted as diamonds.
Extended Data Fig. 4
Extended Data Fig. 4. IGV alignment of de novo NUMTs in the rare disease genomes.
Integrative Genomics Viewer (IGV) screenshots show the aligned reads corresponding to three de novo NUMTs observed in two families. Teal bars indicate the aligned reads which mapped to the nuclear DNA where their mates mapped to the mtDNA. In family 1, offspring carried two NUMTs within the same gene, but not seen in either of the parents. In family 2, offspring carried a NUMT which was not seen in either of the parents.
Extended Data Fig. 5
Extended Data Fig. 5. Frequency of NUMT breakpoints on mtDNA genome and the distance of NUMT location to nuclear transcription start sites (TSS).
a. Normalized frequency of NUMT breakpoints in each mtDNA region. Black lines are expected frequency. Top blue area plot shows the frequency of breakpoints from germline NUMTs. Bottom red area plot shows the frequency of breakpoints from tumour-specific NUMTs. Mitochondrial regions are shown in the different colours at the bottom of each plot. Red boxes highlight the regions where the frequencies were significantly greater than the expected by chance. Blue boxes highlighted the regions where the frequencies significantly less than the expected by chance. b. Normalized number of NUMTs within each Dloop region. Stars represent the NUMTs were significantly enriched in each region (permutation test). Circles labelled P values were from the comparison of germline and tumour-specific NUMTs (two-sided Fisher’s exact test). c. Correlation of frequencies of deletion breakpoints and NUMT breakpoints in each mtDNA region from germline and tumour-specific NUMTs. d. Histogram of distance of NUMTs location to transcription start sites (TSS). Germline, germline common & rare, ultra-rare and tumour-specific NUMTs are shown, separately.
Extended Data Fig. 6
Extended Data Fig. 6. Whole genome sequencing in 12,509 normal-tumour pairs from the Genomics England Cancer Project and detected NUMT insertions.
a. Pie chart of proportion of sample size from each cancer type included in this study. b. Histogram of tumour donor age from all cancer types (bottom right) and each cancer type. c. Projection of the nuclear genotypes at common SNPs onto the two leading principal components (PC1 and PC2) computed with the 1000 Genomes dataset from the cancer genomes, with individuals coloured by their assigned nuclear ancestry. d. Proportion of sample size from each population in the cancer genomes. e. Number of NUMTs detected in the different tissue types from the matched normal tissue samples taken from cancer participants. The middle line represents the median (50th percentile). Each successive level outward contains half of the remaining data. The first two sections out from the centre line contain 50% of the data. The next two sections contain 25% of the data. This continues until at the outlier level. The outliers are plotted as diamonds. f. Number of NUMTs detected in the rare disease blood samples and the matched normal tissue samples taken from cancer participants. The middle line represents the median (50th percentile). Each successive level outward contains half of the remaining data. The first two sections out from the centre line contain 50% of the data. The next two sections contain 25% of the data. This continues until at the outlier level. The outliers are plotted as diamonds.
Extended Data Fig. 7
Extended Data Fig. 7. Examples of IGV alignment of NUMTs.
a. Examples of IGV alignment of tumour-specific NUMTs coupled with other translocation variations in the nuclear genome. Teal bars indicate the aligned reads which mapped to the nuclear DNA where their mates mapped to the mtDNA. Other non-grey colour bars indicate the aligned reads which mapped to one nuclear chromosome where their mates mapped to a different nuclear chromosome. For example, Cancer sample 1 had one NUMT (teal bars) on chromosome 5 and another translocation variation between chromosome 5 and chromosome 13 (orange bars) in the same region (left). The same translocation variation was also seen on chromosome 13 (right). The aligned reads mapped to chromosome 13 where their mates mapped to chromosome 5 (steel blue bars). b. An example of IGV alignment of tumour lost NUMTs. IGV screenshots show the aligned reads corresponding to the lost NUMTs in one breast tumour sample. Teal bars indicate the aligned reads which mapped to the nuclear DNA where their mates mapped to the mtDNA. NUMTs only present in the matched normal sample but not in the tumour sample, with the average sequencing depth of tumour sample (128x) was more than three-times deeper than the matched normal sample (40x). c. Cirocs plot illustrates an example of lost NUMT in a haematological tumour sample. The links represent all NUMTs detected in either normal sample or tumour sample. The tumour sample lost many NUMTs across the whole genome, with the average sequencing depth of tumour sample (116x) was more than twice deeper than the matched normal sample (40x).
Extended Data Fig. 8
Extended Data Fig. 8. NUMT nuclear breakpoints, relation to PRDM9 binding sites, and NUMT age.
a. Frequencies of trinucleotides around germline NUMTs breakpoints. The breakpoints of nuclear genome are shown at the top and mtDNA genomes at the bottom, common&rare, ultra-rare NUMTs and the expected frequencies shown in the different colours. Trinucleotides of breakpoint flanks more likely occurred in nCC/CCn on mtDNA genome and less likely in nTT/TT on both nuclear and mtDNA genomes, particularly for ultra-rare NUMTs. The same trend was not seen in the tumour-specific NUMTs (b), indicating the signal is driven by biology, but not the sequencing artefacts. b. Frequencies of trinucleotides around tumour-specific NUMTs breakpoints in the nuclear genome (top) and mtDNA genomes (bottom), tumour-specific NUMTs and the expected frequencies shown in the different colours. P values # < 0.1, * < 0.05, < 0.01 **, < 0.001 ***, < 0.0001 **** (two-sided Fisher’s exact test) (Supplementary Table 6). c. Distribution of the distance between PRDM9 binding sites and tumour-specific NUMTs within each tumour type. d. Age of NUMTs estimated in this study. Y axis shows the frequencies of NUMTs in African and non-African populations. The frequencies of NUMTs were different between African and non-African, particularly for the older NUMTs which were more common seen in African population.
Extended Data Fig. 9
Extended Data Fig. 9. IGV alignments of NUMTs and nuclear chromosomal structure variations.
a. An example of mtDNA fragment inserted into two edges of a CNV duplication. b. An example of mtDNA fragment inserted into two edges of a large deletion. Teal bars indicate the aligned reads which mapped to the nuclear DNA where their mates mapped to the mtDNA, and were highlighted in the teal. c. d. Two examples of cancer genomes carrying mito-chromothripsis observed in this study. c. The sequencing depth of nuclear genome is shown at the top panel. Examples of the read alignment of NUMTs from IGV are shown at the bottom. Reads are coloured by the pair orientation and the chromosome on which their mates can be found. d. The sequencing depth of nuclear genome is shown at the top panel. Teal dots are the locations of NUMT insertions. Examples of the read alignment of NUMTs from IGV are shown at the bottom. Reads are coloured by the pair orientation and the chromosome on which their mates can be found.

References

    1. Roger AJ, Munoz-Gomez SA, Kamikawa R. The origin and diversification of mitochondria. Curr. Biol. 2017;27:R1177–R1192. doi: 10.1016/j.cub.2017.09.015. - DOI - PubMed
    1. Gray MW, Burger G, Lang BF. Mitochondrial evolution. Science. 1999;283:1476–1481. doi: 10.1126/science.283.5407.1476. - DOI - PubMed
    1. Hazkani-Covo E, Zeller RM, Martin W. Molecular poltergeists: mitochondrial DNA copies (numts) in sequenced nuclear genomes. PLoS Genet. 2010;6:e1000834. doi: 10.1371/journal.pgen.1000834. - DOI - PMC - PubMed
    1. Lopez JV, Yuhki N, Masuda R, Modi W, O'Brien SJ. Numt, a recent transfer and tandem amplification of mitochondrial DNA to the nuclear genome of the domestic cat. J. Mol. Evol. 1994;39:174–190. doi: 10.1007/BF00163806. - DOI - PubMed
    1. Wei W, et al. Nuclear-mitochondrial DNA segments resemble paternally inherited mitochondrial DNA in humans. Nat. Commun. 2020;11:1740. doi: 10.1038/s41467-020-15336-3. - DOI - PMC - PubMed

Publication types