. 2022 Oct;610(7931):366-372.
doi: 10.1038/s41586-022-05169-z. Epub 2022 Oct 5.

Collagenolysis-dependent DDR1 signalling dictates pancreatic cancer outcome

Affiliations

Collagenolysis-dependent DDR1 signalling dictates pancreatic cancer outcome

Hua Su et al. Nature. 2022 Oct.

Erratum in

Abstract

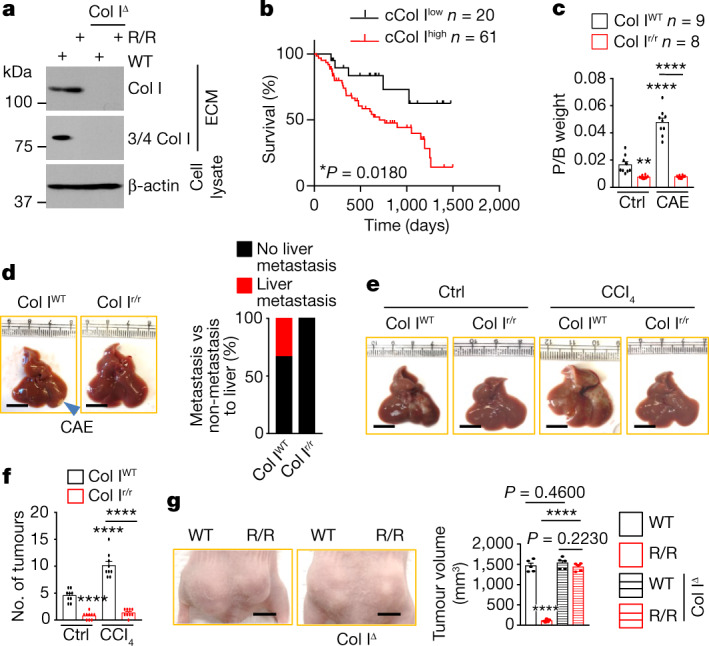
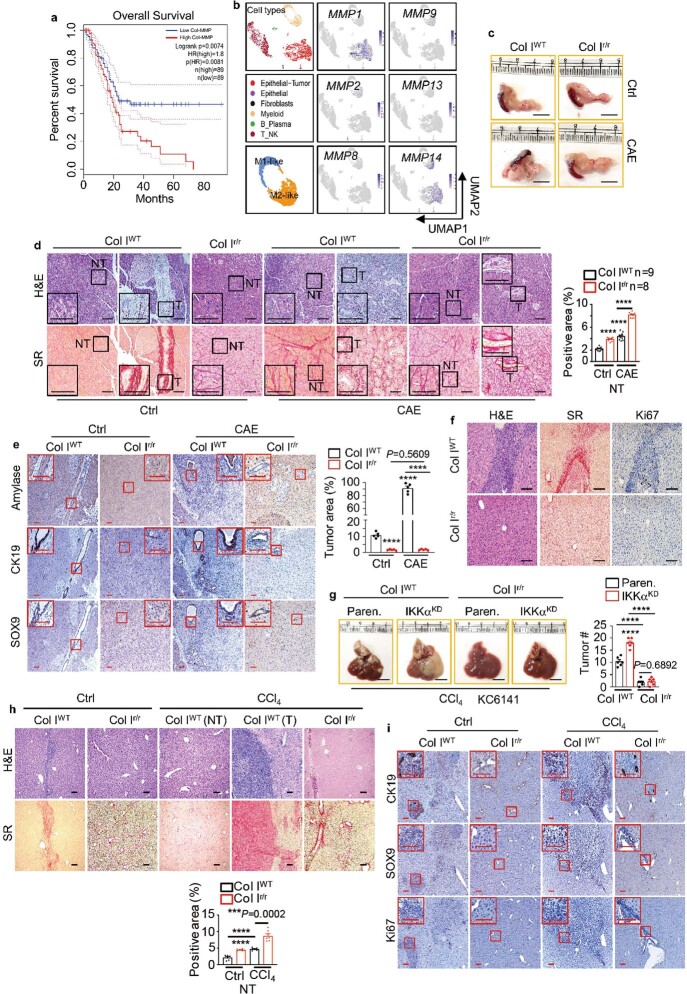
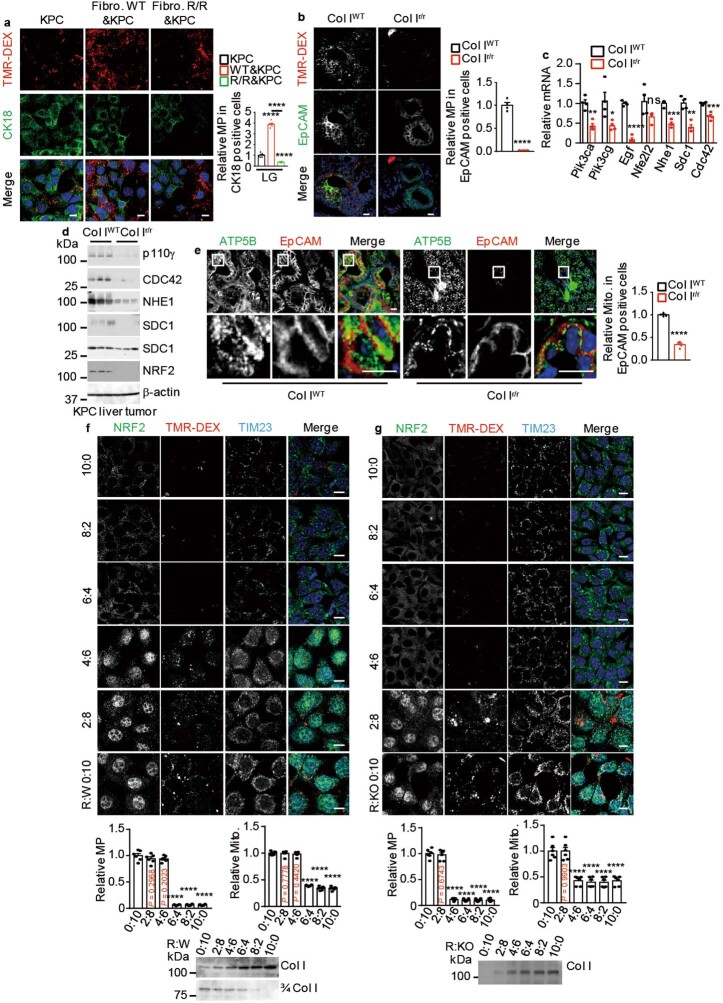
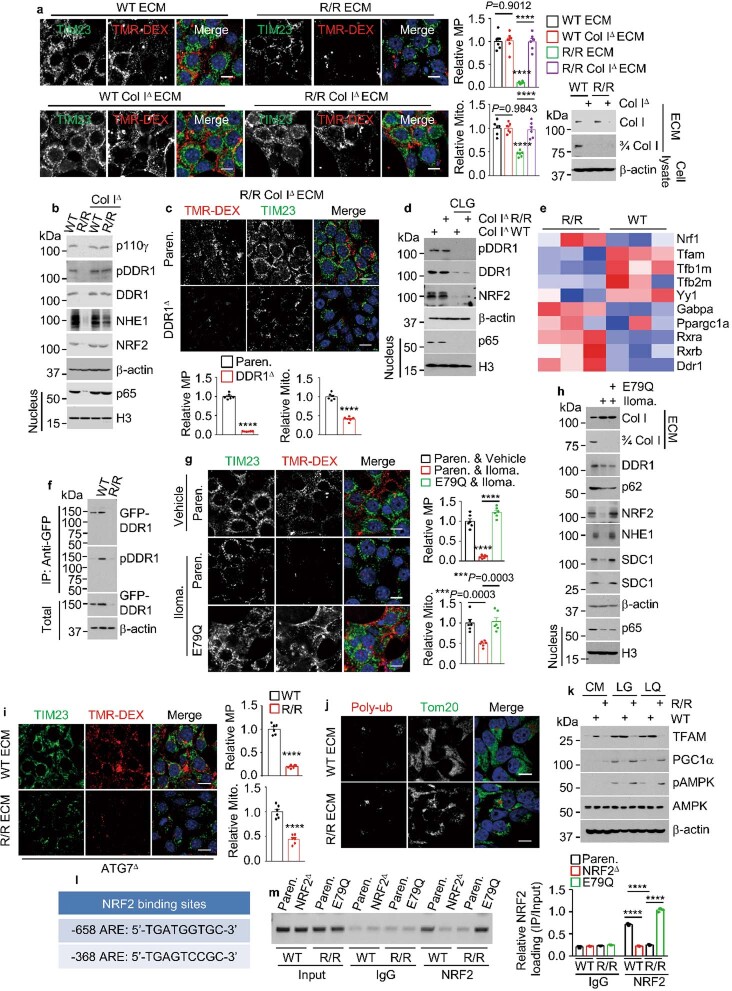
Pancreatic ductal adenocarcinoma (PDAC) is a highly desmoplastic, aggressive cancer that frequently progresses and spreads by metastasis to the liver1. Cancer-associated fibroblasts, the extracellular matrix and type I collagen (Col I) support2,3 or restrain the progression of PDAC and may impede blood supply and nutrient availability4. The dichotomous role of the stroma in PDAC, and the mechanisms through which it influences patient survival and enables desmoplastic cancers to escape nutrient limitation, remain poorly understood. Here we show that matrix-metalloprotease-cleaved Col I (cCol I) and intact Col I (iCol I) exert opposing effects on PDAC bioenergetics, macropinocytosis, tumour growth and metastasis. Whereas cCol I activates discoidin domain receptor 1 (DDR1)-NF-κB-p62-NRF2 signalling to promote the growth of PDAC, iCol I triggers the degradation of DDR1 and restrains the growth of PDAC. Patients whose tumours are enriched for iCol I and express low levels of DDR1 and NRF2 have improved median survival compared to those whose tumours have high levels of cCol I, DDR1 and NRF2. Inhibition of the DDR1-stimulated expression of NF-κB or mitochondrial biogenesis blocks tumorigenesis in wild-type mice, but not in mice that express MMP-resistant Col I. The diverse effects of the tumour stroma on the growth and metastasis of PDAC and on the survival of patients are mediated through the Col I-DDR1-NF-κB-NRF2 mitochondrial biogenesis pathway, and targeting components of this pathway could provide therapeutic opportunities.


Conflict of interest statement

The authors declare no competing interests.

Figures

Fig. 1
Fig. 1. Col I cleavage controls PDAC growth.
a, Immunoblot showing the specificity of antibodies to iCol I and cCol I (3/4 Col I) in ECM produced by the indicatedfibroblasts. Col IΔ, Col I knockout; WT, wild type. b, Overall survival of patients with resected PDAC stratified according to cCol I expression (shown in Fig. 5a). Significance was determined by log-rank test. c, Pancreas weight relative to body weight (P/B weight) four weeks after orthotopic KPC cell transplantation into Col IWTor Col Ir/rmice that were pretreated with CAE or without CAE. Ctrl, control. d, Liver morphology in CAE-treated mice. Liver metastases were detected in 33% of Col IWTmice. e,f, Liver gross morphology (e) and tumour numbers (f) two weeks after intrasplenic transplantation of KPC cells into Col IWTor Col Ir/rmice with or without CClpretreatment. g, Representative images and sizes of subcutaneous tumours formed by human 1305 cells co-transplanted with WT, R/R or Col IΔ WT or R/R fibroblasts into Nu/Nu mice. Data in f (n = 9 mice), g (n = 5 mice) and c are mean ± s.e.m. Statistical significance determined by two-tailed t-test. Exact values in c,f are shown in the Source Data. ****P < 0.0001. Scale bars (d,e,g), 1 cm. Source data
Fig. 2
Fig. 2. Col I cleavage controls PDAC metabolism.
ac, Genes differentially expressed between KPC cells grown on wild-type or R/R ECM in LG (0.5 mM) medium for 24 h. Blue, replicates with low expression (z-score = −2); red, replicates with high expression (z-score = 2). Mitochondrial ETC genes (a), mitochondrial ribosome subunit genes (b) and macropinocytosis-related and NRF2-target genes (c). d,e, Fractional labelling (mole per cent enrichment) of TCA cycle intermediates (d) and intracellular amino acids (e) in KPC cells incubated for 24 h in LG medium after plating on [U-13C]-glutamine-labelled wild-type or R/R ECM. α-KG-, α-ketoglutarate. f, KPC cells plated on wild-type or R/R ECM or plastic were incubated in CM or LG medium with or without EIPA, MBQ-167 (MBQ), MRT68921 (MRT), EIPA + MRT or MBQ + MRT for 24 h. Total cellular ATP is presented relative to untreated plastic-plated cells. CM, complete medium. Data in d,e (n = 3 per condition) and f (n = 3 independent experiments) are mean ± s.e.m. Statistical significance determined by two-tailed t-test. Exact values are shown in the Source Data. ***P < 0.001; ****P < 0.0001. Source data
Fig. 3
Fig. 3. Col I cleavage controls macropinocytosis and the number of mitochondria in PDAC.
a, Representative images and rates of macropinocytosis (MP) in TMR-DEX-incubated KPC and MIA PaCa-2 cells grown on plates with or without wild-type or R/R ECM and incubated in LQ or LG medium for 24 h. b, Immunoblot analysis of the indicated proteins in KPC cells treated as in a. c, Representative images of mitochondria (TIM23) in KPC cells grown on plates with or without wild-type or R/R ECM and incubated in LG medium for 24 h. Bottom left, quantification of the number of mitochondria. d, Immunoblot analysis of the indicated proteins in KPC cells treated as in c. Results in a,c (n = 6 fields) are mean ± s.e.m. Statistical significance determined by two-tailed t-test. ****P < 0.0001. Scale bars (a,c), 10 μm. Source data
Fig. 4
Fig. 4. The Col I–DDR1–NRF2 axis controls macropinocytosis and mitochondrial biogenesis.
a, Representative images and quantification of mitochondria and macropinocytosis in TMR-DEX-incubated parental and variant KPC cells grown on wild-type ECM. b, Immunoblot analysis of the indicated proteins in KPC cells grown on plastic or wild-type or R/R ECM and incubated in LG or LQ medium for 24 h. The effects of wild-type and R/R ECM on DDR1 signalling are summarized on the right. mito., mitochondria; pDDR1, phosphorylated DDR1. c, Representative images and quantification of mitochondria and macropinocytosis in TMR-DEX-incubated parental and NRF2E79Q (E79Q) KPC cells plated on wild-type or R/R ECM in LG medium with or without 7rh or ML120B for 24 h. d, Immunoblot analysis of the indicated proteins in parental, E79Q, DDR1Δ and E79Q/DDR1Δ KPC cells plated with or without wild-type or R/R ECM and incubated in LG medium for 24 h. e, Representative IHC of the indicated proteins in Col IWT and Col Ir/r pancreata four weeks after KPC cell transplantation. Boxed areas are further magnified. Scale bars, 100 μm. f, Immunoblot analysis of the indicated proteins in KPC cells plated on wild-type or R/R ECM and incubated in LG medium with or without + MG132 or chloroquine (CQ) for 24 h. g, Representative images showing GFP–DDR1 and polyubiquitin (polyub) colocalization in GFP–DDR1-expressing 1305 cells co-cultured with wild-type or R/R fibroblasts in LG medium for 24 h. Boxed areas are further magnified. Data in a,c (n = 6 fields) are mean ± s.e.m. Statistical significance determined by two-tailed t-test. Exact P values are shown in the Source Data. ****P < 0.0001; NS, not significant. Scale bars (a,c,g), 10 μm. Source data
Fig. 5
Fig. 5. Col I cleavage and increased DDR1–NRF2 signalling predict poor patient survival.
a, Representative IHC of 106 resected human PDAC tissues. H&E, haematoxylin and eosin. Boxed areas are further magnified. Scale bars, 100 μm. b, Comparisons of overall survival between patients stratified according to cCol I, DDR1 and NRF2 expression. Significance was determined by log-rank test. Source data
Fig. 6
Fig. 6. Therapeutic targeting of the DDR1–NF-κB–NRF2 axis inhibits PDAC growth and metabolism.
a, Parental and E79Q KPC cells plated on wild-type or R/R ECM were incubated in LG medium with or without 7rh, ML120B or ML385. Total viable cells are presented relative to parental cells that were treated with vehicle and plated on wild-type ECM. b, Oxygen consumption rate (OCR) of parental and E79Q KPC cells plated on wild-type or R/R ECM and incubated in LG medium for 24 h before and after treatment with oligomycin (Omy), FCCP or rotenone/antimycin A. c, Representative images and sizes of parental and NHE1KD MIA tumours grown with or without wild-type or R/R fibroblasts in nude mice. Right, immunoblot analysis of NHE1 in MIA cells. d,e, Liver and pancreas morphology (d) and weight (e) four weeks after orthotopic transplantation of KPC E79Q cells into CAE-pretreated Col IWT and Col Ir/r mice. f, IHC of pancreatic sections from the mice in d,e. Boxed areas are further magnified. Scale bars, 100 μm. g, P/B weight four weeks after orthotopic transplantation of the indicated KPC cells into Col IWT and Col Ir/r mice pretreated with or without CAE. Right, immunoblot analysis of DDR1 and Flag-tagged E79Q in the indicated KPC cells plated on wild-type ECM in LG medium for 24 h. h, Representative images and sizes of MIA tumours grown with wild-type or R/R fibroblasts in nude mice with or without ML120B or tigecycline. Data in a (n = 3 independent experiments), c,g,h (n = 5 mice) and e (n = 9 mice) are mean ± s.e.m. Statistical significance determined by two-tailed t-test. ***P < 0.001, ****P < 0.0001; NS, not significant. Exact P values in a,c,g are shown in the Source Data. Scale bars (c,d,h), 1 cm. Source data
Extended Data Fig. 1
Extended Data Fig. 1. Col I cleavage stimulates PDAC growth.
a, Overall survival of patients with PDAC from TCGA with high and low collagen-cleaving MMP signature (MMP1, 2, 8, 9, 13, 14). Significance was analysed by log-rank test. b, UMAPs showing scRNA-seq data from 5 primary PDACs, displaying cell types and expression of the most abundant MMP mRNAs. c, Pancreas morphology 4 wk after orthotopic KPC cell transplantation into Col IWT or Col Ir/r mice −/+ CAE pretreatment. d, H&E and sirius red (SR) staining of pancreatic sections from above mice. Boxed areas were further magnified. Quantification of SR positivity in nontumor (NT) areas is shown to the right. e, IHC of pancreatic sections from above mice. Quantification of tumour areas is shown to the right. f, H&E, SR, Ki67 staining of liver sections from above CAE-pretreated mice. g, Liver gross morphology and tumour numbers (#) 2 wk after i.s. transplantation of Paren. or IKKα knockdown (KD) KC cells into CCl4 pretreated Col IWT or Col Ir/r mice. h, H&E and SR staining of liver sections 2 wk after i.s. transplantation of KPC cells into Col IWT and Col Ir/r mice −/+ CCl4 pretreatment. Quantification of SR positivity in NT areas is shown at the bottom. i, IHC of liver sections from above mice. Boxed areas show higher magnification. Results in (e) (n = 5 fields), (g), (h) (n = 6 mice) and (d) are mean ± s.e.m. Statistical significance determined by two-tailed t-test. ***P < 0.001, ****P < 0.0001. Scale bars in (df, and h,i), 100 μm, (c,g), 1 cm. Source data
Extended Data Fig. 2
Extended Data Fig. 2. The Col I state controls PDAC gene expression and metabolism.
a, Dataset enrichment of RNA-seq data (n = 3) from KPC cells plated on wild-type (WT) (blue) or R/R (red) ECM and incubated in LG for 24 h. b, KPC cells grown on [3H]-proline-labelled WT, R/R, Col IΔ R/R or Col IΔ R/R + Col IWT ECM were incubated in LG −/+ EIPA for 24 h. [3H] uptake is presented relative to vehicle treated WT ECM-plated KPC cells. IB analysis of iCol I and 3/4 Col I in ECM produced by indicated fibroblasts. c, Indicated KPC cells were plated on [3H]-proline-labelled ECM and incubated in LG for 24 h. [3H] uptake is presented relative to Paren. uptake. KD efficiency is demonstrated. d, KPC cells were plated on [3H]-proline-labelled ECM and incubated in LG −/+ indicated reagents for 24 h. [3H] uptake is presented as above. e, [3H] uptake by KC cells treated as above. f, AA content of ECM-plated KPC cells incubated in LG −/+ indicated reagents for 24 h. Cell number normalized data are presented relative to untreated WT ECM-plated cells. g, KC cells were plated −/+ WT or R/R ECM and incubated in complete (CM) or LG media −/+ indicated reagents for 24 h. Cellular ATP content is presented relative to untreated plastic-plated cells. h, KPC cells were plated as in (b) and incubated in LG −/+ EIPA for 24 h. Cellular ATP content is presented relative to untreated WT ECM-plated cells. i, Total AA in KC cells plated on ECM and incubated in LG −/+ indicated reagents for 24 h. Data are presented as above. j, Total AA in KPC cells treated as in (h). Results in (b,d–j) (n = 3 independent experiments), (c) (n = 4 independent experiments) are mean ± s.e.m. Statistical significance determined by two-tailed t-test. **P < 0.01, ***P < 0.001, ****P < 0.0001. Exact P values in (bj) are shown in Source Data. Source data
Extended Data Fig. 3
Extended Data Fig. 3. The cleaved to intact Col I ratio controls macropinocytosis and mitochondrial biogenesis.
a, Macropinocytosis (MP) visualization and quantification using TMR-DEX in KPC cells co-cultured with WT or R/R fibroblasts and incubated in LG medium for 24 h. KPC cells were marked by cytokeratin 18 (CK18, green). b, Representative images, and MP quantification in TMR-DEX-injected pancreatic tissue from Col IWT or Col Ir/r mice 4 wk after orthotopic KPC cell transplantation. Carcinoma cells are marked by EpCAM staining (green). Quantification is on the right. c, qRT-PCR analysis of MP-related mRNAs in liver tumours 2 wk after i.s. KPC cell transplantation into CCl4 pretreated ColWT or Colr/r mice. Exact P values are shown in Source Data. d, IB analysis of MP-related proteins in above liver tumours. e, Representative images, and quantification of Mito. (ATP5B, green) in pancreatic tissue from indicated mice analysed as in (b). Carcinoma cells are marked by EpCAM staining (red). Quantification is on the right. f,g, Representative images, and quantification of Mito. (TIM23) and MP in TMR-DEX-incubated KPC cells grown on mixed ECM produced by R/R and WT (R:W) (f) or R/R and Col IΔ R/R (R:KO) (g) fibroblasts in the indicated ratios and incubated in LG medium for 24 h. IB analysis of iCol I or cCol I (3/4 Col I) in above ECM preparations is shown at the bottom. Results in (a,f,g) (n = 6 fields), (b,c,e) (n = 4 mice) are mean ± s.e.m. Statistical significance determined by two-tailed t-test. *P < 0.05, **P < 0.01, ***P < 0.001, ****P < 0.0001. Scale bars, 10 μm. Source data
Extended Data Fig. 4
Extended Data Fig. 4. Col I controls macropinocytosis and mitochondrial content through DDR1–NRF2 signalling.
a, IB analysis of KPC cells ablated for indicated collagen receptors. b, UMAPs showing scRNA-seq data from 5 primary PDAC (upper row) and 1 PDAC liver metastasis (lower row), displaying the identified cell populations and expression of the indicated mRNAs. c, Representative images, and quantification of Mito. and MP in TMR-DEX-incubated Paren. and NRF2Δ (ΚΟ) KPC cells plated on WT or R/R ECM and incubated in LG for 24 h. NRF2 IB analysis is shown on the right. d, MP and NRF2 localization in Paren. and NRF2KD MIA cells plated −/+ WT or R/R ECM and incubated in LG for 24 h. MP quantification is shown on the right. e, 3/4 Col I and MP imaging and quantification in KPC cells treated as above. Although NRF2E79Q (E79Q) stimulates MP, cCol I uptake is detected only in cells plated on WT ECM. f, Representative images, and quantification of MP and nuclear NRF2 in 1305 cells plated on WT ECM and incubated in LG for 24 h. IB analysis of DDR1 and Flag-tagged E79Q is shown on the right. g, MP imaging and quantification in Paren. and E79Q MIA cells plated on WT or R/R ECM and incubated in LG for 24 h. Results in (c-g) (n = 6 fields) are mean ± s.e.m. Statistical significance was determined by two-tailed t-test. ****P < 0.0001. Scale bars, 10 μm. Source data
Extended Data Fig. 5
Extended Data Fig. 5. cCol I–DDR1–NRF2 signalling controls macropinocytosis and mitochondrial protein expression.
a, IB analysis of ETC complexes I-V (CI-CV) in Paren. and E79Q KPC cells plated on WT or R/R ECM and incubated in LG for 24 h. b, IB analysis of indicated KPC cells −/+ ectopic p62 or E79Q plated on WT ECM and incubated in LG for 24 h. c, IB of ETC proteins in Paren., DDR1Δ, or E79Q/DDR1Δ KPC cells plated on WT ECM and incubated in LG for 24 h. d,e, IB of indicated proteins in Paren. or E79Q KPC cells plated on WT ECM and incubated in LG medium −/+ML120B for 24 h. f, Staining intensity of the indicated proteins in tumour areas depicted Fig. 4e determined with Image J. g, IHC of liver sections prepared 2 wk after i.s. transplantation of KPC cells into CCl4 pretreated Col IWT and Col Ir/r mice. Scale bars, 100 μm. Image J determined staining intensity of indicated proteins in tumour areas is shown at the bottom. Results in (f,g) (n = 6 fields) are mean ± s.e.m. Statistical significance determined by two-tailed t-test. ****P < 0.0001. Source data
Extended Data Fig. 6
Extended Data Fig. 6. Inhibition of Col I cleavage shuts down NRF2-driven macropinocytosis and mitochondrial biogenesis.
a, MP and mitochondria in KPC cells plated on indicated ECM and incubated in LG for 24 h. Col I IB in indicated ECM preparations is shown on the right. b, IB of indicated proteins in above cells. c, MP and mitochondria in indicated KPC cells plated on R/R Col IΔ ECM and incubated in LG for 24 h. d, IB of indicated proteins in 1305 cells plated on ECM produced by bacterial collagenase (CLG, 50 μg/ml) treated or untreated fibroblasts and incubated in LG medium −/+ CLG for 24 h. e, Genes differentially expressed between KPC cells plated on indicated ECM. Blue: replicates with low expression (z-score = −2); red: replicates with high expression (z-score = +2). f, Immunoprecipitation (IP) of GFP–DDR1 from 1305 cells plated −/+ indicated ECM. g, MP and mitochondria in Paren. or E79Q KPC cells plated on ECM produced by Ilomastat (Iloma.) treated or untreated WT fibroblasts and incubated in LG medium −/+ Iloma. for 24 h. h, IB of indicated proteins in above cells. i, MP and mitochondria in ATG7Δ MIA PaCa-2 cells plated on indicated ECM and incubated in LG for 24 h. j, Imaging of 1305 cells plated on indicated ECM showing rare poly-Ub and Mito. (Tom20) colocalization. k, IB analysis of KPC cells plated −/+ indicated ECM and incubated in indicated media for 24 h. l, Locations of putative NRF2-binding sites (AREs) relative to the transcriptional start site (TSS, +1) of the mouse Tfam gene. m, Chromatin IP probing NRF2 recruitment to the Tfam promoter in KPC cells plated on WT or R/R ECM and incubated in LG for 24 h. The image shows PCR-amplified ARE-containing promoter DNA fragments. Quantitation on the right. Results in (a,c,g,i) (n = 6 fields), (m) (n = 3 independent experiments) are mean ± s.e.m. Statistical significance determined by two-tailed t-test. ***P < 0.001, ****P < 0.0001. Scale bars, 10 μm. Source data
Extended Data Fig. 7
Extended Data Fig. 7. Correlation between Col I–DDR1–NRF2 signalling components and inflammation in human PDAC.
a, Numbers and percentages of human PDAC specimens (n = 106 specimens) positive for the indicated proteins (arbitrarily indicated as low and high). b, Correlation between indicated proteins in above specimens was analysed by a two-tailed Chi-square test. *P < 0.05, **P < 0.01, ***P < 0.001, ****P < 0.0001. cCol I (3/4 Col I). c, Representative IHC and quantification of the indicated markers in cCol Ihigh (#43) and cCol Ilow (#54) human PDAC specimens from Fig. 5a. Mean ± s.e.m. (n = 16 specimens). Statistical significance determined by two-tailed t-test. ***P = 0.0001. *P = 0.0145, *P = 0.0388. Scale bars, 100 μm. Source data
Extended Data Fig. 8
Extended Data Fig. 8. Effect of macropinocytosis and mitochondria on Col I-controlled PDAC cell growth.
a, Bromodeoxyuridine (BrdU) incorporation into KPC cells plated on ECM mixtures produced by R/R and WT fibroblasts (R:W). Scale bars, 10 μm. b,c, Paren. and IKKαKD KPC (b) or KC (c) cells were plated −/+ WT or R/R ECM and incubated in LG −/+ indicated reagents. Viable cells were measured after 3 days and depicted relative to untreated plastic-plated Paren. cells. (c). IKKα KD efficiency is shown on the right (b). d,e, Viable 1305 (d) or MIA PaCa-2 (e) cells plated as above and incubated in LG −/+ EIPA. f, Viable Paren. and E79Q KPC cells plated, treated, and presented as above. g, Paren. and DDR1KD 1305 or KPC cells plated on indicated ECM preparations and incubated in LG medium −/+ indicated tigecycline concentrations for 24 h. Total viable cells were measured as above and are presented relative to the untreated cells. h, Mitochondrial ATP production calculated from Fig. 6b. i, Liver morphology and tumour numbers (#) 2 wk after i.s. transplantation of Paren. or NHE1KD KPC cells into CCl4-pretreated Col IWT and Col Ir/r mice −/+ EIPA. NHE1 IB is shown on bottom left. ****P < 0.0001. j, H&E and SR staining of s.c. tumours from Fig. 6c. Quantification of the SR positive area is shown on the left. Scale bars, 100 µm. Results in (a) (n = 6 fields), (bg) (n = 3 independent experiments), (h) (n = 3 per condition), (j) (n = 5 mice) and (i) are mean ± s.e.m. Statistical significance determined by two-tailed t-test. Exact P values in (a−c,f,h) are shown in Source Data. Source data
Extended Data Fig. 9
Extended Data Fig. 9. The cCol I–DDR1–NRF2 axis controls PDAC growth but not collagen fibre alignment.
a, H&E, SR and cytokeratin 19 (CK19) and SOX9 staining of pancreatic and liver sections from CAE-pretreated Col IWT and Col Ir/r mice 4 wk after orthotopic KPC NRF2E79Q cell transplantation. Scale bars, 100 µm. b, Tumours formed by orthotopically transplanted Paren. or DDR1KD KPC cells in Col IWT and Col Ir/r mice analysed by SHG and collagen fibre individualization. BF-bright field. c, IHC of indicated markers in pancreatic sections of Col IWT and Col Ir/r mice orthotopically transplanted with KPC cells. Quantification of staining positivity in tumour areas is shown below. Left to right: ****P < 0.0001, **P = 0.0013, P = 0.5351. d, Pancreas morphology 4 wk after orthotopic transplantation of Paren., DDR1KD, E79Q/DDR1KD KPC cells into Col IWT and Col Ir/r mice pretreated −/+ CAE. Scale bars, 1 cm. e, H&E staining and IHC analysis of pancreatic sections from above mice. Quantification of tumour area by Image J is shown below. Left to right: ****P < 0.0001, P = 0.5748, P = 0.3606. Results in (c,e) (n = 5 fields) are mean ± s.e.m. Statistical significance determined by two-tailed t-test. Scale bars, 100 µm. Source data
Extended Data Fig. 10
Extended Data Fig. 10. cCol I stimulates PDAC growth, macropinocytosis and mitochondrial biogenesis through the DDR1–NRF2 axis.
a, IHC of pancreatic sections of CAE-pretreated Col IWT or Col Ir/r mice 4 wk after orthotopic transplantation of Paren., DDR1KD and E79Q/DDR1KD KPC cells. Boxed areas were further magnified. Scale bars, 100 µm. b, Representative images and sizes of s.c. tumours generated by Paren., DDR1KD (KD) and E79Q/KD 1305 cells transplanted −/+ WT or R/R fibroblasts into Nu/Nu mice. Scale bars, 1 cm. c, Pancreas weight relative to body weight (P/B) of Col IWT or Col Ir/r mice 4 wk after orthotopic transplantation of Paren., NRF2KD and TFAMKD KPC cells. NRF2 and TFAM KD efficiency is shown below. d, H&E staining and CK19 IHC of above pancreata. Image J quantification of tumour area is shown on the left. Scale bars, 100 µm. Results in (b,c) (n = 5 mice), (d) (n = 5 fields) are mean ± s.e.m. Statistical significance was determined by a two-tailed t-test. ****P < 0.0001. Source data

References

    1. Makohon-Moore, A. & Iacobuzio-Donahue, C. A. Pancreatic cancer biology and genetics from an evolutionary perspective. Nat. Rev. Cancer16, 553–565 (2016). - PMC - PubMed
    1. Grzesiak, J. J. & Bouvet, M. The α2β1 integrin mediates the malignant phenotype on type I collagen in pancreatic cancer cell lines. Br. J. Cancer94, 1311–1319 (2006). - PMC - PubMed
    1. Beatty, G. L. et al. CD40 agonists alter tumor stroma and show efficacy against pancreatic carcinoma in mice and humans. Science331, 1612–1616 (2011). - PMC - PubMed
    1. Rhim, A. D. et al. Stromal elements act to restrain, rather than support, pancreatic ductal adenocarcinoma. Cancer Cell25, 735–747 (2014). - PMC - PubMed
    1. Erkan, M. et al. The activated stroma index is a novel and independent prognostic marker in pancreatic ductal adenocarcinoma. Clin. Gastroenterol. Hepatol.6, 1155–1161 (2008). - PubMed