. 2022 Oct;610(7931):356-365.
doi: 10.1038/s41586-022-05289-6. Epub 2022 Oct 5.

Opposing roles of hepatic stellate cell subpopulations in hepatocarcinogenesis

Affiliations

Opposing roles of hepatic stellate cell subpopulations in hepatocarcinogenesis

Aveline Filliol et al. Nature. 2022 Oct.

Abstract

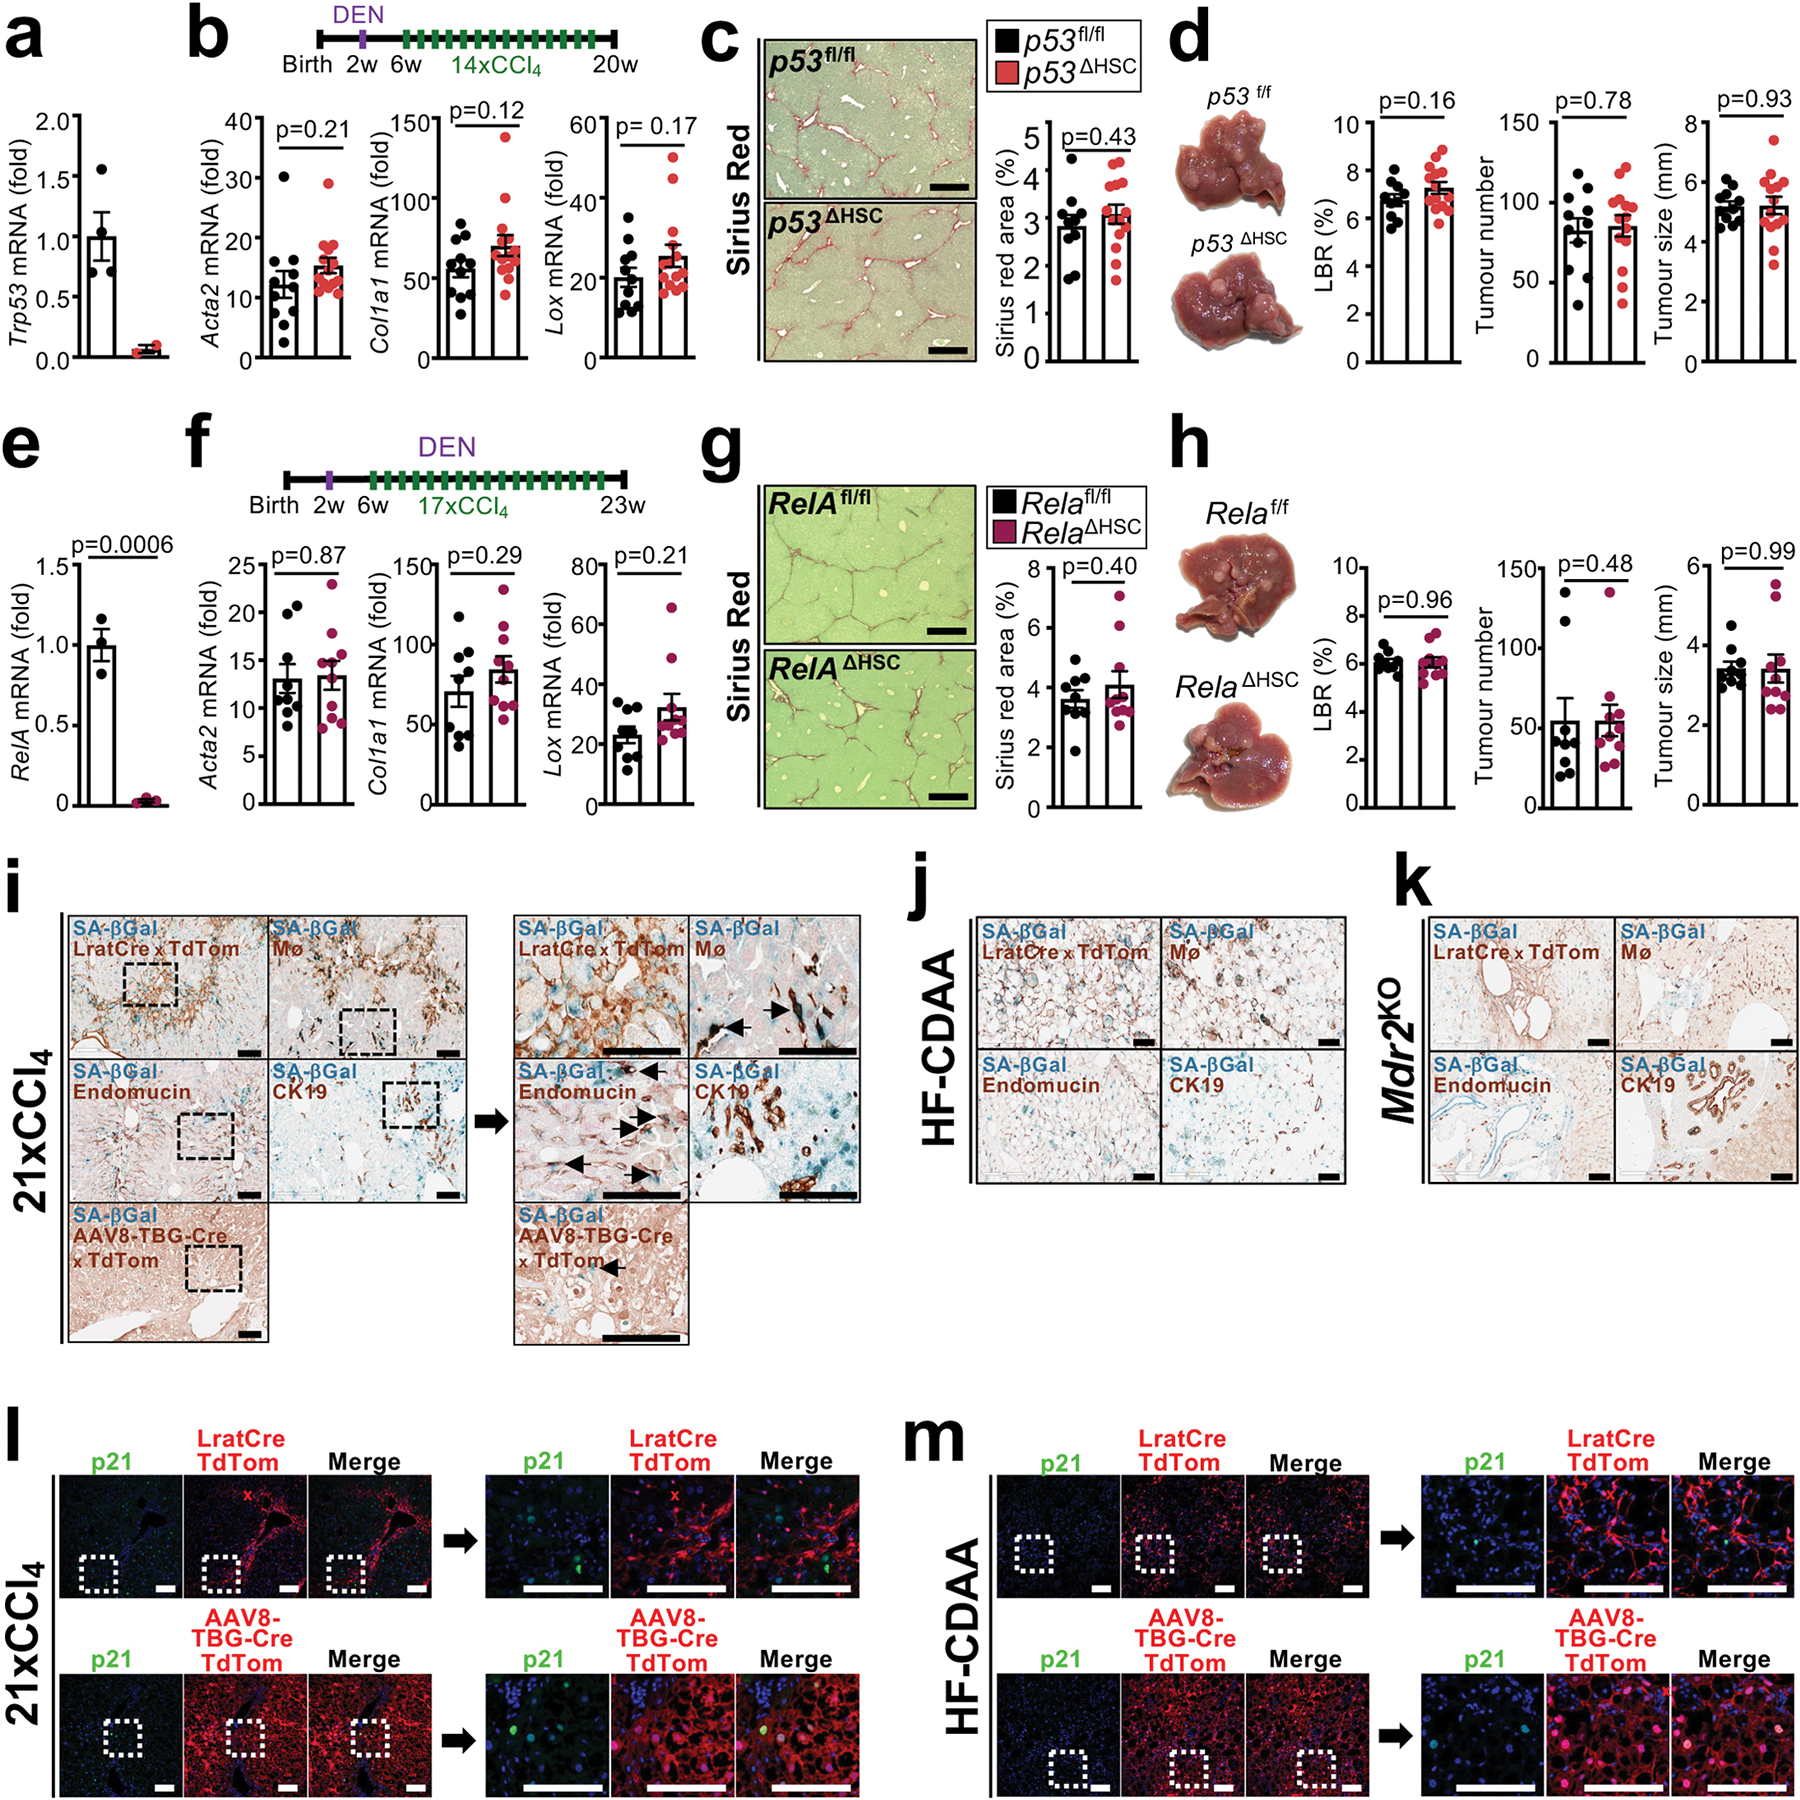
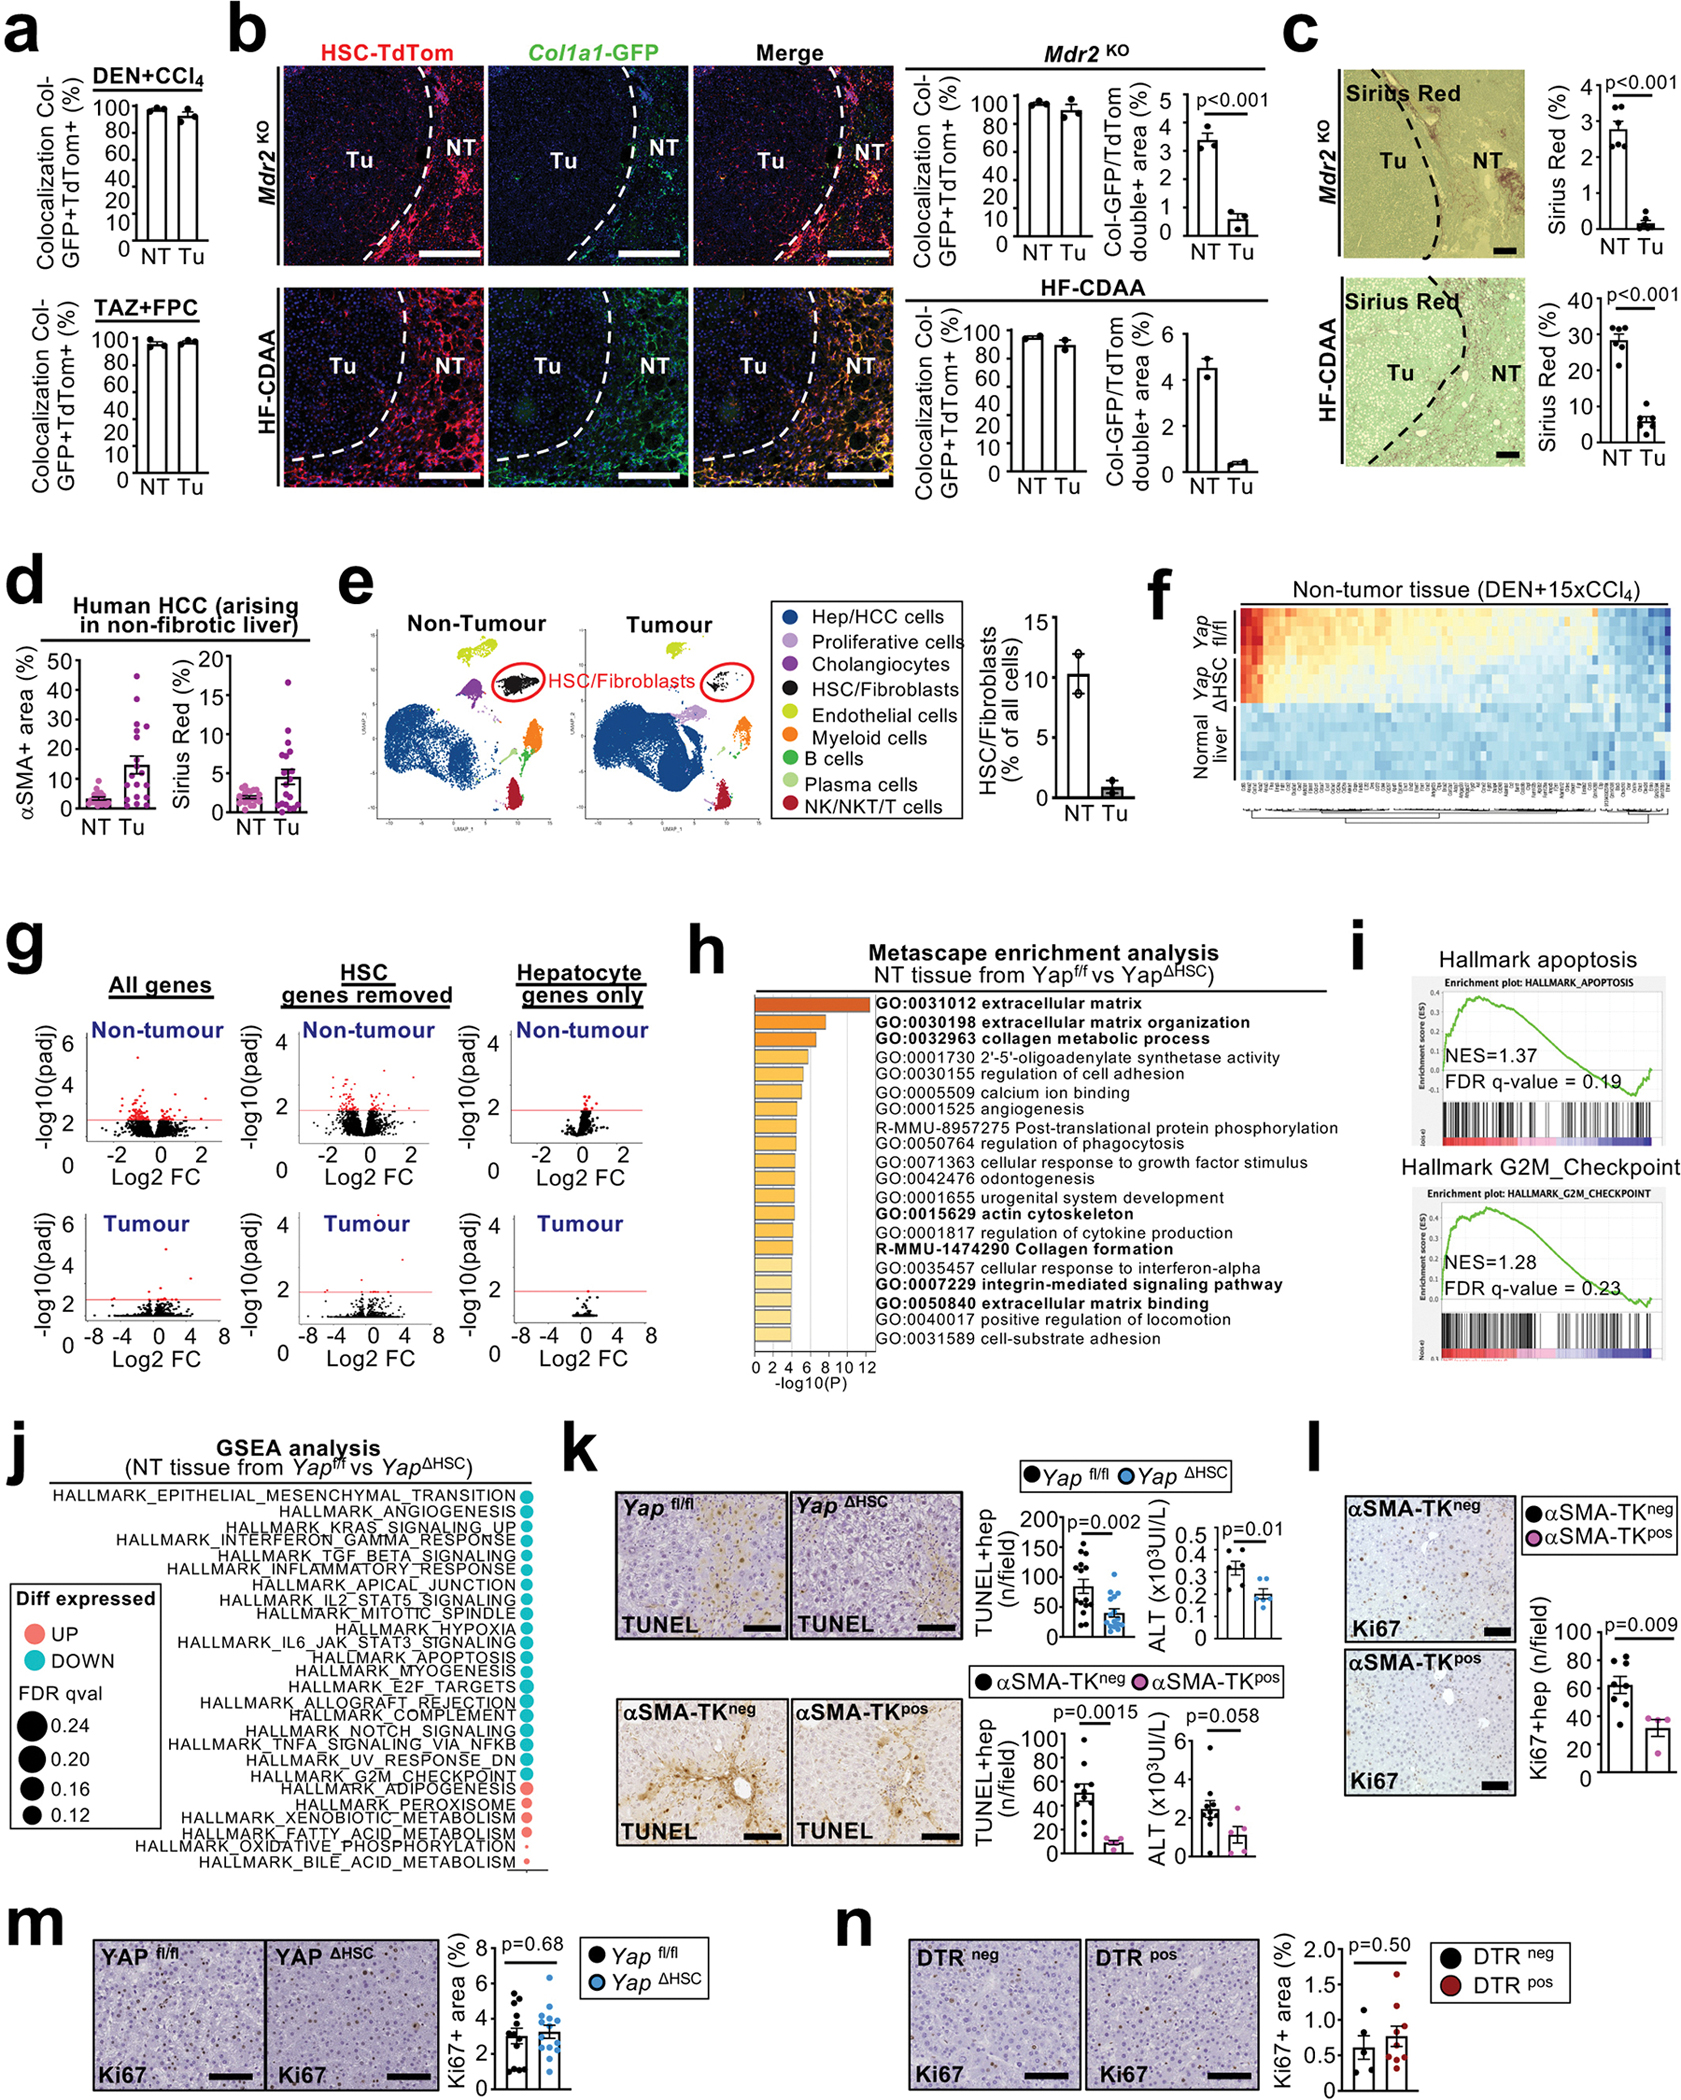
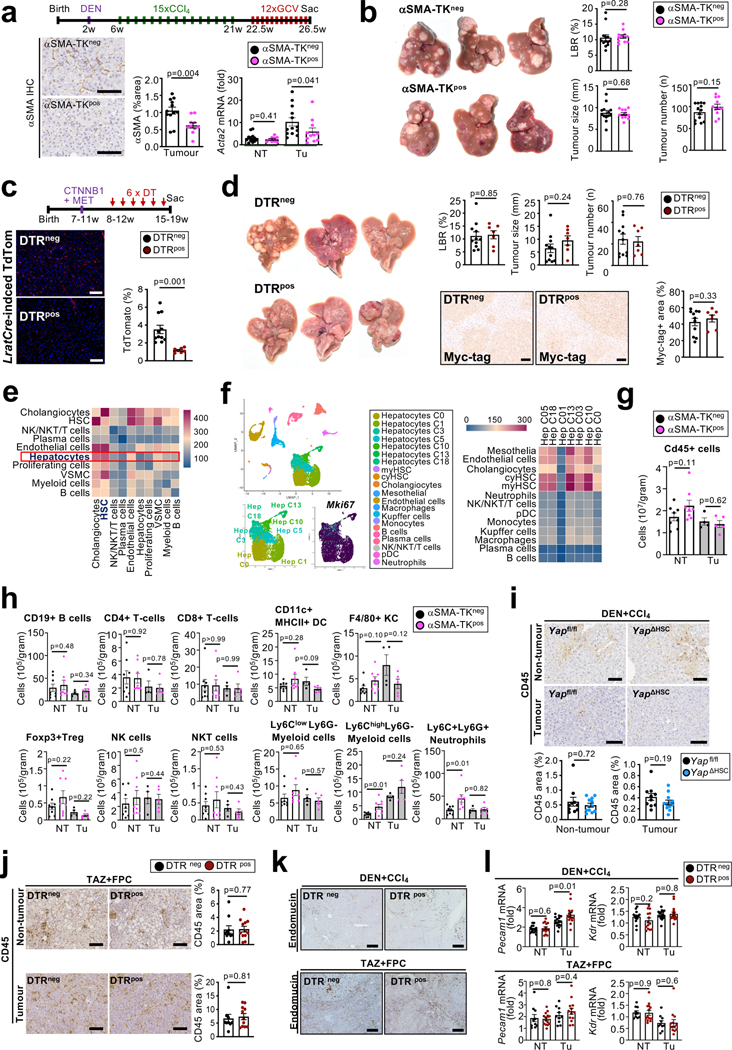
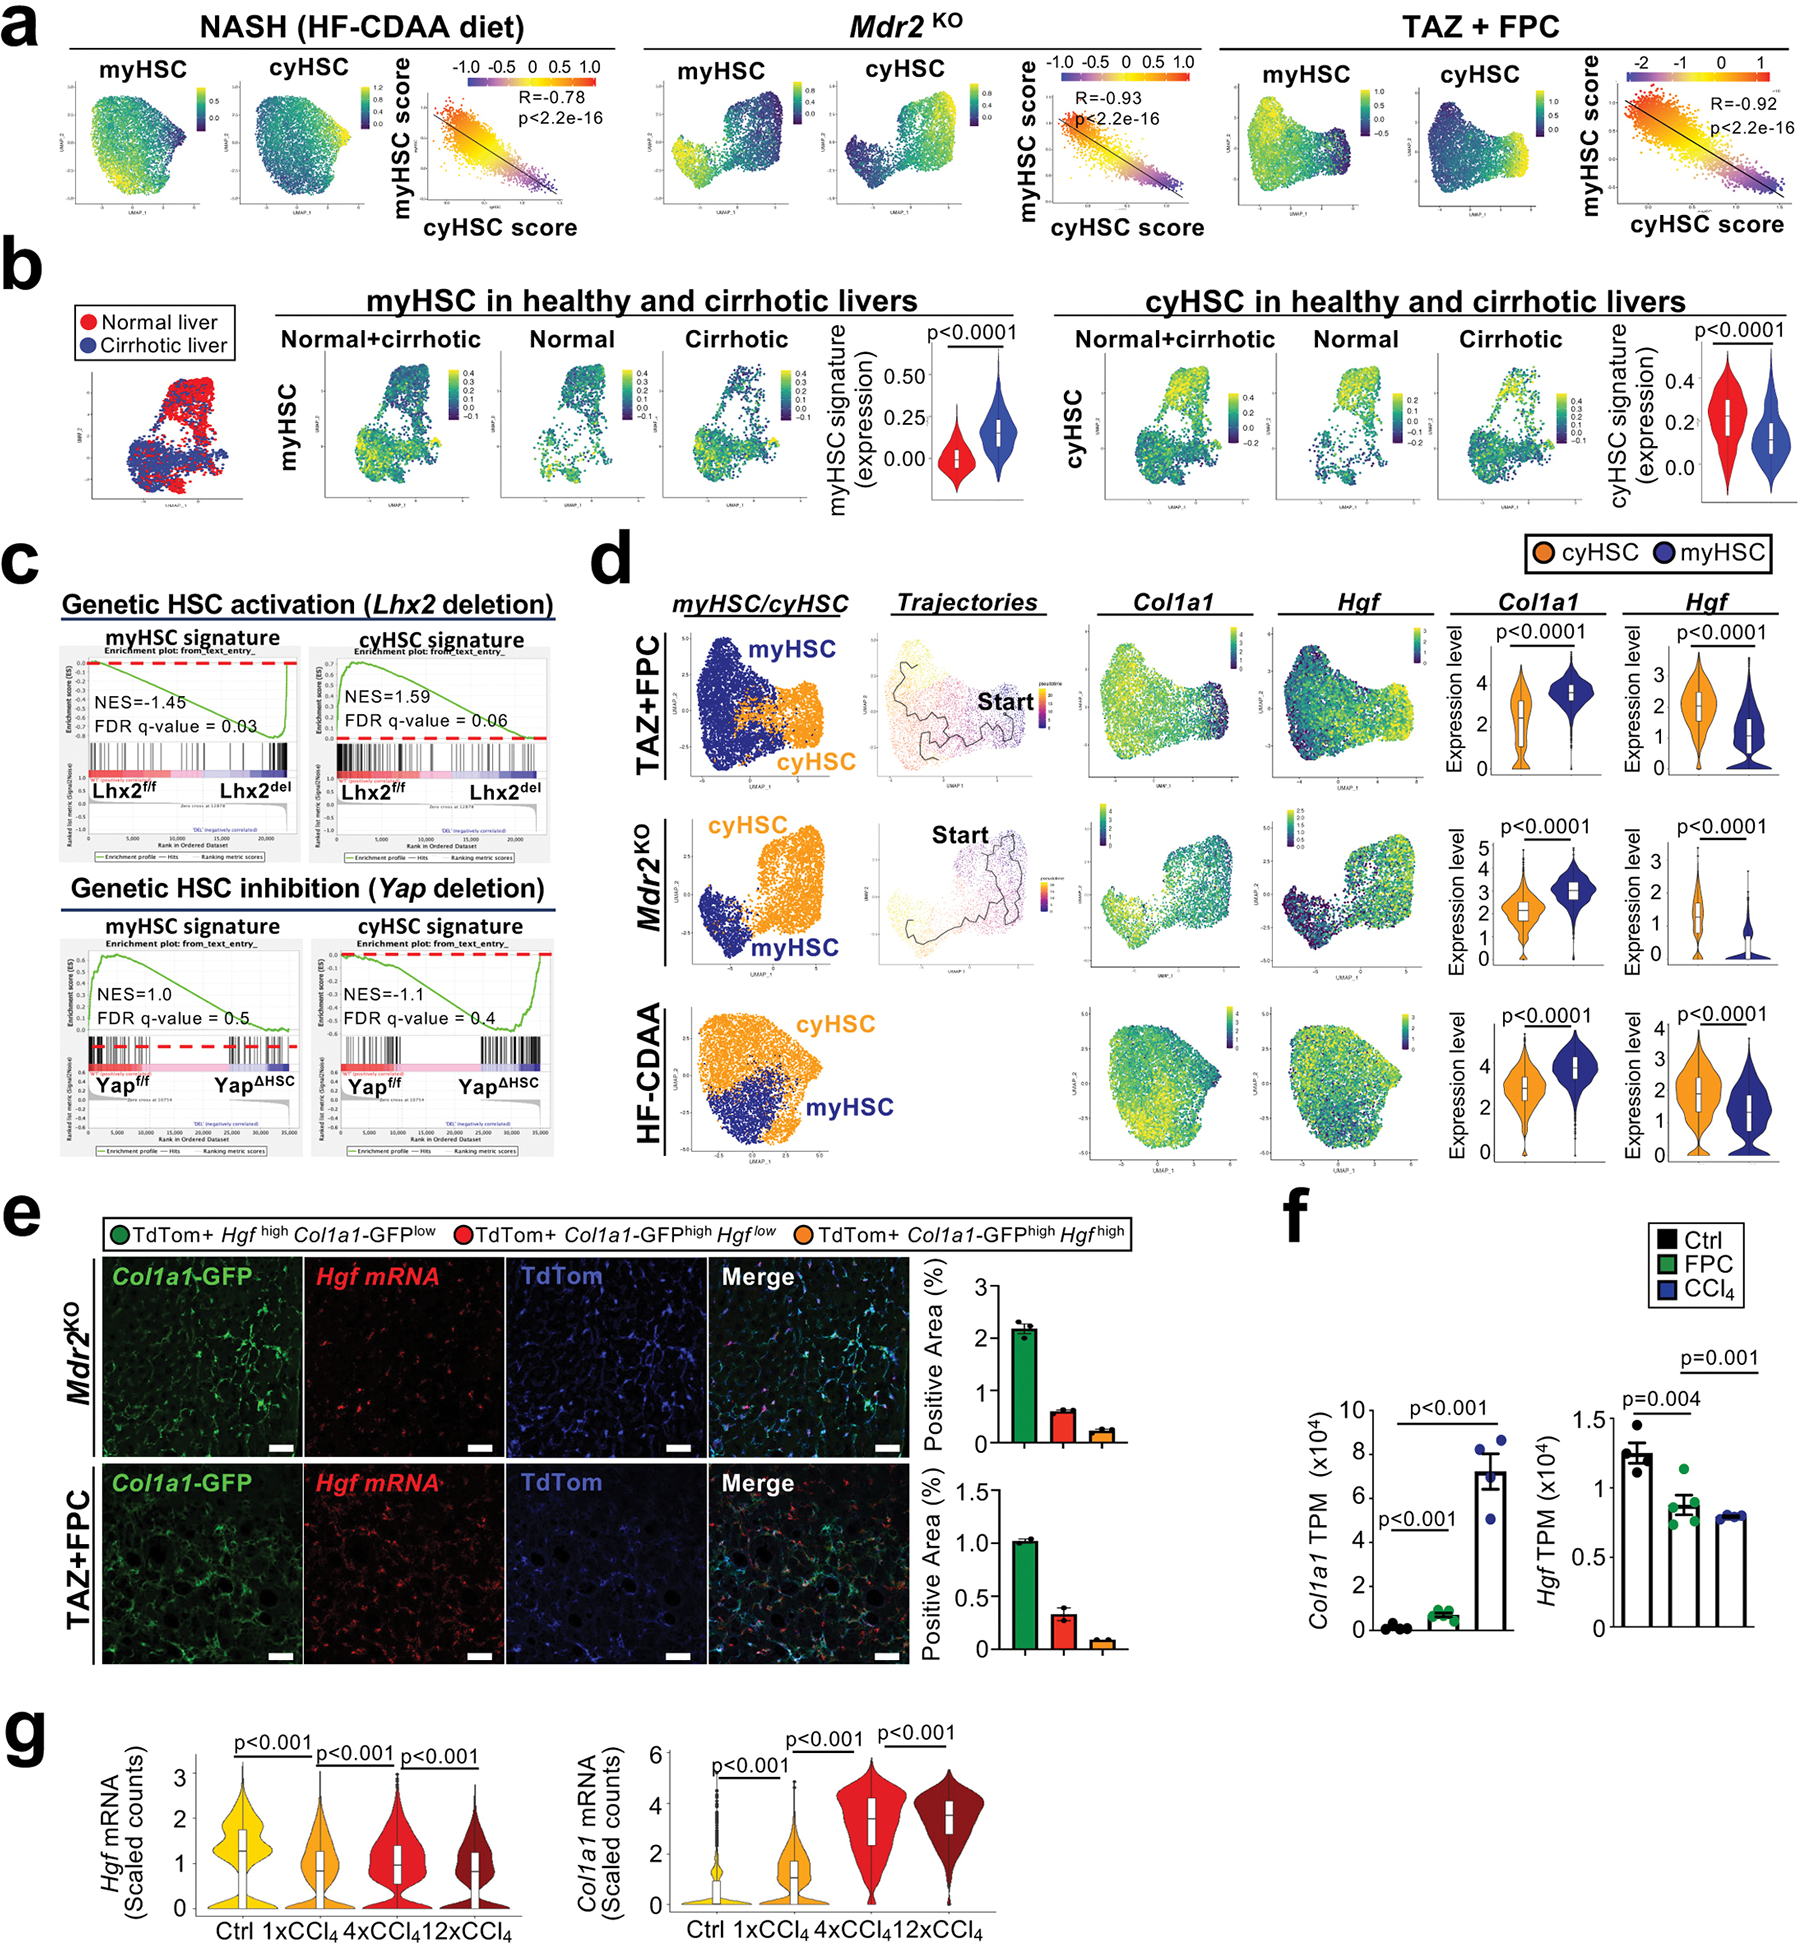
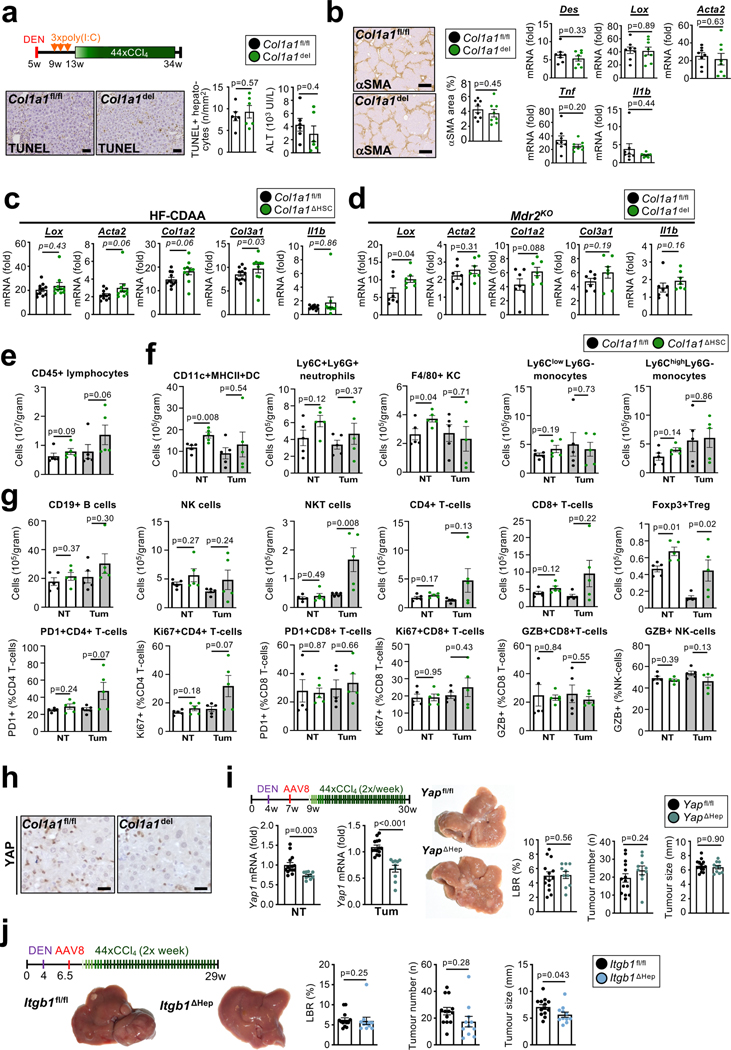
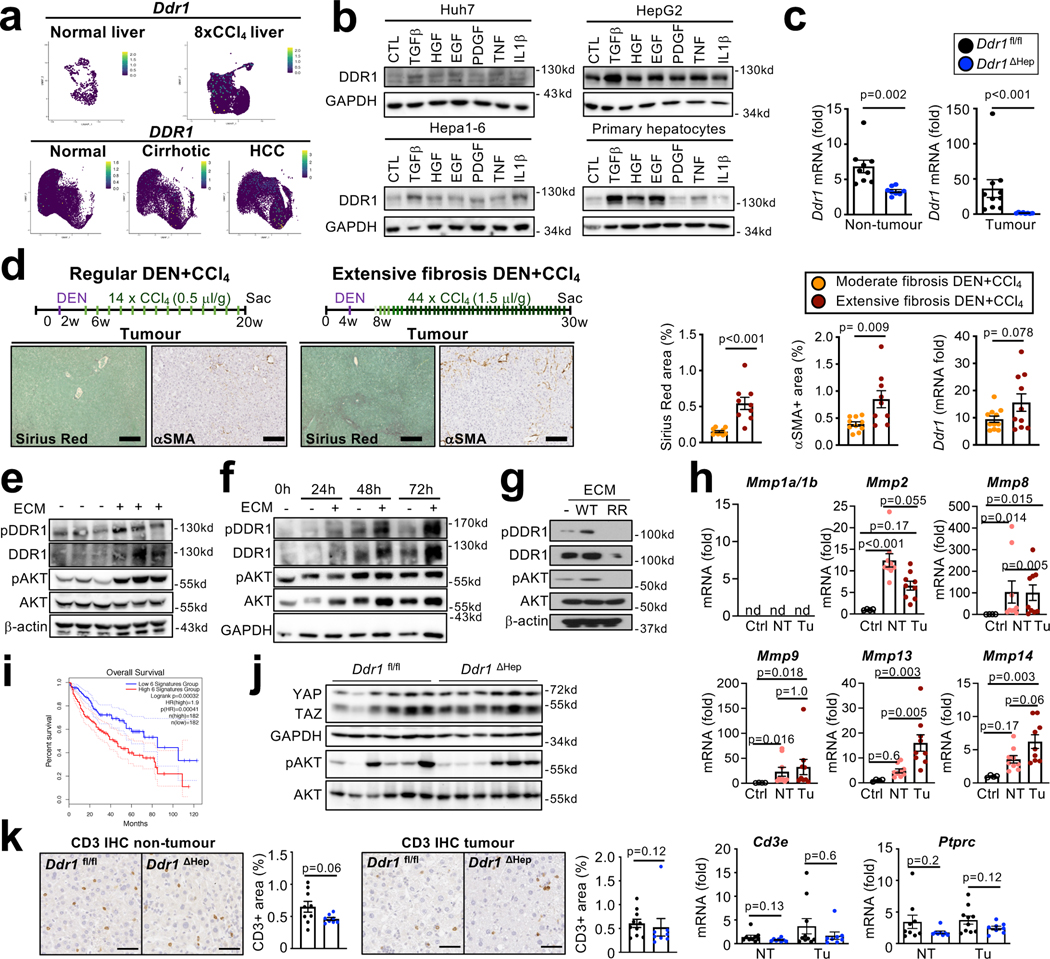
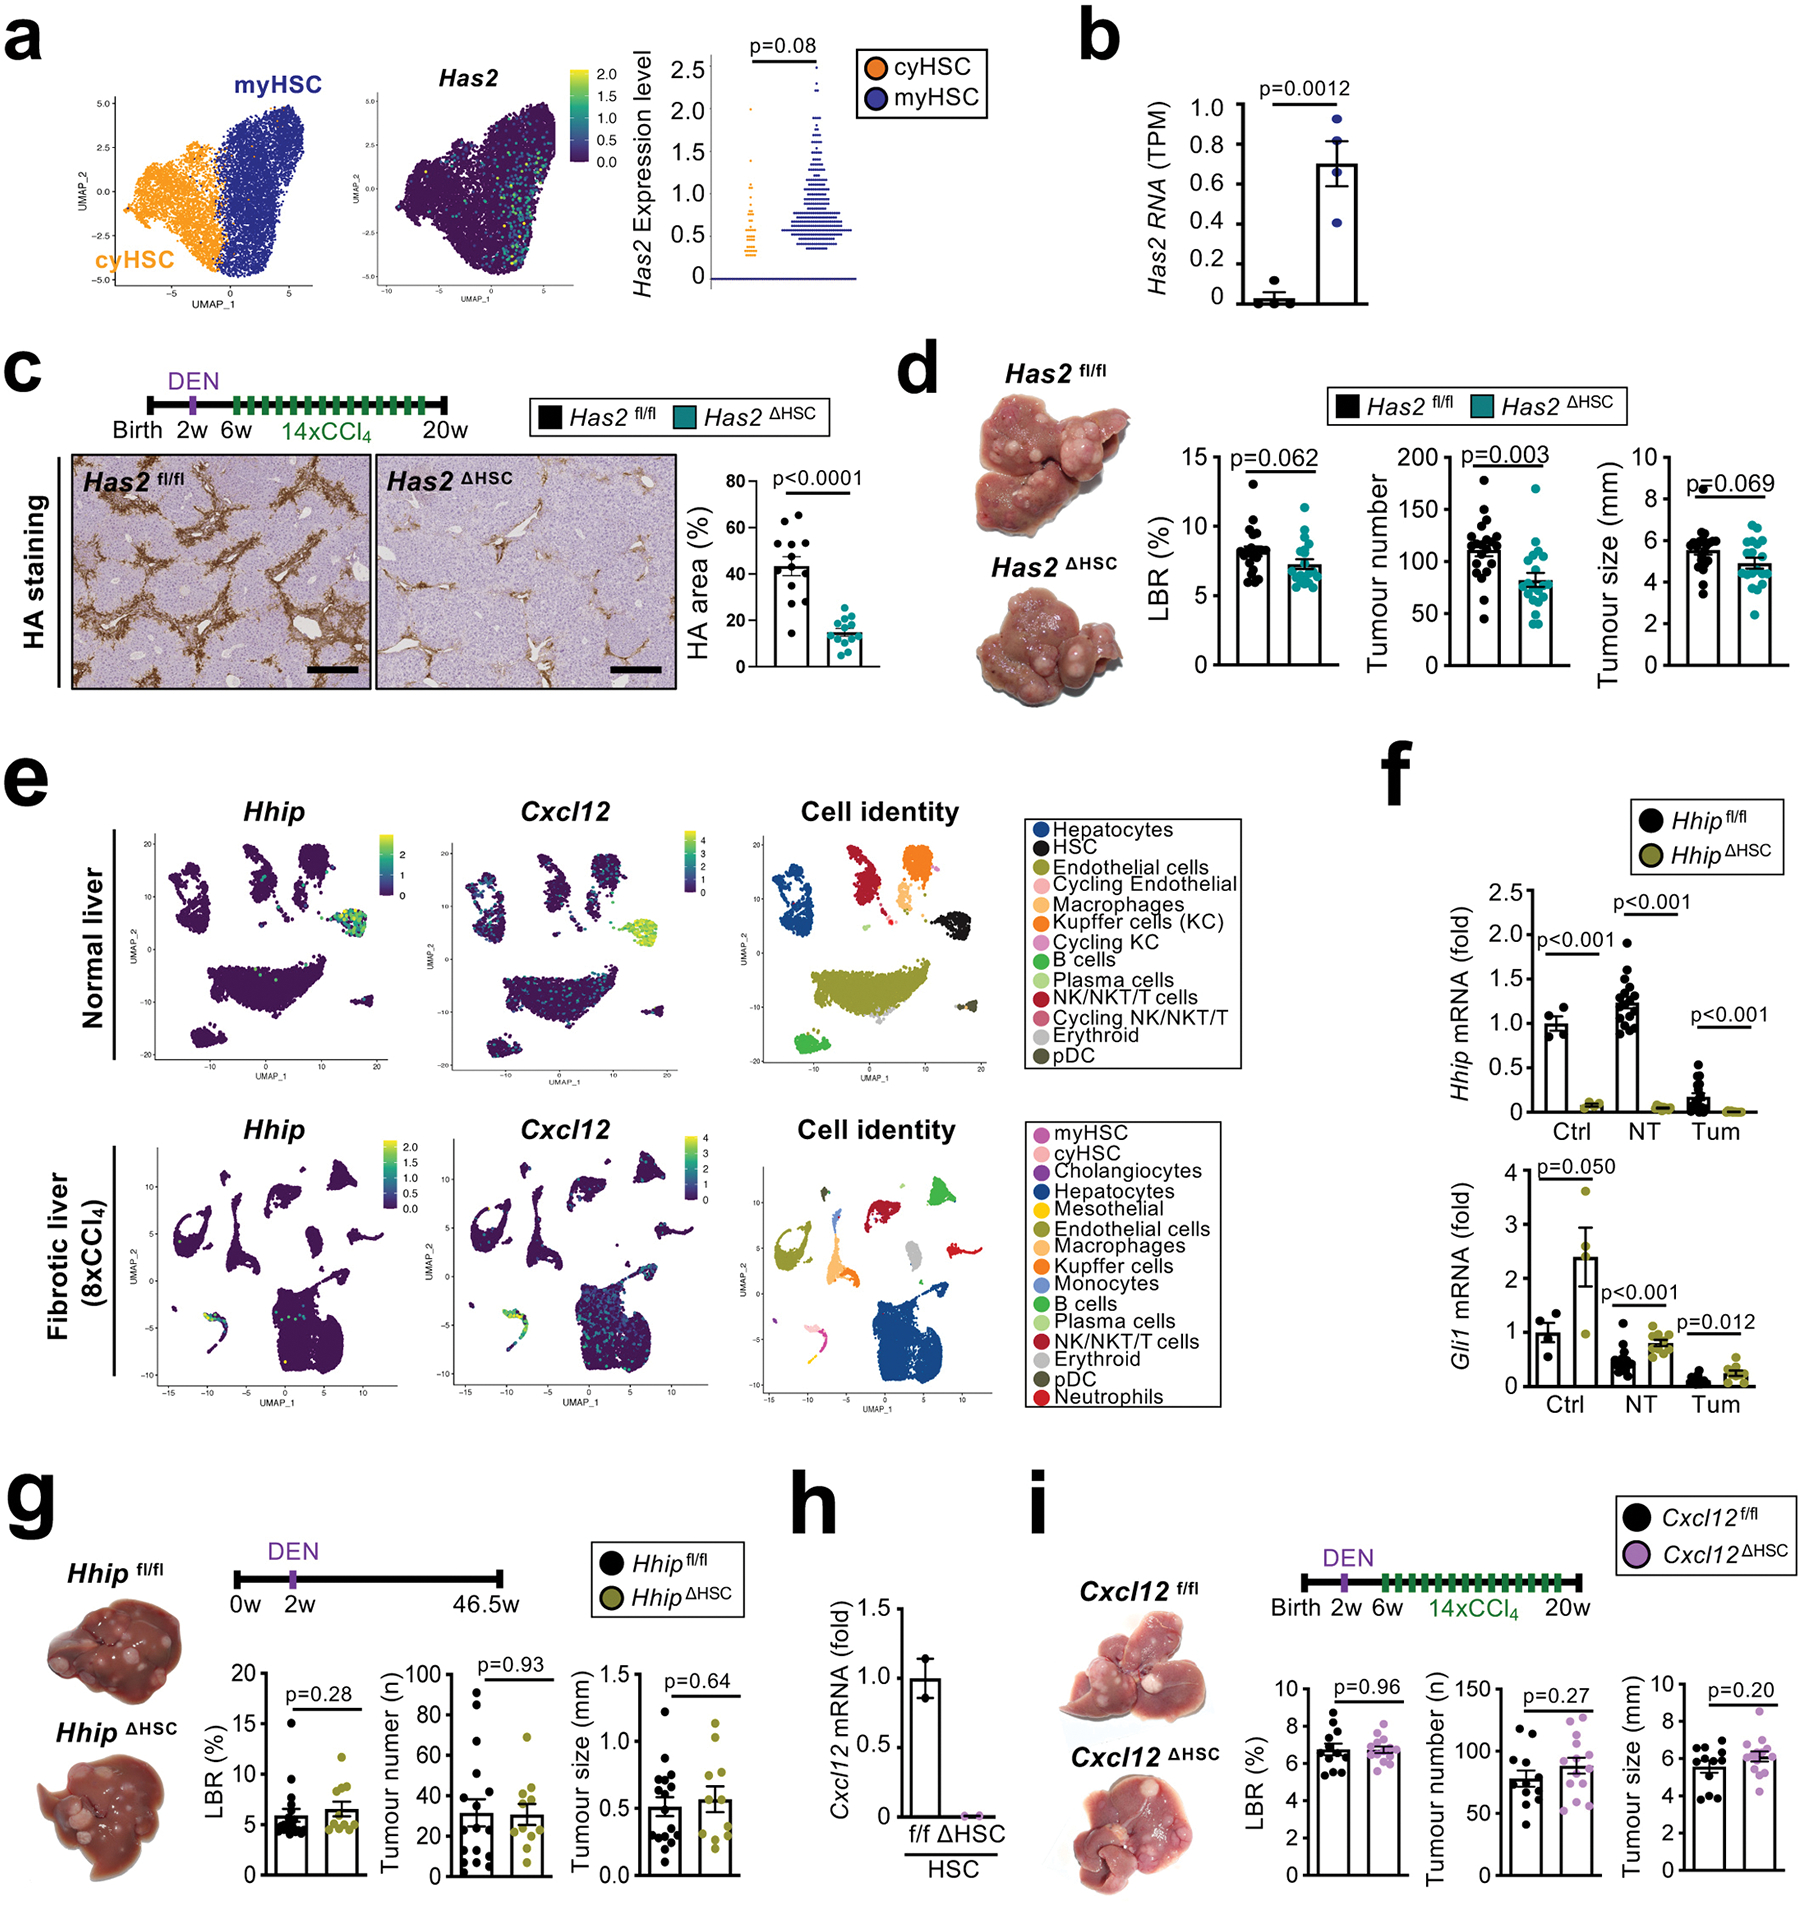
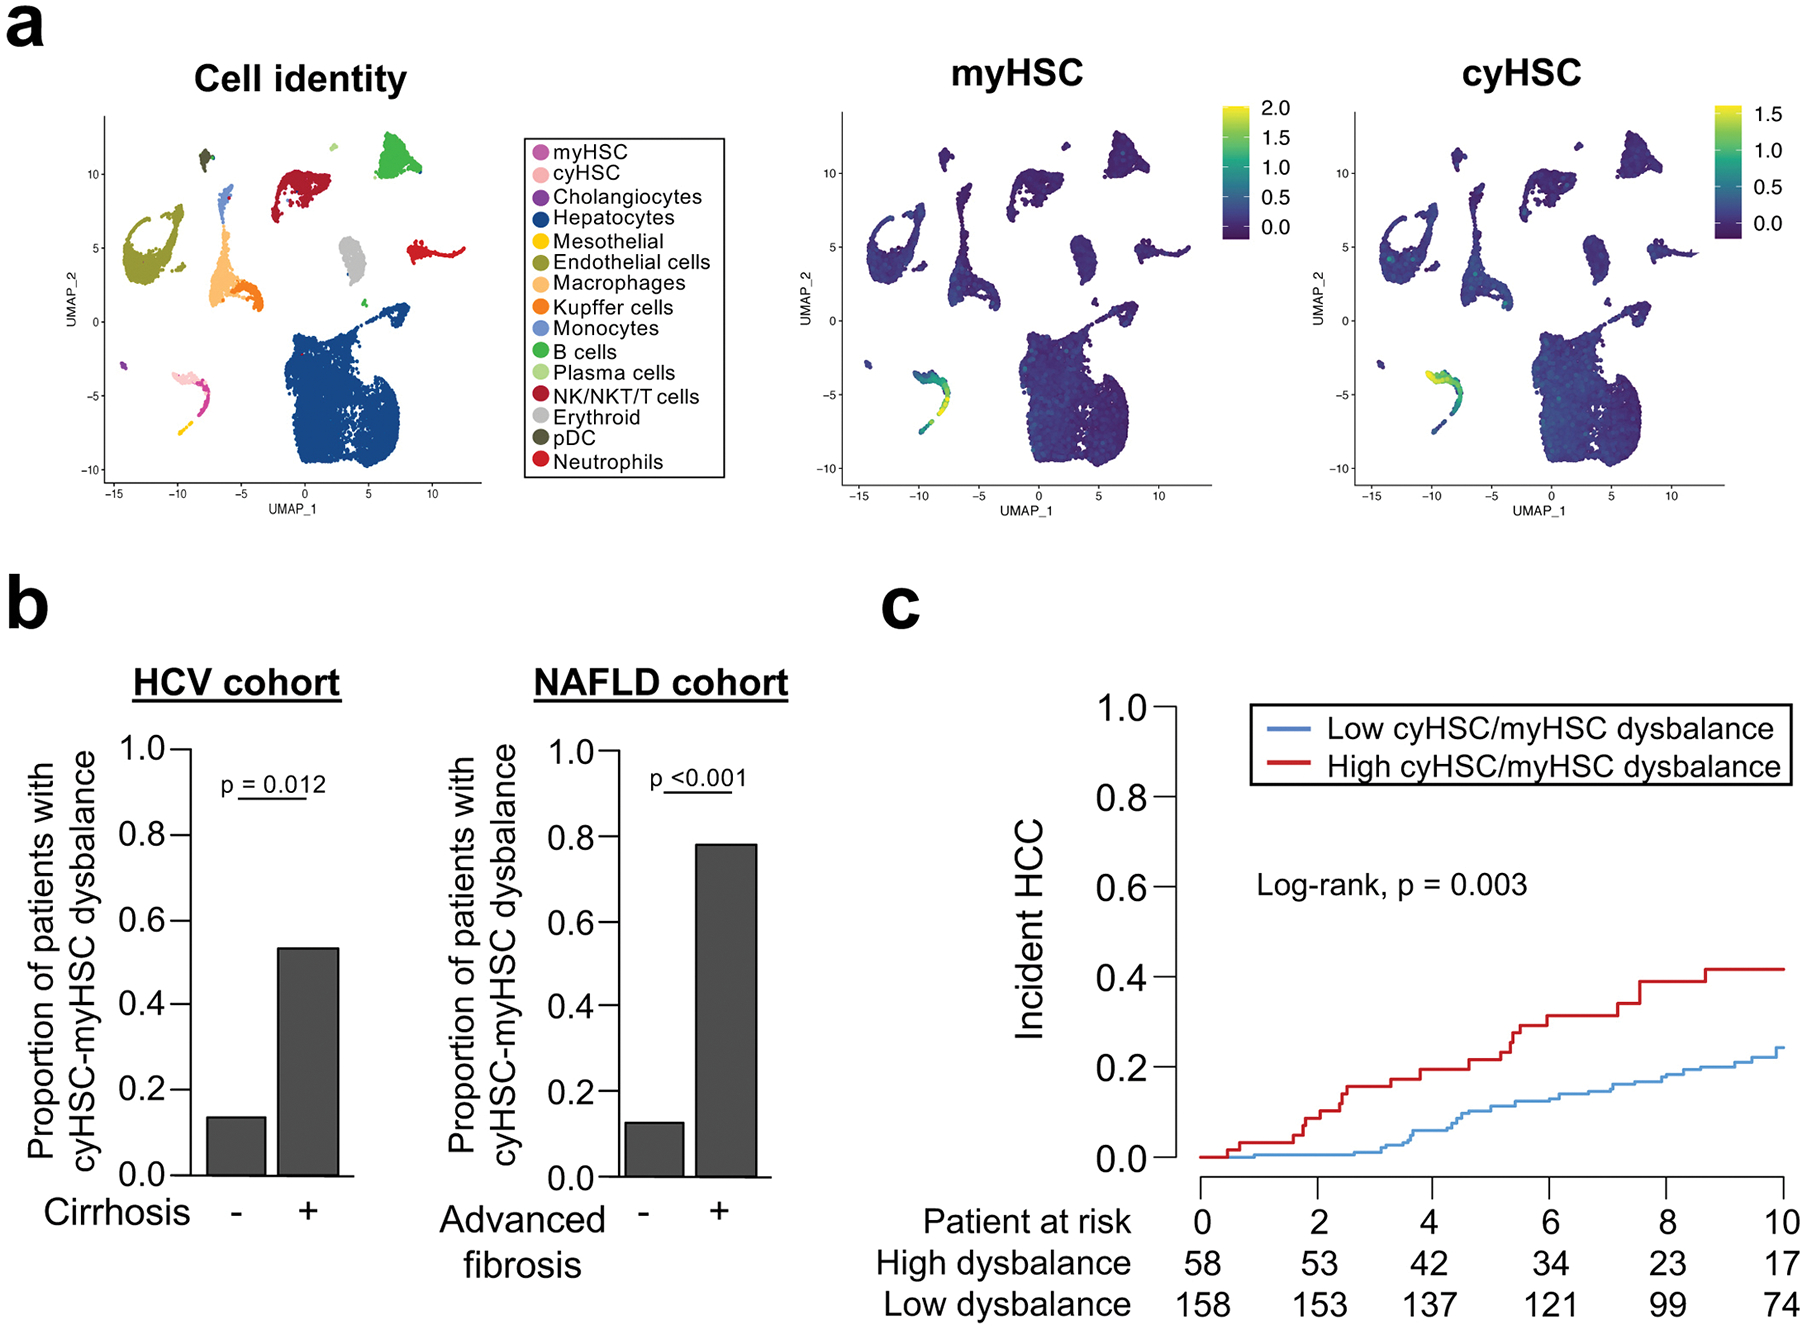
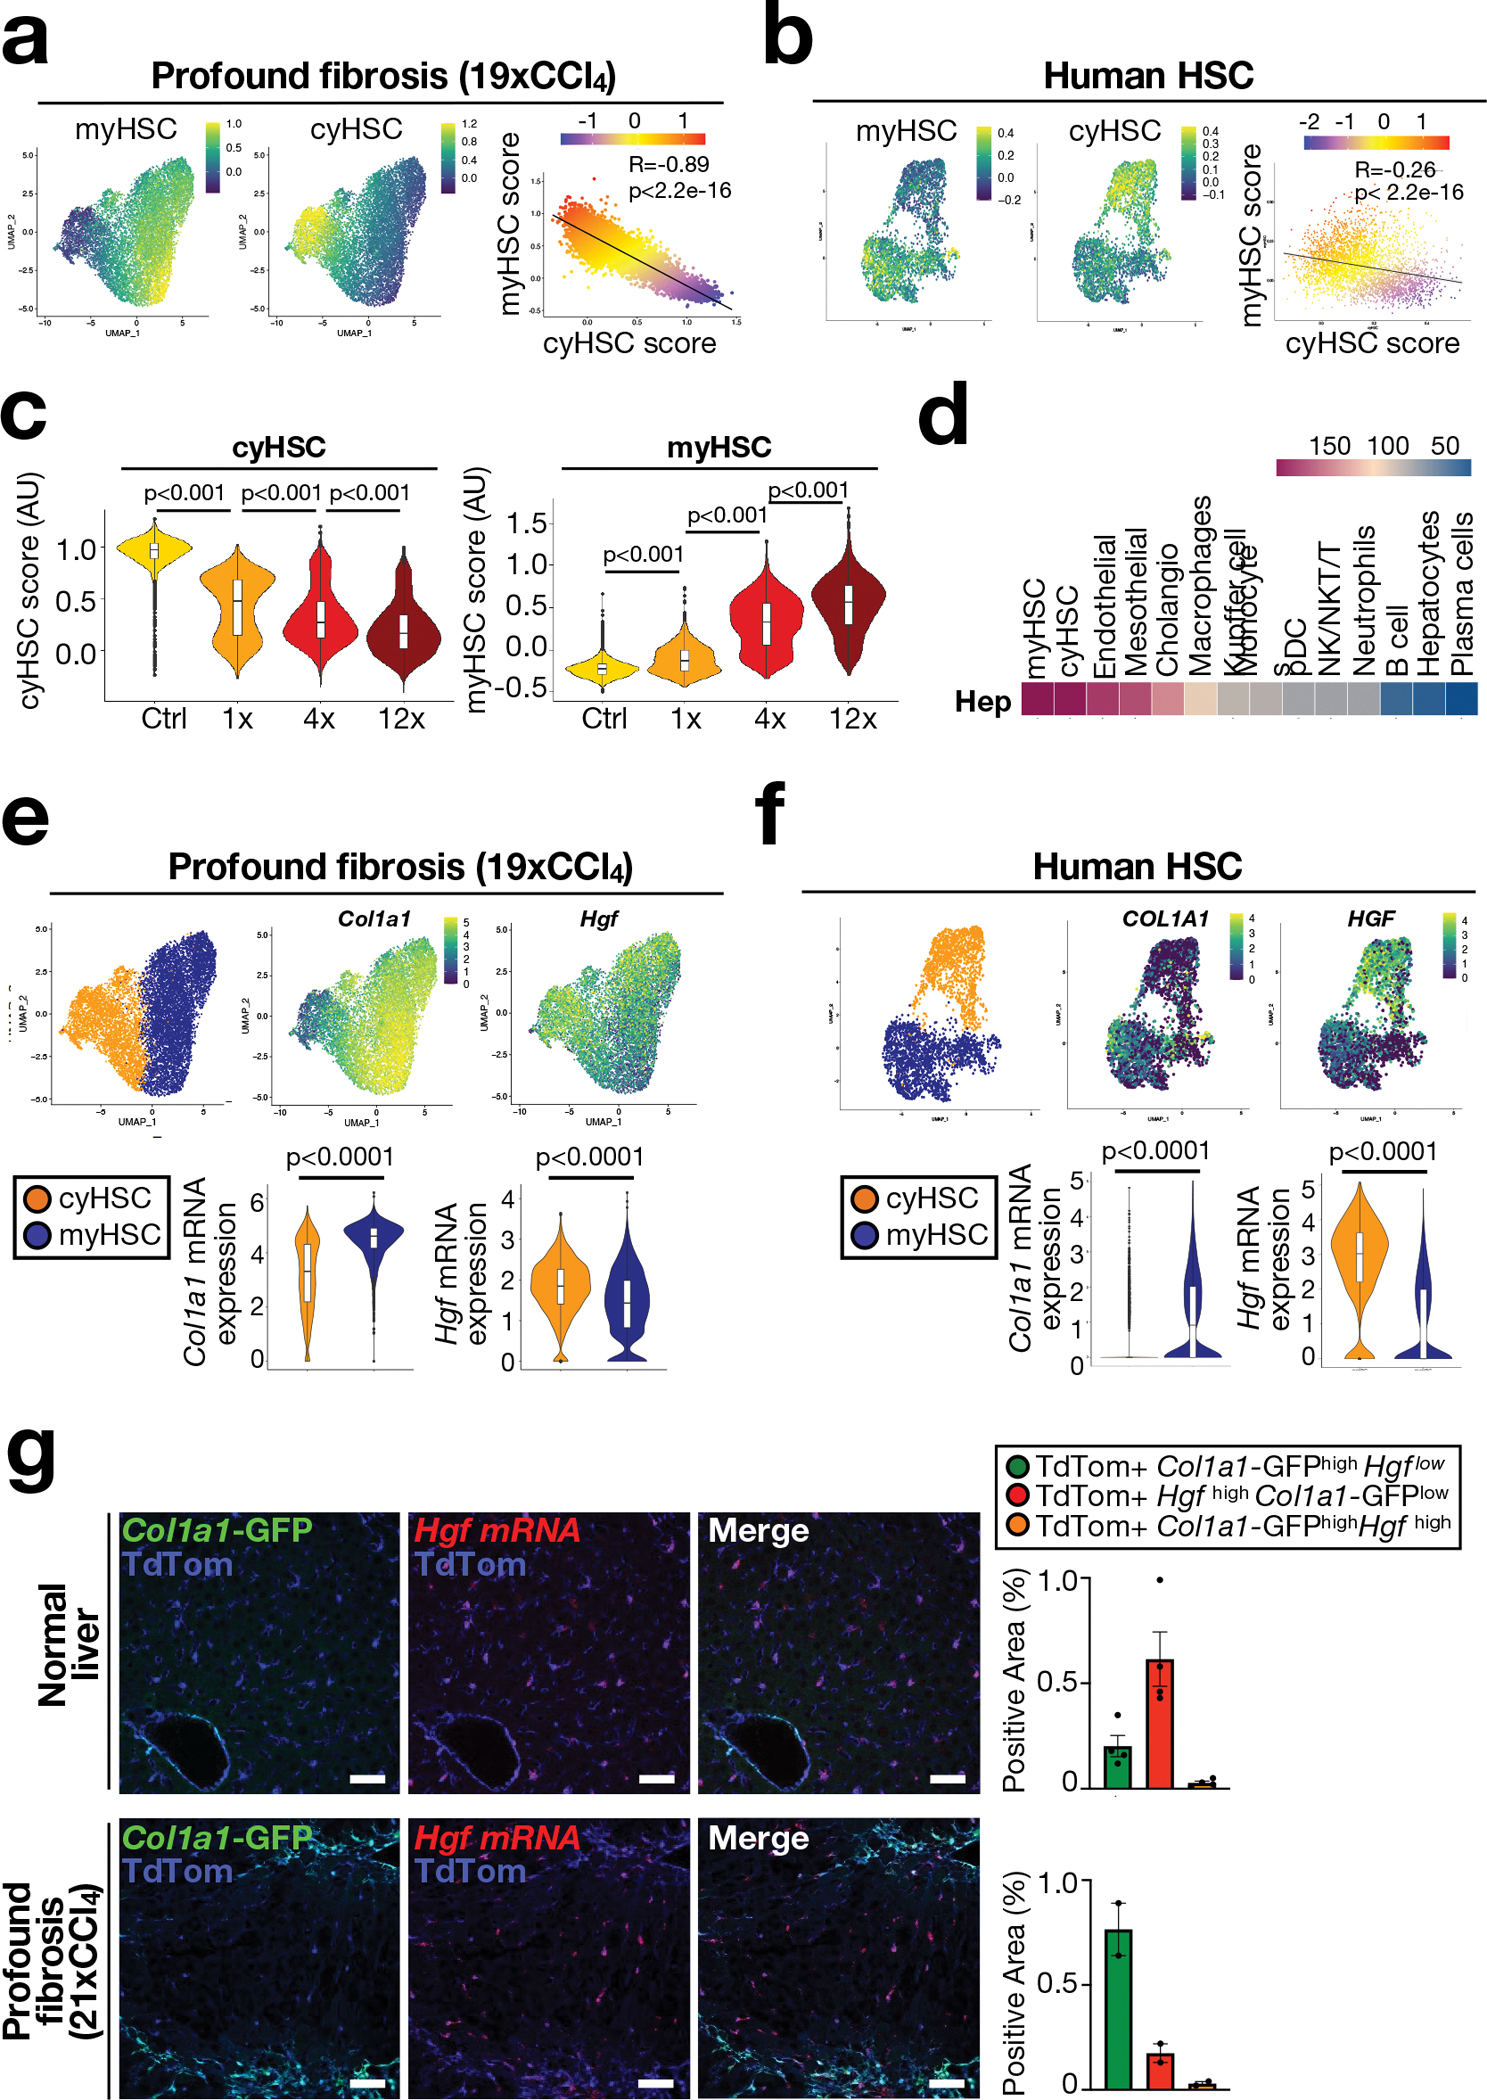
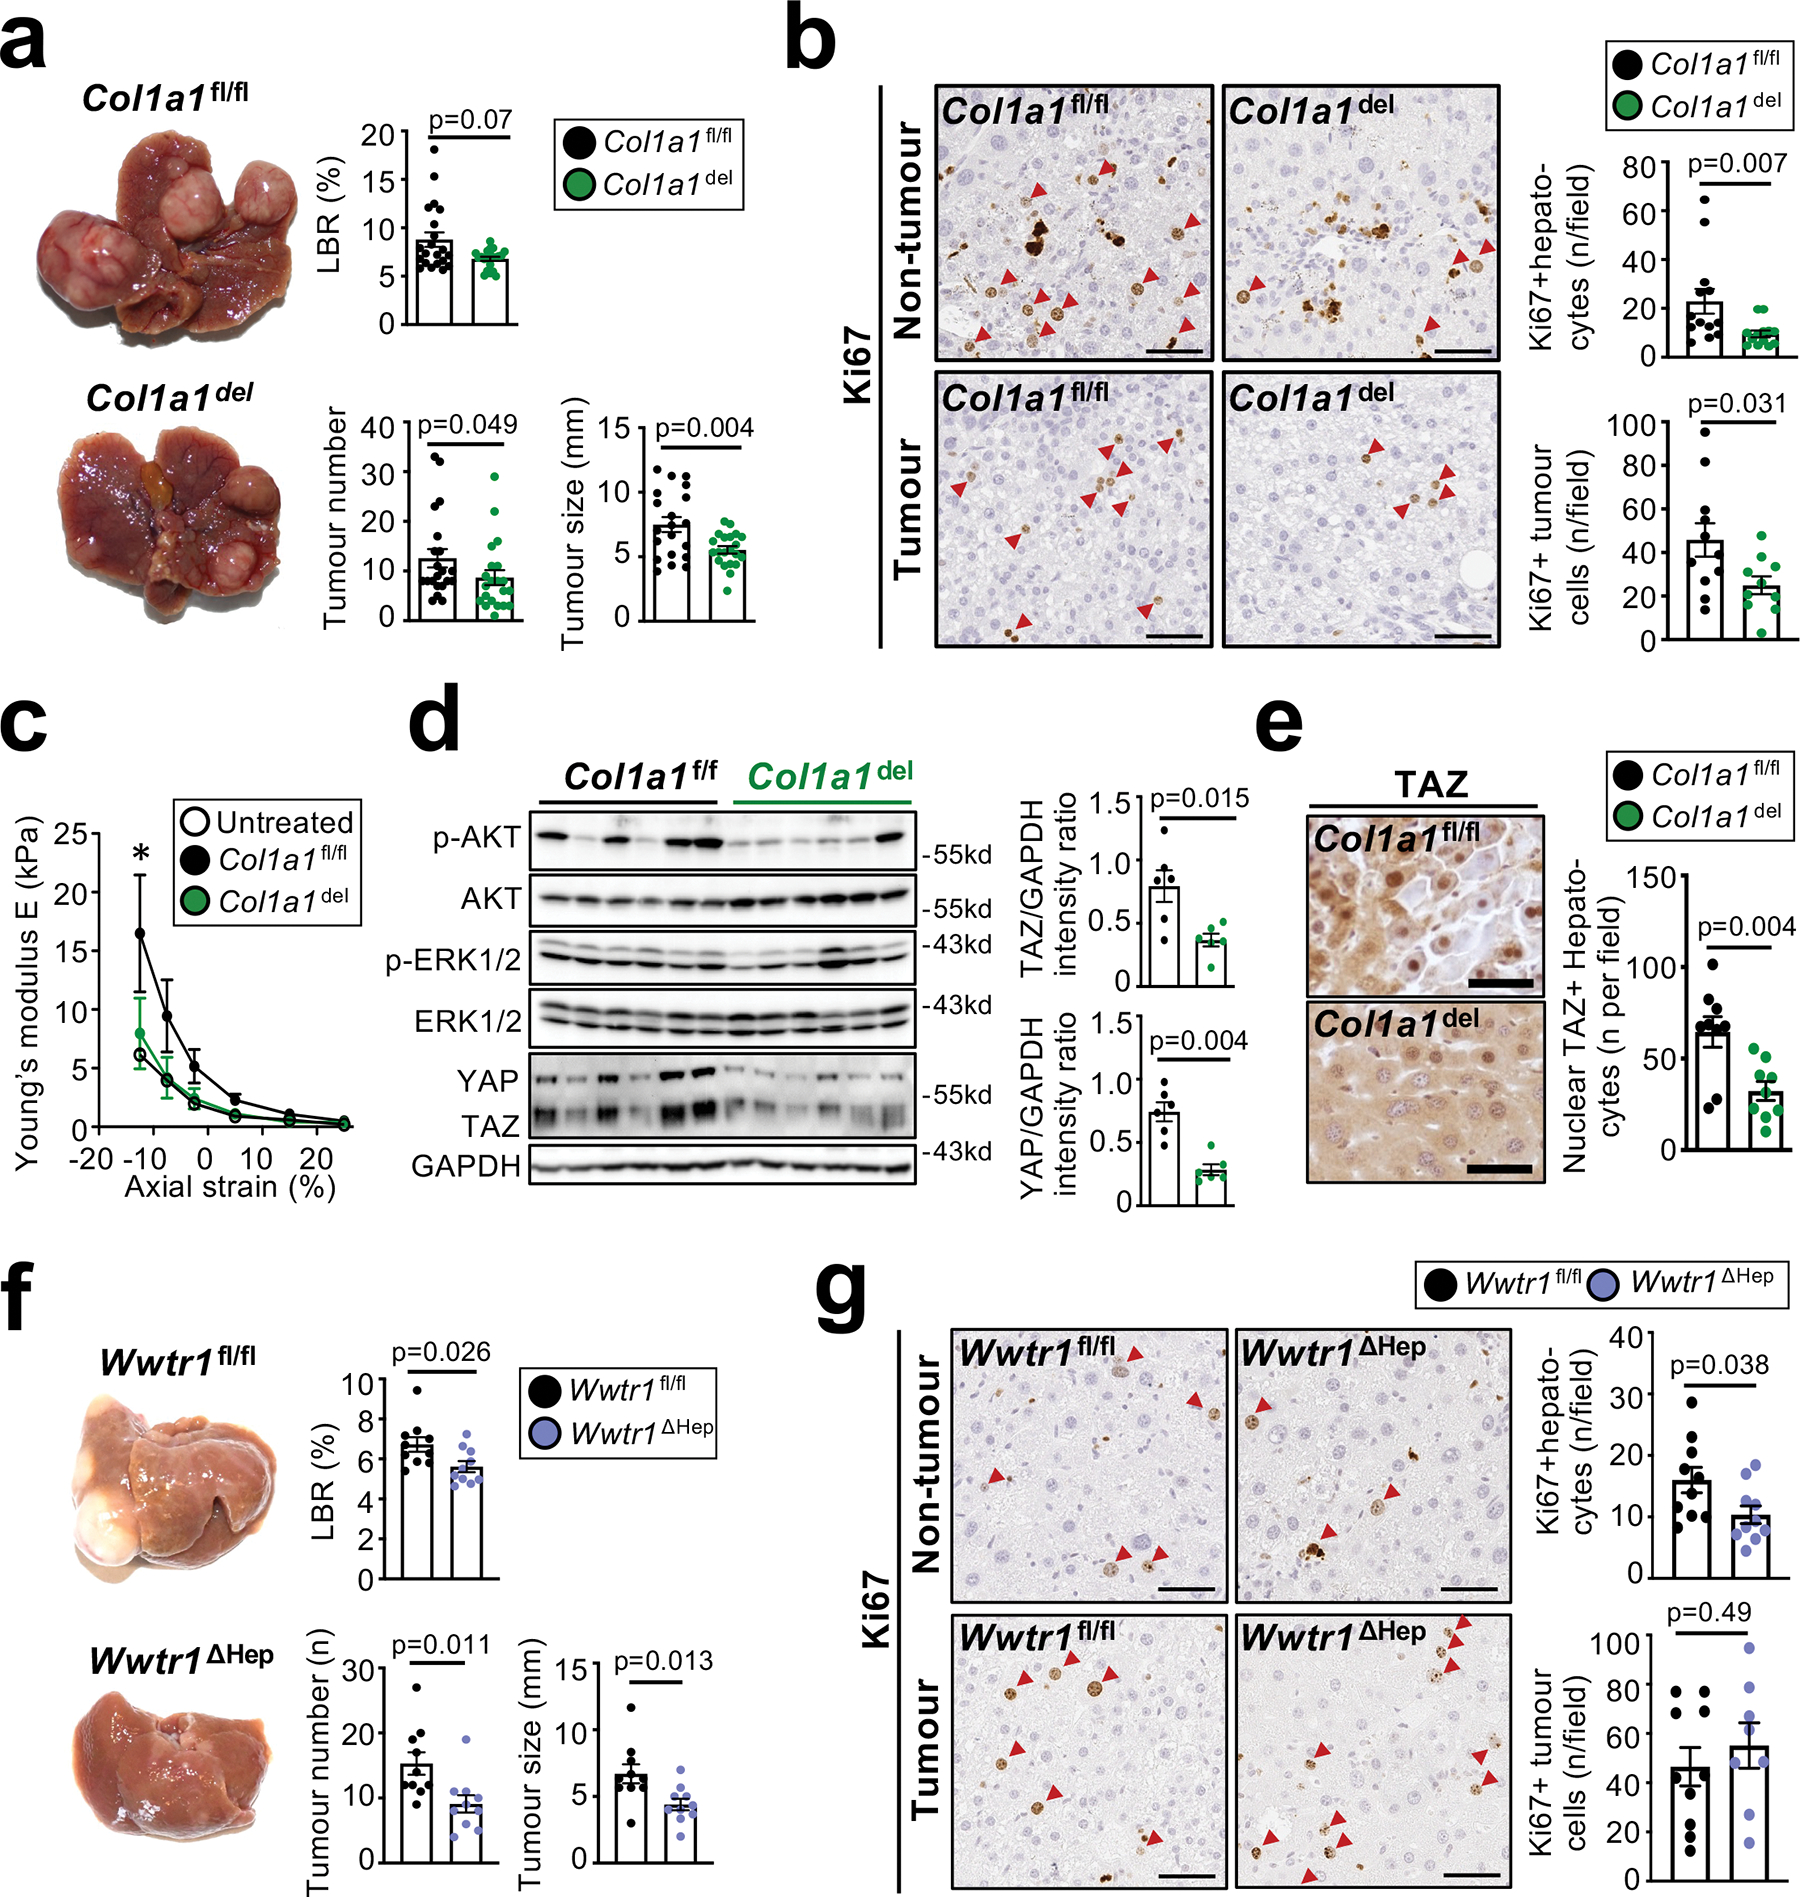
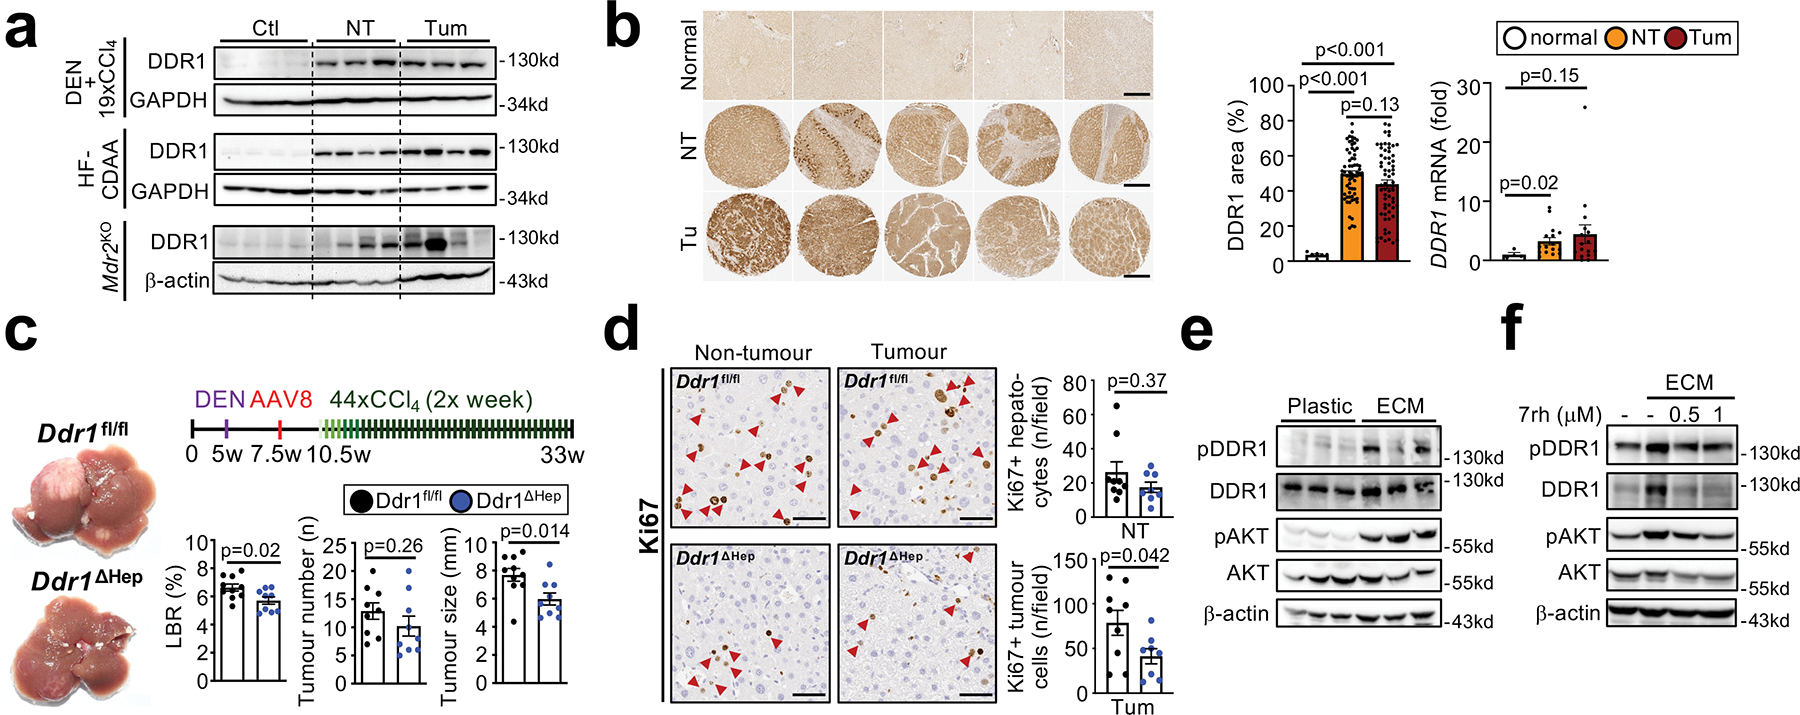
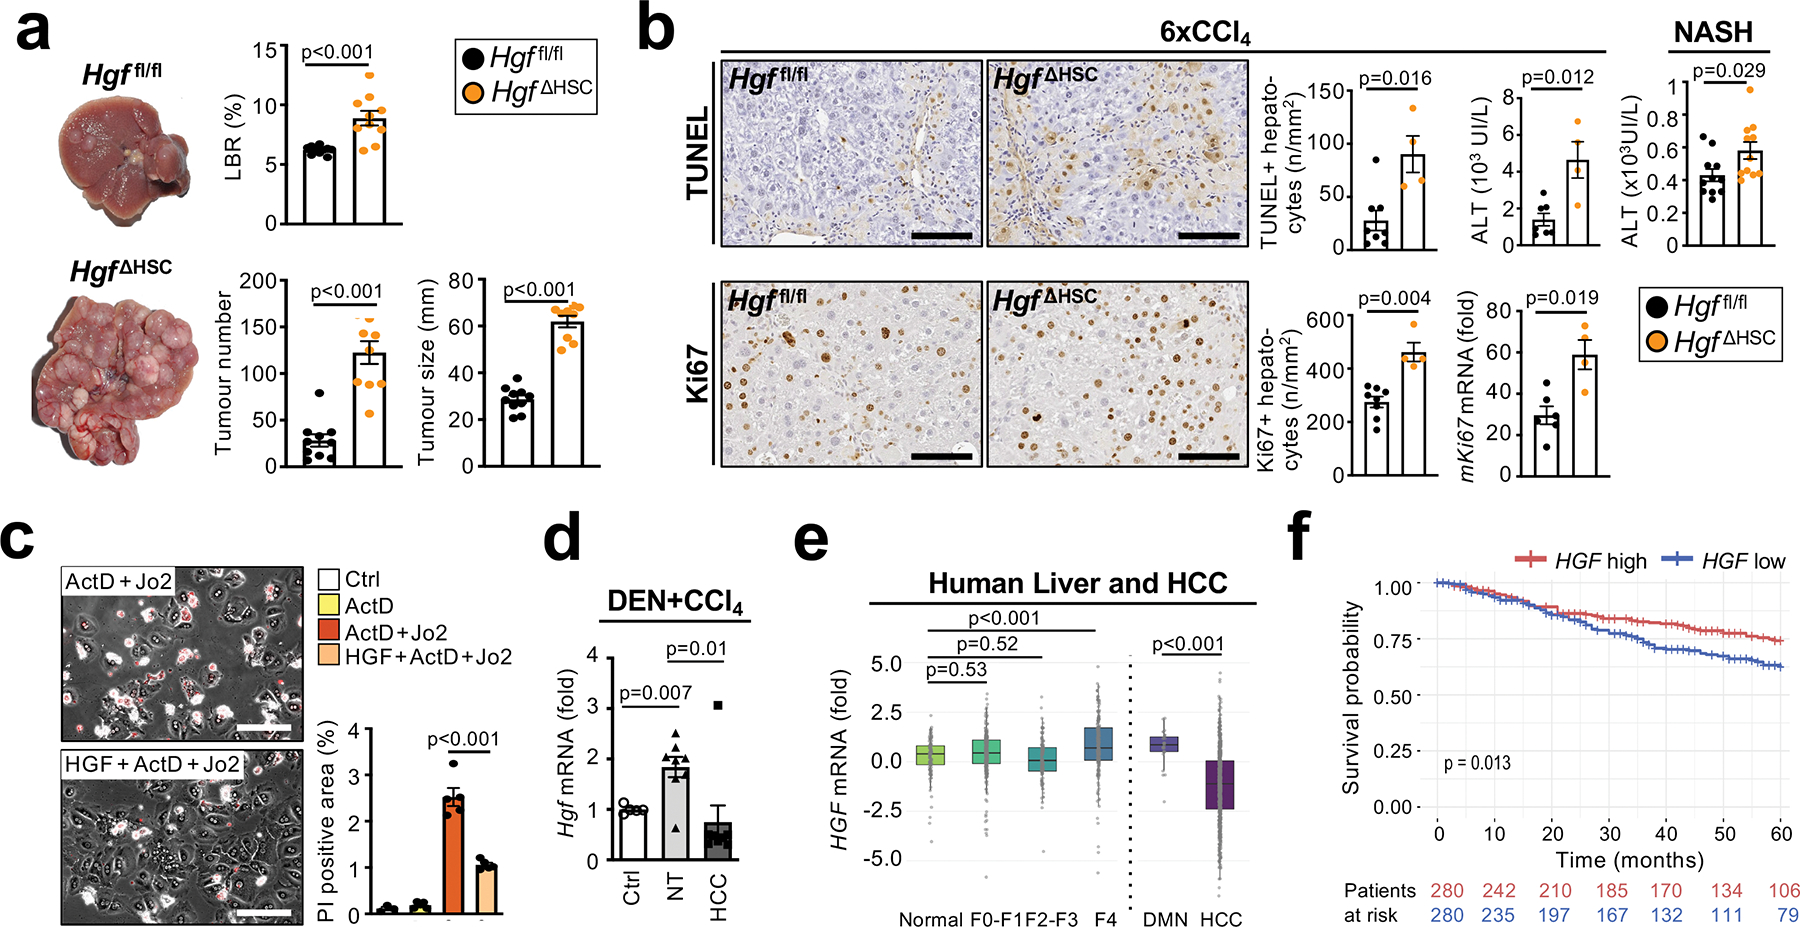
Hepatocellular carcinoma (HCC), the fourth leading cause of cancer mortality worldwide, develops almost exclusively in patients with chronic liver disease and advanced fibrosis1,2. Here we interrogated functions of hepatic stellate cells (HSCs), the main source of liver fibroblasts3, during hepatocarcinogenesis. Genetic depletion, activation or inhibition of HSCs in mouse models of HCC revealed their overall tumour-promoting role. HSCs were enriched in the preneoplastic environment, where they closely interacted with hepatocytes and modulated hepatocarcinogenesis by regulating hepatocyte proliferation and death. Analyses of mouse and human HSC subpopulations by single-cell RNA sequencing together with genetic ablation of subpopulation-enriched mediators revealed dual functions of HSCs in hepatocarcinogenesis. Hepatocyte growth factor, enriched in quiescent and cytokine-producing HSCs, protected against hepatocyte death and HCC development. By contrast, type I collagen, enriched in activated myofibroblastic HSCs, promoted proliferation and tumour development through increased stiffness and TAZ activation in pretumoural hepatocytes and through activation of discoidin domain receptor 1 in established tumours. An increased HSC imbalance between cytokine-producing HSCs and myofibroblastic HSCs during liver disease progression was associated with increased HCC risk in patients. In summary, the dynamic shift in HSC subpopulations and their mediators during chronic liver disease is associated with a switch from HCC protection to HCC promotion.


Conflict of interest statement

COMPETING INTEREST DECLARATION

The authors declare no conflict of interest beside:

B.I. has received honoraria from consulting with Merck, J&J/Janssen Pharmaceuticals, AstraZeneca and Volastra Therapeutics.

M.K. is a founder and SAB member of Elgia Pharma and received research support from Merck, Janssen Gossamer4 Bio.

Figures

Extended Data Figure 1 |
Extended Data Figure 1 |. Analysis of hepatic stellate cell senescence during liver fibrosis and HCC development.
a, qPCR showing Trp53 mRNA in FACS-sorted HSC isolated from p53f/f (n=2 mice) and p53ΔHSC mice (n=4 mice). b-d, HCC was induced in p53f/f (n=11 mice) and p53ΔHSC (n=14 mice) by injection of DEN (i.p. 25 mg/kg at 2 weeks old) followed by 14 injections of CCl4 (i.p. 0.5 μL/g, 1x/week) starting one month after DEN. HSC activation and fibrogenesis were assessed in by qPCR for fibrogenic genes Acta2, Col1a1 and Lox in the liver (b). Fibrosis was evaluated by Sirius Red staining (c). HCC is shown by representative pictures and the tumour burden measured by liver/body weight ratio (LBR), tumour number and tumour size (d). e, qPCR showing Rela mRNA in FACS-sorted HSC from Relaf/f and RelaΔHSC mice (n=3 mice/group). f-h, HCC was induced in Relaf/f (n=9 mice) and RelaΔHSC (n=10 mice) mice by injection of DEN (i.p. 25 mg/kg at 2 weeks old) followed by 17 injections of CCl4 (i.p. 0.5 μL/g, 1x/week). HSC activation and fibrogenesis was assessed by qPCR for the fibrogenic genes Acta2, Col1a1 and Lox in the liver (f). Fibrosis was evaluated by Sirius Red staining (g). HCC is shown by representative pictures and tumour burden measured by LBR, tumour number and tumour size (h). i-k, representative images showing senescence in specific cell types by senescence associated beta-galactosidase (SA-bGal) staining and co-staining for markers or lineage tracers of HSC (LratCre × TdTom), macrophages (anti-macrophage antibody), endothelial cells (endomucin antibody), cholangiocytes (CK19 antibody) and hepatocytes (AAV8-TGB-Cre × TdTom) in the CCl4 (n=3 mice) (i), HF-CDAA diet (n=1 mouse) (j) and Mdr2KO (n=1 mouse) (k) mouse models of fibrosis. l-m, representative images showing senescence in specific cellular compartments by p21 IHC in combination with lineage markers for HSC (LratCre × TdTom) and hepatocytes (AAV8-TGB-Cre × TdTom) in the CCl4 (l) and HF-CDAA diet (m) mouse models of fibrosis (from n=1 mouse per model). Data are shown as mean ± SEM, each data point represents one individual. Scale bars: 400 μm (c,g) and 100 μm (i-m). LBR: liver/body weight ratio. Data in b, c, d, e, g, Acta2 mRNA and Col1a1 mRNA in f, and LBR and tumour size in h were analysed by two-tailed Student’s t-test. Lox mRNA in d and tumour number in h were analysed by two-tailed Mann-Whitney test. Raw data are given in Source Data.
Extended Data Figure 2 |
Extended Data Figure 2 |. Genetic strategies to manipulate HSC during hepatocarcinogenesis.
a, Lhx2 mRNA in isolated HSC (n=5 mice), Kupffer cells (KC), endothelial cells (LSEC) and hepatocytes (n=3 mice each). b, Lhx2 mRNA in scRNAseq from normal mouse liver (n=1 mouse). c, qPCR showing deletion of Lhx2 by LratCre in whole liver: Lhx2f/f: n=8 mice, Lhx2ΔHSC: n=6 mice or FACS-sorted HSC (n=2 mice/group). d-f, deletion of Lhx2, achieved via Mx1Cre and poly I:C injection, increased liver fibrosis, shown by Sirius Red staining: Lhx2f/f: n=11 mice, Lhx2del: n=9 mice in non-tumour areas (d), HSC activation measured by qPCR: Lhx2f/f: n=11 mice, Lhx2del: n=8 mice (e); and promoted HCC development Lhx2f/f: n=11 mice, Lhx2del: n=9 mice (f) compared to Lhx2f/f littermates. g, LratCre-mediated Yap1 deletion (YapΔHSC) was confirmed in FACS-sorted HSC by qPCR: Yapf/f: n=2 mice , YapΔHSC: n=3 mice, and western blot (n=2 mice/group). h, YapΔHSC mice showed reduced fibrosis, evaluated by Sirius Red (n=15 mice/group) and HSC markers, measured by qPCR (Yapf/f: n=14 mice , Yap ΔHSC: n=15 mice), in non-tumour liver tissue from mice treated with DEN+CCl4. i, HSC depletion via LratCre-induced DTR significantly reduced Lrat mRNA in the DEN+CCl4 model: DTR neg: n=15 mice, DTR pos: n=16 mice. j-k, αSMA staining (n=13 mice/group) and qPCR for Acta2 and Col1a1 (n=12 mice/group) showed depletion of αSMA+ cells in non-tumour areas in αSMA-TKpos mice compared to αSMA-TKneg littermates after ganciclovir (GCV) injections in DEN+CCl4-induced HCC (j) and αSMA-TKpos mice developed fewer tumours (n=13 mice/group) (k). l, Liver fibrosis and deletion of Pdgfrb were determined by Sirius red staining and qPCR for Col1a1 and Pdgfrb in 4 month-old Mdr2KO PdgfrbΔHSC (n=13 mice) and Mdr2KO Pdgfrbfl/fl (n=13 mice) female mice. m, Tumour development was determined in 15 month-old Mdr2KO PdgfrbΔHSC (n=8 mice) and Mdr2KO Pdgfrbfl/fl (n=6 mice) female mice as described above. n, HCC development in mice overexpressing TAZS89A in hepatocytes receiving a NASH-FPC (n=13 mice) or chow diet (n=11 mice). o-q, DTRpos mice displayed efficient HSC depletion in the TAZ+FPC NASH-HCC model compared to DTRneg mice: DTRneg: n=10 mice, DTRpos: n=14 mice (o) as well as reduced tumour development: DTRneg: n=10 mice, DTRpos: n=14 mice (p), but no reduction of cholesterol and triglycerides measurement in non-tumour liver tissue (untreated: n=3 mice, TAZ+FPC in DTRneg: n=6 mice, TAZ+FPC in DTRpos: n=7 mice) (q). r-s, LratCre-positive DTRpos or DTRneg mice were subjected to DEN+HF-CDAA-induced spontaneous hepatocarcinogenesis, revealing efficient HSC depletion (n=4 mice/group) (r) as well as reduced tumour development in DTRpos mice (n=8 mice) compared to DTRneg mice (n=6 mice) (s). t-u, αSMA-TKpos or αSMA-TKneg mice were subjected to NICD+HF-CDAA-induced hepatocarcinogenesis, revealing efficient fibroblast depletion: αSMA-TKpos (n=8 mice) vs αSMA-TKneg mice (n=7 mice) (t) as well as reduced tumour development in αSMA-TKpos (n=8 mice) vs αSMA-TKneg mice (n=9 mice) (u). Data are shown as mean ± SEM, each data point represents one individual, all scale bars: 200 μm. GCV: Ganciclovir. Statistics: data in d, all data in e besides Lox mRNA, Sirius Red in h, i, tumour number and tumour size in k, data in l besides Col1a1 mRNA, o, p, r, s, t and data in u besides tumour number were analysed by two-tailed Student’s t-test. The following data: Lox mRNA in e, f, all data in h besides Sirius Red, j, LBR in k, Col1a1 mRNA in l, m, n, and tumour number in u were analysed by two-tailed Mann-Whitney test. Data in q were analysed by one-way ANOVA (p<0.001) followed by Tukey’s multiple comparison. Raw data are given in Source Data and uncropped western blots gels in Supplementary Information.
Extended Data Figure 3 |
Extended Data Figure 3 |. Hepatic stellate cell accumulation occurs predominantly in the PME and affect genes and pathways relevant for tumourigenesis and fibrosis.
a, co-localization of Col1a1-GFP+ and LratCre-induced TdTom was quantified in non-tumour (NT) and tumour (Tu) areas of DEN+CCl4- and TAZ-FPC-induced HCC (n=3 mice/HCC model – data related to Figure 2a). b, LratCre-TdTom+ HSC and Col1a1-GFP+ fibroblasts were visualized, and co-localization of Col1a1-GFP+ and LratCre-induced TdTom and the Col1a1-GFP/TdTom double-positive area were quantified in 15 month-old Mdr2KO-induced (n=3 mice) and HF-CDAA-diet-induced (n=2 mice) HCC. c, Fibrosis was visualized and quantified by Sirius Red in 15 month-old Mdr2KO-induced and HF-CDAA-diet-induced HCC (n=6 mice/group/HCC model). d, αSMA and Sirius Red quantification of paired non-tumour and human HCC developing in non-fibrotic livers (n=20 cases - data related to Figure 2b). e. UMAP visualization of cell populations from snRNA-seq of matching human non-tumour cirrhotic liver (n=2) and tumour (n=2) liver tissue pairs as well as the proportion of HSC/fibroblasts in both compartments. f-j, Bulk RNAseq of liver tissue from DEN+CCl4-treated Yapf/f (n=5), YapΔHSC mice (n=5) and normal liver (n=8 mice). The heatmap displays up- and downregulated differentially expressed genes (DEG) in non-tumour tissue based on DESeq2 analysis from bulk RNAseq (compared to the normal liver, adjusted p-value <0.1 and log2FC>0.5 or < −0.5) (f). Comparison of genes expression in Yapfl/fl and YapΔHSC tumour and non-tumour areas in DEN+CCl4-induced HCC (n=5 mice/group) data are displayed as volcano plot before and after removal of HSC genes, identified by scRNA-seq analysis, or filtering on hepatocyte genes, identified by scRNA-seq analysis (n=5 mice/group) (g). Metascape enrichment analysis of down-regulated DEG genes in non-tumour tissues of YapΔHSC compared to Yapf/f, all the pathway related to fibrosis and HSC-activation are marked in bold (n=5 mice/group) (h). Gene set enrichment of RNA-seq data revealed apoptosis and G2/M checkpoint as enriched in Yapfl/fl vs YapΔHSC non-tumour tissue (i). Displayed is the gene set enrichment analysis of the collection “Hallmark gene set” from the MSigDB with a FDRqval <0.25 in non-tumour tissues of Yap ΔHSC compared to Yap f/f (n=5 mice/group) (j). k-l, hepatocyte death (k) and proliferation (l) were determined by TUNEL assay: YAP f/f: n=15 mice, YAPΔHSC: n=16 mice, αSMA-TKneg, n=10 mice, αSMA-TKpos: n=5 mice and serum ALT measurement: Yap f/f: n=6 mice, YapΔHSC: n=6 mice, αSMA-Tk neg, n=10 mice, αSMA-TKpos: n=5 mice (k) and Ki67 IHC: αSMA-TKneg, n=8 mice, αSMA-TKpos: n=4 mice (i) in non-tumoural tissues. m-n, proliferation was determined by Ki67 IHC in the tumor compartment of YapΔHSC (n=14) and Yapfl/fl (n=13) (m) as well as DTRpos (n=9) and DTRneg (n=5) mice (n). Data are shown as mean ± SEM, each data point represents one individual (e-g), all scale bars: 100 mm NT: Non-tumour, Tu: Tumour. Data are shown as mean ± SEM, each data point (a-d) as well as the HSC-fibroblast percentage quantification (e) represents one individual, in d each dot represent one gen, all scale bars: 100 mm. Statistics: all data displayed in graph dotplots besides ALT measured in αSMA-TKneg and αSMA-TKpos in k were analysed by two-tailed Student’s t-test. ALT in αSMA-TKneg and αSMA-TKpos in k were analysed by two-tailed Mann-Whitney test. Raw data are given in Source Data.
Extended Data Figure 4 |
Extended Data Figure 4 |. Determination of the role of HSC/fibroblasts in hepatocarcinogenesis in established tumors and in a non-fibrotic HCC model and interaction with of regulation of hepatocyte proliferation, immune and endothelial cell compartments.
a-b, Ganciclovir injections into DEN+CCl4-treated αSMA-TKpos and αSMA-TKneg littermates at late time points, when large tumours were established and when CCl4 injections had ceased for 1.5 weeks, resulted in a strong reduction of αSMA+ cells in tumour but not in non-tumour areas (IHC: αSMA-TKneg, n=12 mice, αSMA-Tkpos: n=10 mice; Acta2 RNA: NT: αSMA-Tkneg, n=13 mice, αSMA-TKpos: n=9 mice; Tu: αSMA-TKneg, n=13 mice, αSMA-TKpos: n=11 mice) (a), and did not affect tumour progression (αSMA-TKneg, n=13 mice, αSMA-TKpos: n=11 mice) (b). c-d, HSC depletion via LratCre × DTR in a non-fibrotic HCC model, induced by hydrodynamic tail vein injection of sleeping beauty-mediated expression MET + CTNNB1-Myc-tag, was highly efficient, as determined by TdTom fluorescence (c) but did not affect liver/body weight ratio, tumour size, tumour number or tumour area assessed by Myc-tag staining (DTRneg: n=11 mice, DTRpos: n=7 mice) (d). e-f analysis of cell-cell interactions by CellPhoneDB in snRNA-seq data from cirrhotic liver patients (n=4 cases) revealed HSC as a major cell type interacting with hepatocytes (e) or between different hepatocytes clusters and liver cells populations in the mouse fibrotic liver induced by 8xCCl4 (n=3 mice) (f) as well as UMAP visualization of the proliferation marker Mki67 (n=3 mice) (f). g-h, FACS analysis of total CD45+ leukocytes (g), and lymphocytes and myeloid cells (h) in the PME and TME after αSMA+ cell depletion during HCC development induced by DEN+17xCCl4 (NT: n=8 mice per group, Tu: αSMA-TKneg, n=4 mice, αSMA-TKpos: n=5 mice - related to experiments in Extended Data Fig. 2 j–k) shows increased neutrophil and Ly6Chigh macrophage infiltration into non-tumour areas in αSMA-TK pos mice. i-j, CD45 IHC staining of the non-tumour and tumour tissue in DEN+CCl4 treated Yapfl/fl (n=10 mice) and YapΔHSC mice (n=12 mice) (i), and in HSC-depleted DTRpos mice compared to DTRneg mice (NT: DTR neg: n=10 mice, DTRpos: n=12 mice; Tu: DTR neg: n=9 mice, DT pos: n=11 mice) during HCC development induced by TAZ+FPC (j). k-l, endothelial cell analysis after HSC depletion induced by diphtheria toxin in DTRpos and DTRneg mice during HCC development induced by DEN+CCl4 or TAZ+FPC diet evaluated by endomucin staining (k) and qPCR for the endothelial cell markers Pecam1 (encoding for CD31) and Kdr (DEN+CCl4: NT: DTR neg: n=15 mice, DTR pos: n=14 mice; Tu: 16 mice per group; Kdr mRNA: NT: 14 mice per group; Tu: 16 mice per group; Pecam and Kdr mRNA: TAZ+FPC: NT: DTRneg: n=10 mice, DTRpos: n=14 mice; Tu: DTRneg: n=10 mice, DTRpos: n=13 mice) (l). Data are shown as mean ± SEM, each data point represents one individual (a-d and g-l), scale bars: 100 μm (a-j) or 200 μm (k). GCV: ganciclovir; LBR: liver/body weight ratio; NK: Natural Killer, KC: Kupffer Cell, DC: Dendritic cell, NT: Non-tumour, Tu: Tumour. Statistics: all data in a besides Acta2 in Tu, data in b besides LBR, d, g, all data in h besides B-cells, CD4+, CD8+, KC and Ly6ClowLy6Gneg in NT, CD45 in tumour in i, all data in l besides Kdr mRNA in DEN+CCl4 and TAZ FPC in tumour were analysed by two-tailed Student’s t-test. Data in a: Acta2 mRNA in Tu, LBR in b, data in c, B-cells, CD4+, CD8+, KC and Ly6ClowLy6Gneg in NT, CD45 in tumour in h, CD45 in NT in I, data in j and Kdr mRNA in tumour in l were analysed by two-tailed Mann-Whitney test. Raw data are given in Source Data and gating strategy for h in Supplementary Information 2.
Extended Data Figure 5|
Extended Data Figure 5|. Characterization of genetic mutations, inflammation, immune cell and tumor markers in mice with genetic HSC depletion, activation of inhibition.
a, Mutations detected by PCR and sequencing for Hras Q61K/R/L, Braf V584E and Egfr F254I in Lhx2 fl/fl (1 tumour/n; n=19 mice) vs Lhx2ΔHSC (1 tumour/n; n=7 mice) and Lhx2 del (1 tumour/n; n=19 mice) mice treatead with DEN; Yapfl/fl (2 tumours/n; n=14 mice) vs YapΔHSC (2 tumours/n; n=15 mice) mice and DTR neg (1 tumour/n; n=14 mice) vs DTR pos (1 tumour/n; n=15 mice) mice treated with DEN+CCl4. b, Tumour grading represents average of 3 tumours per mouse in Lhx2fl/fl (n=8 mice) and Lhx2ΔHSC (n=7 mice) mice subjected to the DEN model; in Yapfl/fl (n=14 mice) and YapΔHSC (n=16 mice) mice subjected to the DEN+CCl4 model and DTRneg (n=9 mice) and DTRpos (n=14 mice) mice subjected to the TAZ+FPC HCC model. c-e, Characterization of inflammation, immune cells and tumors severity by qPCR for T cell markers, inflammatory genes and tumor-relevant marker genes in tumors from Lhx2ΔHSC mice with HSC activation in comparison to mice to Lhx2 f/f littermates (n=7 mice per group) (c); YapΔHSC mice with HSC inhibition compared to Yapfl/fl mice (Cd3e, Cd4, Cd8, Ccl2, Ccl5, Tnfa, Ifng, Krt19, and Epcam mRNA: n=15 mice per group; Afp, Gpc3, Prom1, and Sox9 mRNA: YAP f/f: n=15 mice, YAPΔHSC: n=14 mice). (d); and DTRpos (n=16 mice) mice with HSC depletion compared to DTRneg (n=16 mice) mice (e). Data are shown as mean ± SEM, each data point represents one individual. Data are shown as mean ± SEM, each data point represents one individual. Statistics: a: Mutation frequency were analysed by Chi-square test. b: tumour grading data were analysed by two-tailed Student’s t-test. All data in c besides Afp and Sox9 mRNA, Afp, Gpc3 and Prom1 mRNA in d, and Prom1 and Sox9 mRNA in e were analysed by two-tailed Mann-Whitney test. Raw data are given in Source Data.
Extended Data Figure 6|
Extended Data Figure 6|. Analysis of the myHSC and cyHSC in mouse and human fibrotic livers.
a, UMAPs of myHSC and cyHSC by scRNAseq, each visualized specific signatures as well as the correlation of cyHSC and myHSC signature score in HSC isolated from mice fed with HF-CDAA NASH diet for 12 weeks (n=1 mouse), from a 3 month old Mdr2KO mice (n=1 mouse) or a mouse treated with TAZ+FPC diet (n=1 mouse). b, visualization and quantification of myHSC and cyHSC populations in HSC from healthy (n=4 individuals) and cirrhotic (n=4 individuals) human livers by snRNAseq. c, analysis of microarray data from isolated HSC shows that genetic HSC activation via Mx1Cre-mediated Lhx2 deletion (n=4 Lhx2fl/fl, n=4 Lhx2del) resulted in enriched myHSC signature and decreased cyHSC signature; and that genetic inhibition induced by LratCre-mediated Yap1 deletion (n=5 Yapfl/fl, n=4 YapΔHSC) exerted the opposite effect with enriched cyHSC and decreased myHSC signature in isolated HSC after treatment with 6xCCl4. d, pseudotime analysis (of HSC from TAZ+FPC and Mdr2KO) as well as cyHSC, myHSC, Col1a1 and Hgf mRNA expression in HSC using the same dataset as in a. f, In situ analysis of Hgf mRNA, visualized by RNAscope, Col1a1-GFP and LratCre-induced TdTom and subsequent quantification shows separate populations of Col1a1-GFP high Hgf low myHSC, and Col1a1-GFPlow Hgfhigh cyHSC in Mdr2 KO (n=3 mice) and TAZ+FPC-treated livers (n=1 mouse). f-g, analysis of Hgf and Col1a1 expression by bulk RNA-seq (Ctrl and CCl4: n=4 mice, FPC: n=5 mice) (f) or scRNA-seq (n=1 per condition) (g) of FACS-sorted HSC from control mice (Ctrl), or from CCl4-treated or TAZ-FPC-treated mice. Dot plot bar graphsare shown as mean ± SEM. In the violin plots, box plots represent the interquartile range (IQR), Q1, median and Q3, whiskers as minimum (Q1−1.5×IQR) and maximum (Q3+1.5×IQR), and outlier data as individual dots. Each data point represents one cell (a,b,d) individual (f and Mdr2KO model in e) or one field of the same liver (TAZ+FPC model in e). Scale bar 50 μm. Statistics: a: P-values, coefficient of determination (R2) and statistical significance (P value) were determined using Pearson’s. Data in d were analysed by two-tailed Mann-Whitney test. Data in b, d and g were analysed by two-tailed Mann-Whitney test. Data in f were analysed by two-tailed Student’s t-test. Raw data are given in Source Data.
Extended Data Figure 7 |
Extended Data Figure 7 |. Determination of the role of HSC in hepatocarcinogenesis at different time points.
a, The long-term effects of LratCre × DTR-mediated HSC depletion in the first half of DEN+CCl4-induced hepatocarcinogenesis was tested by sacrificing mice 1.5 days (n=3 mice per group), 28 days (DTRneg: n=5 mice, DTRpos: n=4 mice mice per group) and 42 days (DTRneg: n=6 mice, DTRpos: n=4 mice) after the last DT injection and determining LratCre-induced TdTom expression. b, LratCrepos DTRpos (n=9 mice) mice with HSC depletion in the first half of DEN+CCl4-induced hepatocarcinogenesis retained significant HSC depletion at time of sacrifice, as determined by qPCR for HSC markers Lrat and Des, but did not show significant changes in liver/body weight ratio (LBR), tumour number and tumour size compared to LratCrepos DTRneg littermates. c-d, Effects of poly I:C-induced Lhx2 deletion at early time points (c, n=9 mice per group) and late time points (d, (Lhx2f/f: n=10 mice, Lhx2del: n=12 mice) of DEN-induced HCC, as shown by representative images, liver/body ratio (LBR), tumour number and tumour size. Data are shown as mean ± SEM, each data point represents one individual, scale bars: 200 μm. Statistics: Data in a: one way ANOVA (p<0.001) followed by Bonferroni’s multiple comparison (comparison between samples sac at the same time point). Data in b, LBR in c, tumour number and tumour size in d, were analysed by two-tailed Student’s t-test. Tumour number and tumour size in c and LBR in d: were analysed by two-tailed Mann-Whitney test. Raw data are given in Source Data.
Extended Data Figure 8|
Extended Data Figure 8|. Collagen type 1 deletion reduces liver stiffness and HCC development in DEN+CCl4-, NASH diet- and Mdr2KO-induced HCC.
a-b, UMAP visualization showing that Col1a1 are mainly expressed in the HSC population in the 8xCCl4 injured mouse liver by scRNAseq (n=3 mice) (a) and in the HSC/fibroblast cluster in the human normal (n=4 individuals), cirrhotic (n=4 individuals) and HCC (n=2 individuals) livers by snRNAseq (b). c, Col1a1 mRNA expression, measured by qPCR, in untreated liver (n=5 mice, left panel) and the non-tumour tissue (n=8 mice) from DEN+14xCCl4 treated mice; COL1A1 mRNA expression in normal (n=84 individuals) and adjacent non-tumour tissue from patients with F0-F1 (n=143 individuals), F2-F3 (n=59 individuals) and F4 (n=76 individuals) fibrosis (right panel). d-e, Mx1Crepos Col1a1f/f (Col1a1del) showed significant reduction of fibrosis in non-tumour tissue, determined by Sirius Red staining and Col1a1 mRNA, compared to Col1a1f/f littermates in a profound fibrosis DEN+44xCCl4 model (Col1a1 f/f: n=13 mice, Col1a1 del: n=14 mice) (d), and reduction of liver stiffness, determined by rheometry (control: n=1 mouse; DEN+19xCCl4: n=4 mice/group) (e). f, Sirius red staining shows a strong increase of fibrosis, in the non-tumour tissue, induced by the profound fibrosis DEN+19xCCl4 regimen (0.5 to 1.5 μl of CCl4 per gram 2–3 injections/week; n=5 mice) compared to a moderate fibrosis model induced by DEN+10xCCl4 (0.5 μl of CCl4 per gram, 1 injection/week; n=5 mice; untreated controls n=3 mice). g, Col1a1del mice treated with the moderate fibrosis DEN+15xCCl4 (0.5 μl of CCl4 per gram, 1injection/week as in f) reduced liver fibrosis (Col1a1f/f: n=10 mice, Col1a1 del: n=14 mice) and Col1a1 mRNA (Col1a1f/f: n=11 mice, Col1a1del: n=8 mice) (g), but did not alter HCC development in comparison to Col1a1 fl/fl mice (Col1a1f/f: n=17 mice, Col1a1del: n=14 mice) (h) or i, liver stiffness assessed by rheometry in the non-tumour tissue from mice treated with DEN+10xCCl4 (one injection per week as in f-h, n=3 mice for untreated and n=5 mice/group for DEN+CCl4). j-k, Mx1Cre-mediated Col1a1 deletion in Mdr2KO female mice (Mdr2KO Col1a1 del, n=11 mice and n=7 mice for Col1a1 mRNA) efficiently reduced liver fibrosis (j) and HCC development (k), compared to Mx1Creneg Mdr2KO littermates (Mdr2KO Col1a1fl/fl, n=18 and n=7 mice for Col1a1 mRNA). l, Liver stiffness assessed by rheometry was reduced in 22 week old Mdr2 KO Col1a1del male mice (n=2 mice) compared to their. Col1a1fl/fl Mdr2KO (n=3 mice) littermates, livers from 8 week old untreated mice were used as control (n=3). m-o, HSC-selective ablation of Col1a1 in LratCrepos Col1a1f/f (Col1a1ΔHSC) efficiently reduced liver fibrosis (Sirius Red: Col1a1f/f: n=16 mice, Col1a1ΔHSC: n=14 mice; Col1a1 mRNA: Col1a1f/f: n=15 mice, Col1a1ΔHSC: n=13 mice) (m), HCC development (Col1a1f/f: n=16 mice, Col1a1ΔHSC: n=14 mice), (n) as well as hepatocyte proliferation in the non-tumour liver, as determined by Ki67 IHC and quantification of proliferating hepatocytes (Col1a1f/f: n=13 mice, Col1a1ΔHSC: n=14 mice; Ki67+ tumour cells: n=9 mice) (o), compared to Lratneg littermate controls (Col1a1fl/fl) in the DEN + CCl4 profound fibrosis model (as in d). p-r, Col1a1ΔHSC mice displayed strong reductions of liver fibrosis (p), HCC development (q), but not in liver triglycerides and cholesterol content (r) compared to Col1a1fl/fl control mice in a model of NASH-associated HCC induced by 8 months of HF-CDAA diet (Col1a1fl/fl: n=4 mice for Sirius red and triglycerides, n=11 mice for Col1a1 mRNA and HCC, Col1a1ΔHSC: n=7 mice for Sirius red and triglycerides, n=10 mice for Col1a1 mRNA and HCC). Data are shown as mean ± SEM, box plots represent the interquartile Range (IQR), Q1, median and Q3, each data point represents one individual (c-r), scale bars: 200 μm (d, f, g, j, m and p), 50 μm (o), Red arrows show the Ki67+ proliferating hepatocytes or tumour cells. Statistics: Col1a1 mRNA in mouse liver in c, data in d, f, g, LBR and tumour number in h, j, LBR and tumour size in k, m, LBR and tumour size in n, o, p, q and cholesterol in r were analysed by two-tailed Student’s t-test. Tumour size in h, tumour number in k and in n, and triglycerides in r were analysed by two-tailed Mann-Whitney test. # P<0.05, **,## P<0.001, ### P<0.001. Data in c and l: COL1A1 mRNA in human liver was analysed by one-way ANOVA (Kruskal-Wallis’s test) followed by Dunn’s multiple comparison test with normal liver group. Data in e: was analysed by two-way ANOVA followed by Tukey’s multiple comparison test. Raw data are given in Source Data.
Extended Data Figure 9|
Extended Data Figure 9|. Characterization of Col1a1 on hepatocyte death, HSC activation, inflammation and immune cell infiltration and YAP activation and effects of hepatocyte-specific Yap or Itgb1 deletion on hepatocarcinogenesis.
a-b, Col1a1f/f and Col1a1del mice were treated with the profound fibrosis DEN+44xCCl4 regimen. Hepatocyte death was determined by TUNEL staining (n=6 mice per group) in non-tumour tissue at the end of the DEN+44xCCl4 regimen 1 week after the last CCl4 injection, as well as by ALT measured 2 days after 20xCCl4 (n=6 per group) (a). HSC activation and inflammation were assessed by αSMA staining (n=8 per group) and qPCR for HSC activation and inflammatory markers in non-tumour tissue two days after 44xCCl4 (n=8 mice per group) (b). c-d, HSC activation and Il1b mRNA were assessed in Col1a1f/f (n=11 mice) and Col1a1ΔHSC (n=1 mice) mice fed eight months with HF-CDAA diet (c) and in 14 months-old Mdr2KO x Col1a1f/f and Mdr2KO x Col1a1del mice (n=7 mice per group) (d). e-g, Determination of CD45+ lymphocytes (e), myeloid subpopulations) (f) and lymphoid (g) subpopulations by FACS in tumour and non-tumour areas of LratCreneg Col1a1fl/fl mice (n=5 mice) and LratCrepos Col1a1fl/fl mice (Col1a1ΔHSC, n=5 mice) with the profound fibrosis DEN+44xCCl4 regimen. h, YAP staining in Col1a1fl/fl and Col1a1del mice treated with the profound fibrosis DEN+19xCCl4 showed YAP expression mostly in non-parenchymal cells rather than in hepatocytes. i, Yap was efficiently delete by injection of AAV8-TBG-Cre (YapΔHep, n=10 mice) compared to AAV-TGB-empty (Yapfl/fl, n=14 mice) but did not affect HCC development were in the DEN+CCl4 profound fibrosis HCC model determined by liver/body weight ratio (LBR), tumour number and tumour size. j, Itgb1fl/fl mice were injected with either AAV8-TGB-empty (Itgb1fl/fl, n=13) or AAV8-TBG-Cre (Itgb1ΔHep, n=11) and effects of hepatocyte-specific Itgb1 deletion on HCC development were determined in the DEN+CCl4 profound fibrosis HCC model by the liver/body weight ratio (LBR), tumour number and tumour size. Data are shown as mean ± SEM, each data point represents one individual. NT: non-tumour, Tum: tumour NK: Natural killer, Treg: T regulatory cells, GZB: Granzyme B, DC: Dendritic cells, KC: Kupffer cells, LBR: liver/body weight ratio. Scale bars: 100 μm (a and h), 200 μm (b). Statistics: TUNEL in a, data in b and d besides Il1b mRNA, Col1a2 mRNA in c, f, data in g besides B cells, NKT cells, CD8 and Tregs in non-tumour area, i, and data in j besides LBR were analysed by two-tailed Student’s t-test. ALT in a, Il1b mRNA in b and d, all data in c besides Col1a2, e, B cells, NKT cells, CD8 and Tregs in non-tumour area in g and LBR in j were analysed by two-tailed Mann-Whitney test. Raw data are given in Source Data and gating strategy for e-g in Supplementary Information 4.
Extended Data Figure 10 |
Extended Data Figure 10 |. Regulation and role of DDR1 in the fibrotic liver and HCC development.
a, UMAPs of scRNA-seq data showing hepatocyte Ddr1 expression from normal (n=1 mouse) and 8xCCl4 fibrotic mouse livers (n=3 mice – top panel) and of snRNA-seq from patients showing DDR1 expression in hepatocytes HCC from healthy patients (n=4 individuals), non-tumor (n=2 individuals) and cirrhotic (n=2 individuals) or HCC tumour (n=2 individuals) liver tissues (bottom panel). b, Huh7, Hepa1–6, HepG2 HCC cells and mouse primary hepatocytes were treated with different cytokines for 24h, followed by immunoblotting for DDR1 and GAPDH (each n=1 well, n=1 experiment). c, Confirmation of Ddr1 deletion by pPCR in non-tumour liver and tumour liver from AAV8-TGB-empty treated Ddr1fl/fl and AAV8-TGB-Cre treated Ddr1ΔHep mice treated with DEN+44xCCl4 (in NT: Ddr1f/f: n=9 mice, Ddr1ΔHep n=8 mice; in Tu: Ddr1f/f: n=10 mice, Ddr1ΔHep n=8 mice - related to Fig. 5c). d, Fibrosis, αSMA+ myofibroblast accumulation and Ddr1 mRNA expression within tumours were quantified by Sirius Red staining, IHC and qPCR, respectively, in the ”moderate fibrosis” DEN + 14xCCl4 HCC model (αSMA and Sirius Red: n=10 mice; Ddr1 mRNA n=11 mice) and in the “profound fibrosis” DEN+44xCCl4 HCC model (αSMA and Sirius Red: n=9 mice; Ddr1 mRNA n=10 mice). e-f, Huh7 HCC cells (n=3 biological replicate; n=2 experiments) (e) and primary mouse hepatocyte (n=1 well; n=1 experiment) (f) were plated on either plastic or fibroblast ECM, samples were harvested at 24h or at the indicated times after plating, followed by western blot for pDDR1, DDR1, pAKT, AKT and b-actin or GAPDH. g, Huh7 cells were plated on ECM from wild-type fibroblasts or from MMP-resistant Col I (RR) fibroblasts, followed by western blot for pDDR1, DDR1, pAKT, AKT and b-actin (n=1 well, n=3 experiments). h, expression of collagen-degrading MMPs, determined by qPCR, in the profound fibrosis DEN+CCl4 model (n=4 normal liver controls [Ctrl], n=9 mice for non-tumour [NT] and tumour [Tu] samples). i, survival analysis in the TCGA dataset based on the expression of a collagen-degrading MMP signature (MMP1, MMP2, MMP8, MMP9, MMP13 and MMP14). j, YAP, TAZ, GAPDH, pAKT and AKT expression were determined by western blot in non-tumor tissue from Ddr1fl/fl and Ddr1ΔHep mice (n=6 mice per group). k, Infiltration of CD3+ T cells was determined by IHC and quantified in both non-tumor and tumor tissue (CD3 IHC, Cd3e and Ptprc mRNA in non-tumour area: Ddr1f/f: n=9 mice, Ddr1ΔHep n=8 mice; CD3 IHC, Cd3e and Ptprc mRNA in non-tumour area: Ddr1f/f: n=10 mice, Ddr1ΔHep n=8 mice); expression of Cd3e and Ptprc (encoding CD45) was determined by qPCR. Data are shown as mean ± SEM, each data point represents one well (b,e,f,g) or one individual (c,h,k); scale bars: 200 μm (d), 50 μm (k). nd: non-detected. Immunoblots in j were performed on two different gels using the same samples: one gel for YAP/TAZ and GAPDH and a second gel for pAKT and AKT. Data are shown as mean ± SEM. Statistics: Ddr1 mRNA in NT in c, data in d, CD3+ IHC and Cd3e mRNA in non-tumour and Ptprc mRNA in tumour in g were analysed by two-tailed Student’s t-test. CD3+ IHC and Cd3e mRNA in tumour and Ptprc mRNA in non-tumour in g were analysed by two-tailed Mann-Whitney test. Data in h were analysed by one way ANOVA (Kruskal Wallis) for Mmp2 (p<0.001), Mmp8 (p=0.004) and Mmp9 mRNA (p=0.004) followed by Dunn’s multiple comparison or for Mmp13 (p=0.001) and Mmp14 mRNA one-way one-way ANOVA (p<0.001) followed by Tukey’s multiple comparison. Raw data are given in Source Data and raw western blot gels in Supplementary Information.
Extended Data Figure 11|
Extended Data Figure 11|. Expression and role of myHSC-enriched hyaluronan and cyHSC-expressed HHIP and CXCL12 in hepatocarcinogenesis.
a, UMAP visualization and dotplot show predominant expression of Has2 in myHSC in the profound fibrosis regimen, induced by 19xCCl4 (n=1 mouse). b, bulk RNA sequencing in FACS-sorted HSC showed upregulation of Has2 in HSC from 12xCCl4-injured liver (n=4 mice) compared to quiescent HSC (n=4 mice). c-d, HCC was induced by DEN+14xCCl4 and hyaluronan (HA) staining showed strong reduction of HA deposition in Has2ΔHSC mice compared to Has2f/f littermates (n=13 mice per group) (c). HCC evaluation showed a slight reduction of HCC development in Has2ΔHSC (n=20 mice) mice compared to Has2f/f littermates (n=21 mice) (d). e, UMAPs of Hhip and Cxcl12 mRNA in normal (n=1 mouse) and in 8xCCl4-treated (n=3 mice) mouse livers. f, Mice with LratCre-mediated conditional deletion of Hhip (HhipΔHSC) show efficient deletion in healthy control liver (n=4 mice), non-tumor tissue and tumor tissue (Hhipf/f: n=17 mice, HhipΔHSC n=10 mice) as well as upregulation of Hedgehog target gene Gli1 in comparison to Hhip f/f controls. g, HhipΔHSC (n=11 mice) and Hhipfl/fl (n=17 mice) mice were subjected to DEN-induced hepatocarcinogenesis, followed by evaluation of the liver/body weight ratio (LBR), tumour size and tumour number. h, Deletion of Cxcl12 was determined by qPCR in HSC isolated from mice with LratCre-mediated deletion (Cxcl12ΔHSC) in comparison to Cxcl12fl/fl HSC (n=2 mice per group). i, Cxcl12ΔHSC (n=12 mice) and Cxcl12fl/fl (n=14 mice) mice were subjected to DEN+CCl4 induced HCC followed by evaluation of the liver/body weight ratio, tumour size and tumour number. Data are shown as mean ± SEM. In the dotplot graphs, each data point represent one cell (a) or one individual (b,c,d,g,h,i), scale bars: 400 μm. Statistics: Data in a, LBR in d, Gli1 mRNA in non-tumour in f, LBR in g and i were analysed by two-tailed Mann-Whitney test. Data in b, c, all data in d besides Gli1 mRNA, LBR in g and i, were analysed by two-tailed Student’s t-test. Raw data are given in Source Data and Supplementary Information.
Extended Data Figure 12|
Extended Data Figure 12|. HGF deletion in HSC promotes fibrosis and inflammation in CCl4-induced liver injury.
a-c, UMAP visualization of Hgf and/or Met in the 8xCCl4 injured (n=3 mice) (a) or normal mouse livers (n=1) by scRNAseq (c) and in the human normal (n=4 cases), cirrhotic (n=4 cases) and HCC (n=2 cases) livers by snRNAseq (b). d, significant reduction of Hgf mRNA in normal (n=4 mice/group) and CCl4 liver (UT: n=3 mice, Hgf fl/fl: n=8 mice, Hgf ΔHSC: n=7 mice) as well as of HGF protein in liver (UT: n=4 mice, CCl4: n=5 mice/group) e, Fibrosis was assessed by Sirius Red staining in the non-tumour tissue from Hgf ΔHSC mice (n=10 mice) compared to Hgf f/f littermates (n=11 mice) during HCC development induced by DEN+12xCCl4. f, HSC activation was determined by qPCR for the fibrogenic genes Col1a1 and Lox in livers from Hgf ΔHSC (n=4 mice) and Hgf f/f mice (n=7 mice) treated with injections of 6xCCl4. g, flow cytometric analysis of CD45+ cells as well as myeloid and lymphocyte populations in livers from Hgf ΔHSC (n=7 mice) compared to Hgf f/f mice (n=8 mice) treated with injections of 6xCCl4. h, qPCR for inflammatory genes from Hgf ΔHSC (n=7 mice) and Hgf f/f (n=8 mice) livers after treatment with 6xCCl4 injections. i, Liver/body ratio (LBR) in Hgf fl/fl (Ctrl: n=10 mice, pHx: n=6 mice) and Hgf ΔHSC (Ctrl: n=8 mice, pHx: n=7 mice) mice in untreated mice or after 48h partial hepatectomy (pHx) (left panel). Hepatocyte proliferation assessed by Ki67 staining 48h after PHx (right panel - Hgf f/f: n=6 mice, Hgf ΔHSC: n=7 mice). Data are shown as mean ± SEM, each data point represents one individual, scale bars: 200 μm. GZB, granzyme B. Statistics: Data in d-g and i were analysed by two-tailed Student’s t-test. Data in h were analysed by two-tailed Mann-Whitney test. Raw data are given in Source Data and gating strategy for g in Supplementary Information 5.
Extended Data Figure 13|
Extended Data Figure 13|. Dysbalance between myHSC and cyHSC occurs in advanced liver disease and elevates HCC risk in patients.
a, UMAP visualization showing that the genes from the myHSC and cyHSC signatures, encoding secreted mediators, are strongly enriched in myHSC or cyHSC, and weakly or not expressed in other liver cell populations in 8xCCl4 injured mouse liver (n=3 mice) analysed by scRNAseq. b, myHSC and cyHSC secreted gene signatures were applied to bulk RNA-seq data from cohorts of patients with HCV-induced liver disease (GSE10140) or NAFLD/NASH-induced liver disease (GSE49541), and the proportion of patients with high cyHSC/myHSC dysbalance was determined as described in the methods. c, HCC incidence was compared between patients with high cyHSC/myHSC dysbalance (i.e. a status with higher myHSC and lower cyHSC) and low cyHSC/myHSC dysbalance (i.e. a status lower myHSC and higher cyHSC) in a HCV-induced liver disease cohort (GSE15654). Statistics: data in b were analysed by two-sided Fisher’s exact test. Survival curves in c were represented using the Kaplan-Meier method and compared with log-rank statistics.
Figure 1 |
Figure 1 |. Promotion of HCC development by hepatic stellate cells.
a-b, Induction of liver fibrosis, shown by Sirius Red staining, and Col1a1 by HSC-selective Lhx2 deletion via LratCre (Lhx2ΔHSC) compared to Lhx2f/f littermates (n=7–8 mice/group), (a) and increased DEN-induced HCC, shown by representative liver pictures, the liver-body ratio (LBR), tumour number and size (b). c-d, Decreased DEN+CCl4-induced HSC activation in YapΔHSC compared to Yapfl/fl mice (n=15–16/group), shown by αSMA IHC and Col1a1 qPCR (c), as well as reduced HCC burden (d). e-f, Efficient HSC depletion in non-tumour tissue in the DEN+CCl4 model in DTRpos compared DTRneg LratCrepos, TdTompos littermates (n=16–17/group), determined by TdTom fluorescence and Col1a1 qPCR (e) as well as reduced tumour development (f). Data are shown as mean ± SEM, each data point represents one individual, Tu: Tumour, HTVI: hydrodynamic tail vein injection, all scale bars: 200 μm. Details of sample sizes, biological replicates and statistical tests are given in the Additional Information and Source Data.
Figure 2 |
Figure 2 |. Hepatic stellate cell accumulation and activation occurs predominantly in the non-tumour environment.
a, HSC and collagen-expressing fibroblasts were visualized in non-tumour (NT) and tumour (Tu) areas of DEN+CCl4 and TAZ+FPC diet HCC models or the KRAS/sgp19 ICC model by LratCre-induced TdTom and Col1a1-GFP, respectively (n=2–3/group); liver fibrosis was determined by Sirius Red staining (n=3/group). b, myofibroblasts were visualized by αSMA IHC and liver fibrosis by Sirius Red staining in paired non-tumour and tumour sections from human HCC (n=45, displayed are HCCs arising in fibrotic livers) and from human ICC (n=4–5). c, proliferation determined by Ki67 IHC in non-tumour tissue from Yapfl/fl and YapΔHSC littermates or DTRpos and DTRneg mice in the DEN+CCl4 HCC model. d, analysis of cell-cell interactions by CellPhoneDB in scRNA-seq data from 8xCCl4-injured liver (n=3) revealed HSC as a major cell type interacting with hepatocytes. Data are shown as mean ± SEM, each data point (a,b,c) represents one individual; scale bars: 150 μm (a,b), 100 μm (c). Details of sample sizes, biological replicates and statistical tests are given in the Additional Information and Source Data.
Figure 3 |
Figure 3 |. Single cell RNA-seq analysis reveals subsets of HSC with differential expression of HGF and COL1A1 in the fibrotic liver.
a-b, UMAP visualization of myHSC and cyHSC signatures from scRNAseq of HSC from 19xCCl4 fibrotic mouse liver (n=1) (a) or snRNAseq of HSC from normal and cirrhotic human livers (n=4 each) (b). c, Violin plots of scRNA-seq data show cyHSC and myHSC subsets in untreated (Ctrl) or injured (CCl4) livers (n=1 each). d, Cell-cell interaction analysis of hepatocytes with other liver cells by CellPhoneDB from 8xCCl4-injured liver (n=3). e-f, UMAP and violin plot aligning Col1a1 and Hgf mRNA expression with myHSC and cyHSC in scRNA-seq from 19xCCl4 treated liver (e, n=1) or snRNA-seq of HSC from human normal and cirrhotic livers (n=4 each) (f). g, in situ analysis of Hgf mRNA by RNAscope with Col1a1-GFP and LratCre-induced TdTom fluorescence, shows separate populations of Col1a1-GFPhigh Hgflow myHSC, and Col1a1-GFPlow Hgfhigh cyHSC in normal (n=1) and 21xCCl4-treated livers (n=1) (g). AU=arbitrary units. Data are shown as mean ± SEM. In c and e, box plots represent the interquartile range (IQR), Q1, median and Q3, whiskers (Q1−1.5×IQR and Q3+1.5×IQR) and outlier data as individual dots. each data point represents one cell (a,b,e,f), or one area (g). Scale bars: 50 μm. Details of sample sizes, biological replicates and statistical tests are given in the Additional Information and Source Data.
Figure 4 |
Figure 4 |. Promotion of HCC by type I collagen and stiffness-associated accumulation of TAZ in hepatocytes.
a, significantly reduced HCC, shown by representative images, liver body ratio (LBR), tumour size and number, in Mx1Crepos Col1a1f/f (Col1a1del) compared to Col1a1f/f littermates (n=21 per group) in a profound fibrosis DEN+44xCCl4 model. b, Ki67 staining in non-tumour and tumour tissue (n=10–13 mice per group) shows a reduction of hepatocyte proliferation and tumour cell proliferation in Col1a1del compared to Col1a1f/f mice. c, reduction of liver stiffness, shown by rheometry (untreated: n=1; DEN+19xCCl4: n=4/group). d-e, pAKT, pERK, YAP, TAZ and GAPDH, detected by western blot (d), and TAZ IHC and nuclear translocation (e), in livers from the DEN+19xCCl4 profound fibrosis model (macroscopic tumors not yet present) from Col1a1del and Col1a1f/f mice (n=6/group for d, n=9/group for e). f-g, HCC development (f) and hepatocyte proliferation (g) in mice with hepatocyte-specific TAZ deletion (Wwtr1ΔHep, n=8–10) compared to Wwtr1fl/fl littermates (n=10) in the profound fibrosis DEN+44xCCl4 HCC model. Using the same samples, immunoblots in d were done using one gel for YAP/TAZ and GAPDH and a second gel for pAKT, AKT, pERK1/2 and ERK. Data are shown as mean ± SEM, each data point represents one individual. Scale bars: 50 μm. Details of sample sizes, biological replicates and statistical tests are given in the Additional Information and Source Data.
Figure 5 |
Figure 5 |. Promotion of hepatocarcinogenesis by DDR1.
a, Western blot for DDR1 in healthy, non-tumour and tumour liver from different mouse models of HCC. b, DDR1 IHC in healthy human control livers (n=6) and in non-tumour and tumour areas from patients (TMA containing n=64 each), as well as DDR1 mRNA expression in healthy controls (n=4), amd non-tumor and tumor areas from HCC patients (n=16). c-d, HCC development (c) and Ki67+ hepaotcytes (d) were assessed in mice with hepatocyte-specific DDR1 deletion (Ddr1fl/fl, n=12 and Ddr1ΔHep, n=9) in the DEN+CCl4 profound fibrosis HCC model. e, Western blot for pDDR1, pAKT, DDR1, AKT and b-actin in HepG2 cells, plated on plastic or ECM. f, western blot for pDDR1, pAKT, DDR1, AKT and b-actin in Huh7 cells plated on plastic, or ECM and treated with or without DDR1 inhibitor 7rh. Data are shown as mean ± SEM, each datapoint represents one individual (a-d) or one well (e-f). Scale bars: 500 μm (b), 50 μm (d). Details of sample sizes, biological replicates and statistical tests are given in the Additional Information and Source Data.
Figure 6 |
Figure 6 |. CyHSC-enriched HGF protects hepatocytes from death and reduces HCC development.
a, Hgf deletion in HSC promoted DEN+12xCCl4-induced HCC development (n=10/group). b, hepatocyte death assessed by TUNEL staining and ALT measurement as well as hepatocyte Ki67 IHC and mKi67 RNA in Hgf ΔHSC and to Hgf fl/fl mice in the 6xCCl4 model (n=4–8/group) and ALT measurement in mice on HF-CDAA-diet for 1 month (n=9/group). c, Propidium iodide staining (red) in cultured murine primary hepatocytes treated with ActD+Jo2-induced +/− murine recombinant HGF (50 ng/μL) for 6h (n=3–5 wells/group). d, Hgf mRNA expression in non-tumour (NT) and HCC tumour tissue (n=8 each) from mice after DEN+14xCCl4 treatment compared to untreated liver (Ctrl, n=5). e, HGF mRNA expression in normal liver (n=124), F0-F1 non-tumour (n=261), F2-F3 (n=115), F4 (n=182), dyplastic macronodules (DMN, n=31) and HCC (n=687) from patients. f, survival of HCC patients with low HGF (n=280) or high HGF (n=280) expression. Data are shown as mean ± SEM, box plots represent interquartile range (IQR), Q1, median and Q3, each data point represents one individual. Scale bars 100 μm. Details of sample sizes, biological replicates and statistical tests are given in the Additional Information and Source Data.

References

    1. Villanueva A Hepatocellular Carcinoma. N Engl J Med 380, 1450–1462, doi: 10.1056/NEJMra1713263 (2019). - DOI - PubMed
    1. Affo S, Yu LX & Schwabe RF The Role of Cancer-Associated Fibroblasts and Fibrosis in Liver Cancer. Annu Rev Pathol 12, 153–186, doi: 10.1146/annurev-pathol-052016-100322 (2017). - DOI - PMC - PubMed
    1. Mederacke I et al. Fate tracing reveals hepatic stellate cells as dominant contributors to liver fibrosis independent of its aetiology. Nat Commun 4, 2823, doi: 10.1038/ncomms3823 (2013). - DOI - PMC - PubMed
    1. Ryerson AB et al. Annual Report to the Nation on the Status of Cancer, 1975–2012, featuring the increasing incidence of liver cancer. Cancer 122, 1312–1337, doi: 10.1002/cncr.29936 (2016). - DOI - PMC - PubMed
    1. Jemal A et al. Annual Report to the Nation on the Status of Cancer, 1975–2014, Featuring Survival. J Natl Cancer Inst 109, doi: 10.1093/jnci/djx030 (2017). - DOI - PMC - PubMed

References (Methods)

    1. Nault JC et al. Clinical Impact of Genomic Diversity From Early to Advanced Hepatocellular Carcinoma. Hepatology 71, 164–182, doi: 10.1002/hep.30811 (2020). - DOI - PubMed
    1. Krempen K et al. Far upstream regulatory elements enhance position-independent and uterus-specific expression of the murine alpha1(I) collagen promoter in transgenic mice. Gene Expr 8, 151–163 (1999). - PMC - PubMed
    1. Mangale VS et al. Lhx2 selector activity specifies cortical identity and suppresses hippocampal organizer fate. Science 319, 304–309, doi: 10.1126/science.1151695 (2008). - DOI - PMC - PubMed
    1. Geisler F, Algul H, Paxian S & Schmid RM Genetic inactivation of RelA/p65 sensitizes adult mouse hepatocytes to TNF-induced apoptosis in vivo and in vitro. Gastroenterology 132, 2489–2503, doi: 10.1053/j.gastro.2007.03.033 (2007). - DOI - PubMed
    1. Buchtler S et al. Cellular Origin and Functional Relevance of Collagen I Production in the Kidney. J Am Soc Nephrol 29, 1859–1873, doi: 10.1681/ASN.2018020138 (2018). - DOI - PMC - PubMed