. 2023 Mar;30(3):673-686.
doi: 10.1038/s41418-022-01071-3. Epub 2022 Oct 5.

HSP90β promotes osteoclastogenesis by dual-activation of cholesterol synthesis and NF-κB signaling

Affiliations

HSP90β promotes osteoclastogenesis by dual-activation of cholesterol synthesis and NF-κB signaling

Hui-Min Cheng et al. Cell Death Differ. 2023 Mar.

Abstract

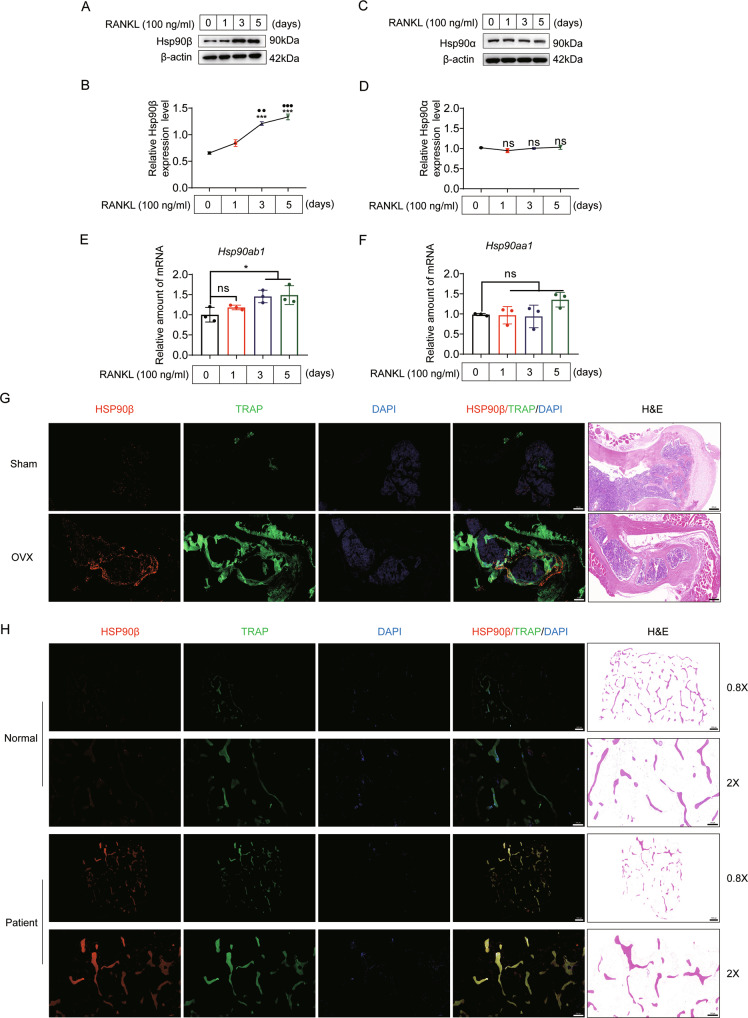
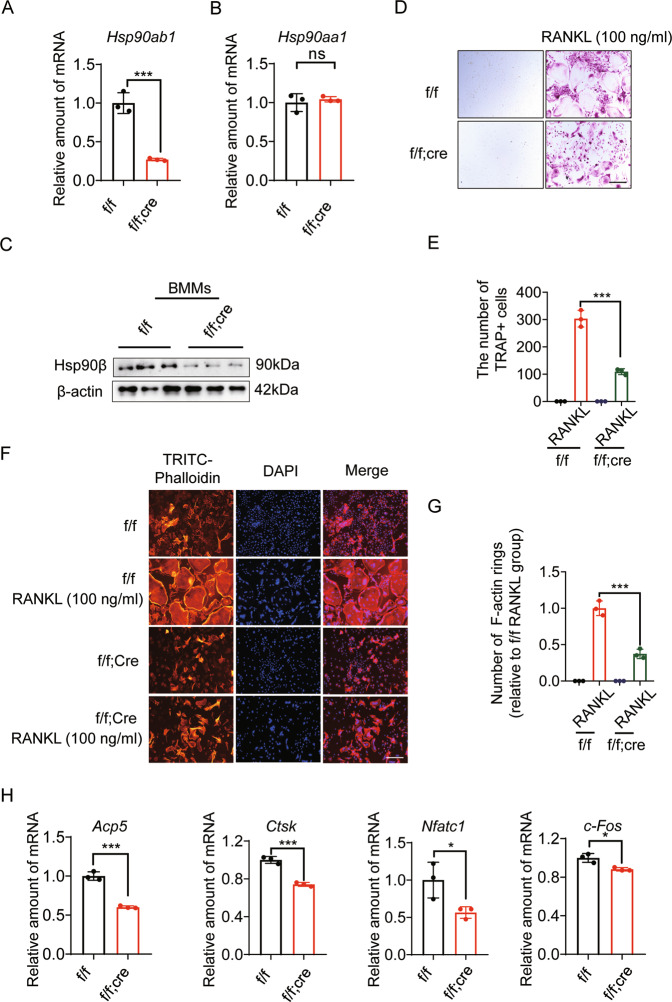
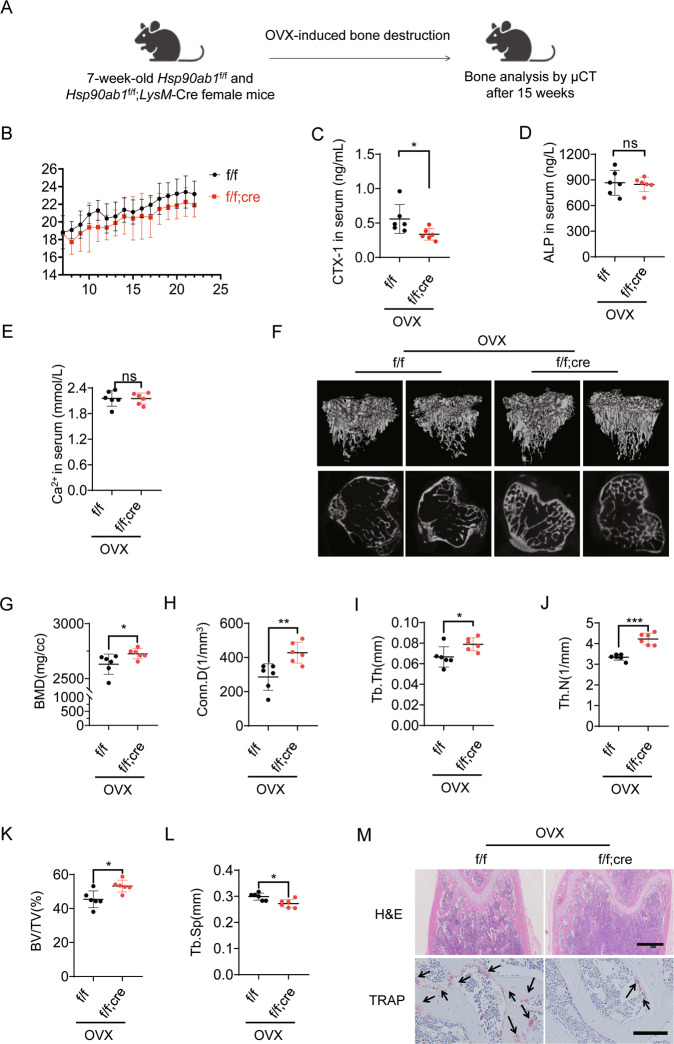
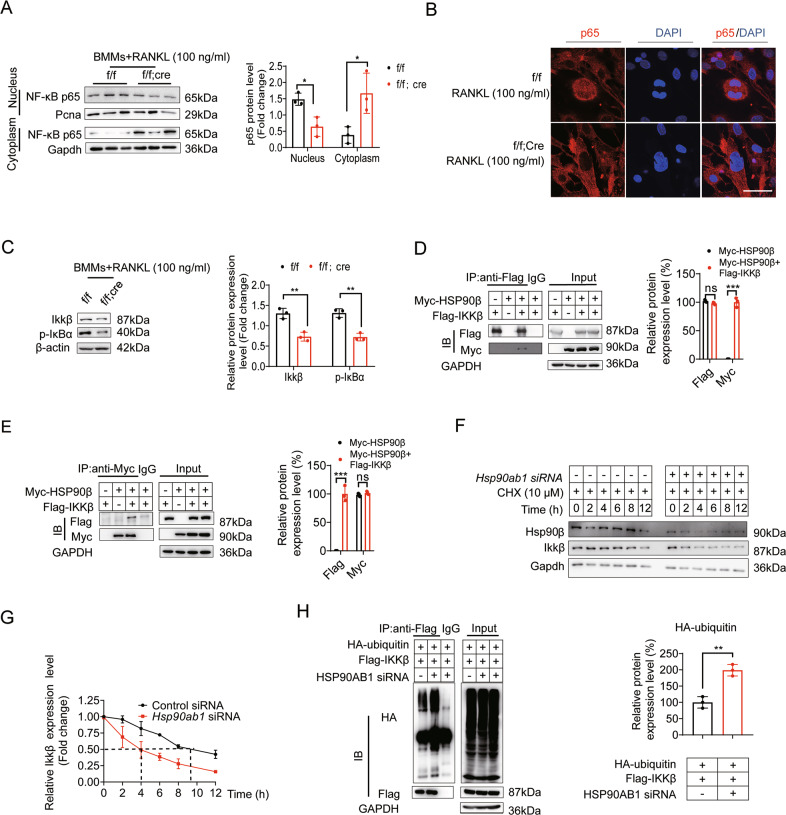
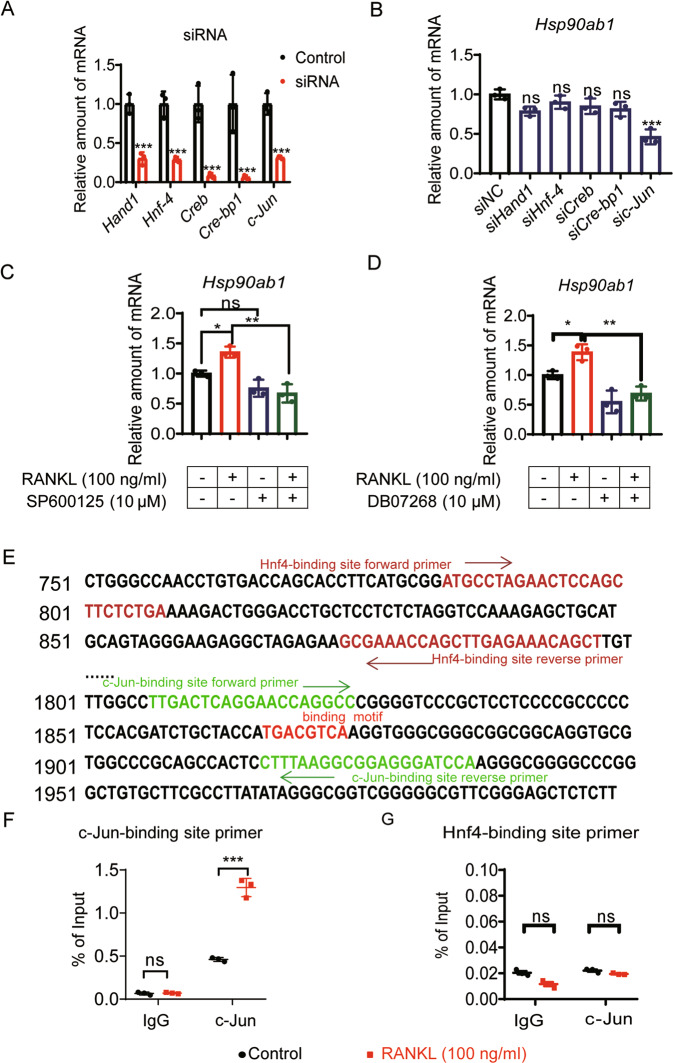
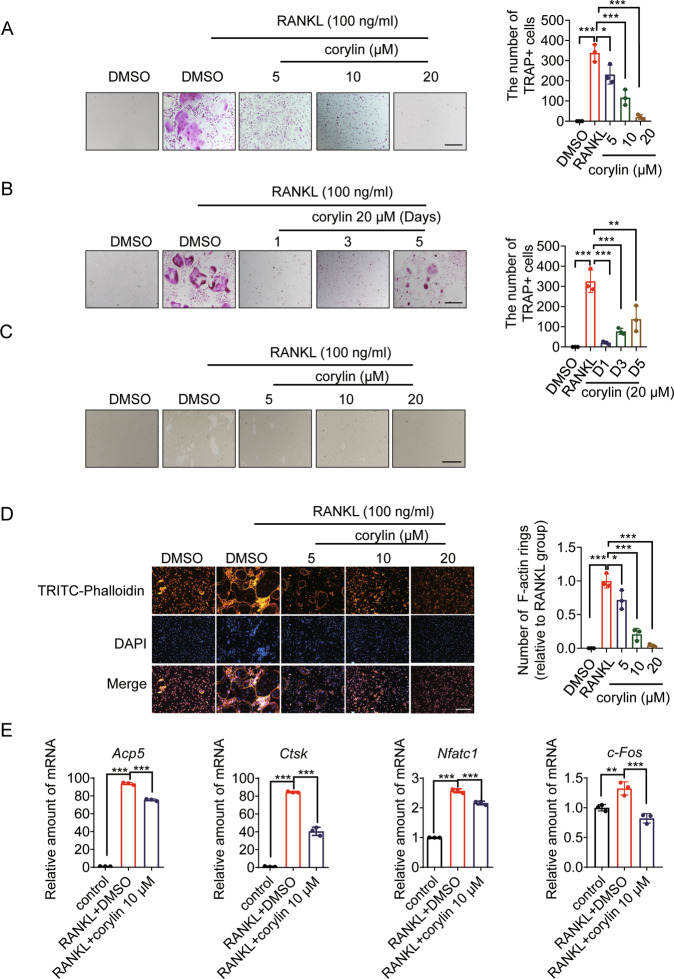
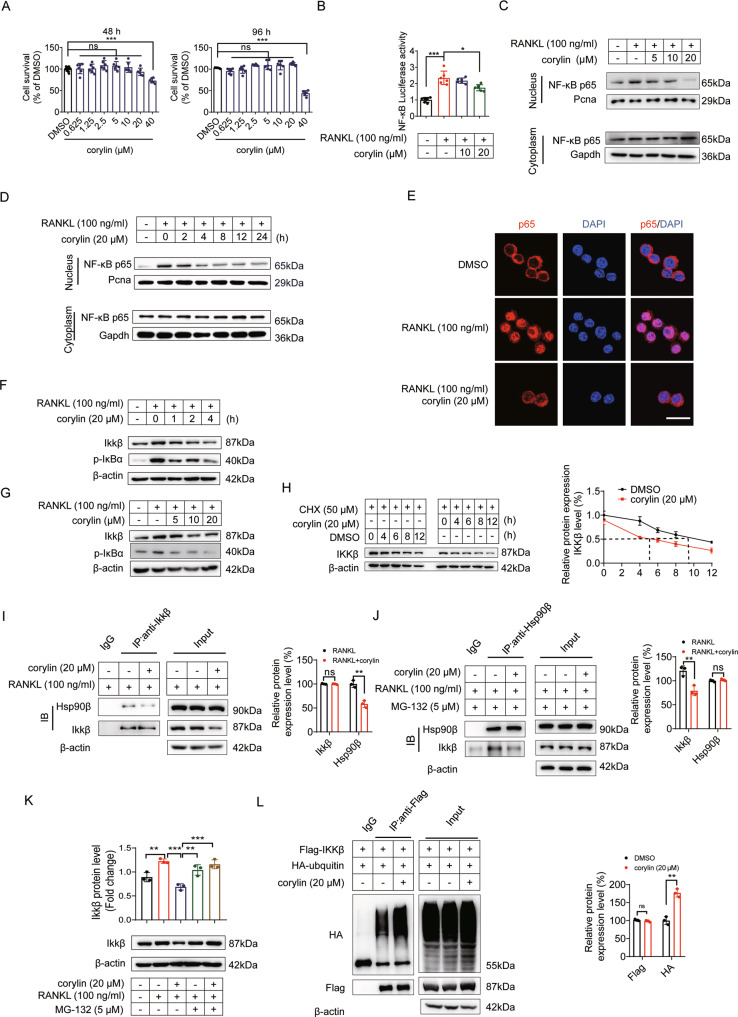
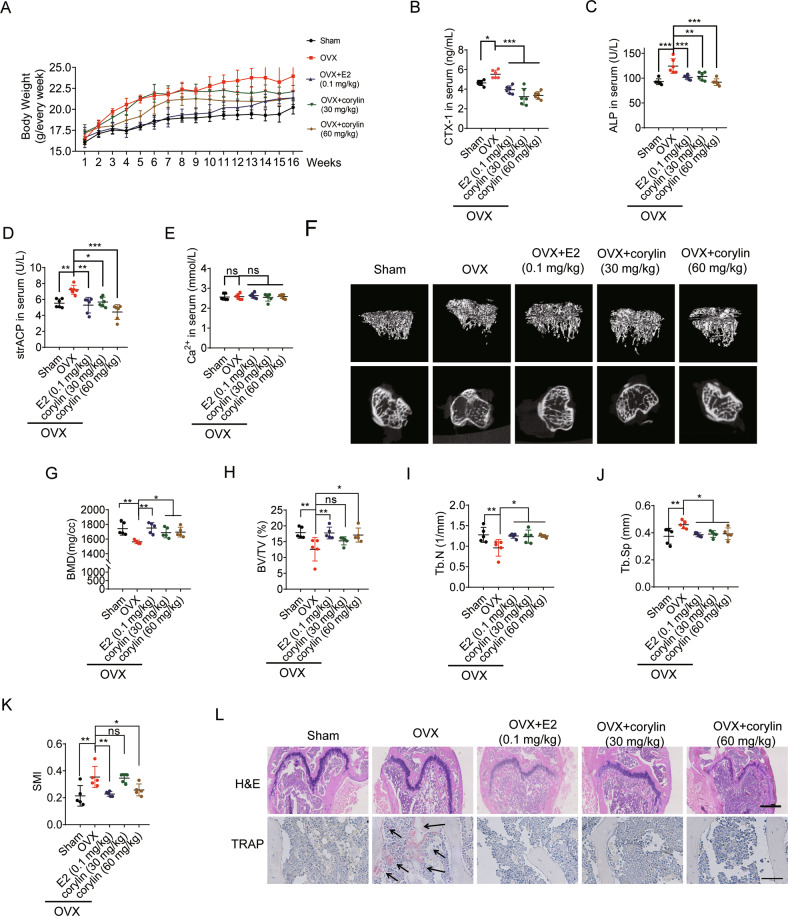
Heat shock protein 90β (Hsp90β, encoded by Hsp90ab1 gene) is the most abundant proteins in the cells and contributes to variety of biological processes including metabolism, cell growth and neural functions. However, genetic evidences showing Hsp90β in vivo functions using tissue specific knockout mice are still lacking. Here, we showed that Hsp90β exerted paralogue-specific role in osteoclastogenesis. Using myeloid-specific Hsp90ab1 knockout mice, we provided the first genetic evidence showing the in vivo function of Hsp90β. Hsp90β binds to Ikkβ and reduces its ubiquitylation and proteasomal degradation, thus leading to activated NF-κB signaling. Meanwhile, Hsp90β increases cholesterol biosynthesis by activating Srebp2. Both pathways promote osteoclastogenic genes expression. Genetic deletion of Hsp90ab1 in osteoclast or pharmacological inhibition of Hsp90β alleviates bone loss in ovariectomy-induced mice. Therefore, Hsp90β is a promising druggable target for the treatment of osteoporosis.


Conflict of interest statement

The authors declare no competing interests.

Figures

Fig. 1
Fig. 1. Hsp90β is upregulated during osteoclastogenesis.
A, B Protein expression of Hsp90β in BMMs in the presence of 100 ng/ml RANKL and 30 ng/ml M-CSF (*compared with day 0; ● compared with day 1). C, D Protein expression of Hsp90α in BMMs in the presence of 100 ng/ml RANKL and 30 ng/ml M-CSF. E, F The mRNA level of Hsp90ab1 and Hsp90aa1 during osteoclastogenesis. Bars represent means ± SD. *p < 0.05, **p < 0.01, ***p < 0.001. Each experiment was performed at least three times. G TRAP (green) and Hsp90β (red) immunofluorescence staining of femora sections from Sham and OVX mice. Scale bar, 200 μm. H Representative confocal images of TRAP/HSP90β immunofluorescence staining in the tibia of normal and osteoporotic patients (n = 2). Scale bar, 1000 μm and 500 μm, respectively.
Fig. 2
Fig. 2. Osteoclast Hsp90ab1 deletion reduces osteoclastogenesis.
A, B Relative mRNA expression of Hsp90ab1 and Hsp90aa1 in BMMs from Hsp90ab1f/f; LysM-Cre (f/f; Cre) mice or Hsp90ab1f/f (f/f) littermates. C Protein level of Hsp90β in BMMs. D TRAP staining of BMMs treated with 100 ng/ml RANKL and 30 ng/ml M-CSF for 7 days. Scale bars, 100 μm. E Quantification of TRAP-positive multinuclear cells. F BMMs were fixed and stained for F-actin with TRITC-phalloidin. Scale bars, 100 μm. G Number of osteoclasts with actin ring structures. H qRT-PCR was used to quantify relative mRNA expression levels of indicated genes. Bars represent means ± SD. *p < 0.05, **p < 0.01, ***p < 0.001. Each experiment was performed at least three times.
Fig. 3
Fig. 3. Hsp90ab1 deletion improves ovariectomy-induced bone loss by inhibiting osteoclast activity.
A Schematic for ovariectomy-induced bone loss mice model. B Body weight after OVX was recorded for 15 weeks. CE Serum CTX-1, ALP and calcium concentration in myeloid Hsp90ab1 knockout mice (n = 6). F Representative reconstructed 3D μCT images of proximal tibia in myeloid Hsp90ab1 knockout mice (n = 6). GL Quantification of BMD, Conn.D, Tb.Th, Tb.N, BV/TV and Tb.Sp from μCT images. M H&E and TRAP staining of the femora from OVX-mice (black arrows, TRAP-positive cells). Scale bars, 500 μm and 100 μm. Bars represent means ± S.D. *p < 0.05, **p < 0.01, ***p < 0.001.
Fig. 4
Fig. 4. Osteoclast Hsp90ab1 deletion attenuates NF-κB signaling.
A BMMs from Hsp90ab1f/f; LysM-Cre (f/f; Cre) mice and Hsp90ab1f/f (f/f) littermates were incubated with 100 ng/ml RANKL and 30 ng/ml M-CSF, p65 expression in the nucleus and cytoplasm was analyzed by western blot. B Nuclear translocation of p65 was visualized using immunofluorescence staining. Scale bars: 100 μm. C Protein expression of Ikkβ and p-IκBα in BMMs treated with 100 ng/ml RANKL and 30 ng/ml M-CSF. D, E 293 T cells were transfected with Myc-HSP90β, Flag-IKKβ. Flag immunoprecipitates or Myc immunoprecipitates were further analyzed by immunoblotting with corresponding antibodies. F BMMs were transfected with siRNA targeting Hsp90ab1 for 48 h, afterwards, the cells were supplemented with 10 µM cycloheximide following the indicated time. Ikkβ was detected by western blot. G Quantification of Ikkβ protein levels in panel F. H 293 T cells were transfected with Flag-IKKβ and HA-ubiquitin plasmids for 48 h, and the cells were supplemented with control siRNA or siRNA targeting HSP90AB1 for 48 h, the cells were lysed and proteins were detected by WB (left), quantification of indicated protein levels (right). Bars represent means ± SD. *p < 0.05, **p < 0.01, ***p < 0.001. Each experiment was performed at least three times.
Fig. 5
Fig. 5. Pathological up-regulation of Hsp90ab1 is transcriptionally regulated by c-Jun.
A BMMs were transfected with siRNA targeting potential Hsp90ab1 transcription factors for 48 h. qRT-PCR was used to assess the knockdown efficiency of indicated genes. B Hsp90ab1 expression was analyzed by qRT-PCR after transcription factors were knocked down. C, D BMMs were treated with JNK inhibitor SP600125 or DB07268, and the mRNA level of Hsp90ab1 was analyzed by qRT-PCR. E Putative c-Jun and Hnf4 binding sites, ChIP primers in the Hsp90ab1 promoter region. F In the presence/absence of RANKL, the binding of c-Jun to the Hsp90ab1 promoter region was analyzed by ChIP analysis in RAW264.7 cells. G In the presence/absence of RANKL, the binding of Hnf4 to the Hsp90ab1 promoter region was analyzed by ChIP analysis in RAW264.7 cells. Bars represent means ± SD. *p < 0.05, **p < 0.01, ***p < 0.001. Each experiment was performed at least three times.
Fig. 6
Fig. 6. Corylin inhibits RANKL-induced osteoclastogenesis and bone resorption in vitro.
A Representative TRAP-positive osteoclasts treated with indicated concentrations of corylin followed by stimulation with 100 ng/ml RANKL and 30 ng/ml M-CSF (left). Scale bars, 100 μm. Quantification of TRAP-positive multinuclear cells (right). B BMMs were treated with 20 μΜ corylin for the indicated days during osteoclastogenesis (left). Scale bars: 100 μm. Quantification of TRAP-positive multinuclear cells (right). C Representative images showing resorption pits in BMMs grown on OsteoAssay plates for 7 days. Scale bars: 100 μm. D BMMs were incubated with or without 100 ng/ml RANKL and 30 ng/ml M-CSF, followed by treatment with indicated concentration of corylin. Cells were fixed and stained for F-actin (left). Scale bars, 100 μm. Osteoclasts having actin rings structures were counted (right). E qRT-PCR was used to assess relative mRNA expression levels of indicated genes. Bars represent means ± SD. *p < 0.05, **p < 0.01, ***p < 0.001. Each experiment was performed at least three times.
Fig. 7
Fig. 7. Corylin inhibits NF-κB activity.
A Effects of corylin on RAW264.7 cells viability at 48 and 96 h. B The NF-κB luciferase reporter gene assay was performed in the presence of corylin at indicated concentrations. C RAW264.7 cells were incubated with or without 100 ng/ml RANKL, followed by treatment with indicated concentration of corylin for 8 h, relative protein expression of p65 was detected in the nucleus and cytoplasm fractions by western blot. D RAW264.7 cells were treated with 20 µM corylin for indicated time period, relative protein expression of p65 was detected in the nucleus and cytoplasm fractions. E Nuclear translocation of p65 was visualized using immunofluorescence staining. Scale bars: 100 μm. F Expression levels of the indicated proteins in RAW264.7 cells treated with 20 μM corylin for indicated time period. G Expression levels of the indicated proteins in RAW264.7 cells treated with indicated concentration of corylin for 8 h. H 293 T cells were incubated with 50 µM cycloheximide, followed by the treatment of 20 µM corylin for the indicated time period. IKKβ amount was detected by western blot (left). Quantification of IKKβ protein levels (right). I RAW264.7 cells were incubated with 100 ng/ml RANKL, followed by the treatment of 20 µM corylin for 8 h. The cells lysates were immunoprecipitated with Ikkβ and detected by anti-Hsp90β antibody. J RAW264.7 cells were incubated with 5 µM MG-132, followed by the treatment of 100 ng/ml RANKL and 20 µM corylin for 8 h. The cells lysates were immunoprecipitated with Hsp90β and detected by anti-Ikkβ antibody. K RAW264.7 cells were incubated with 5 µM MG-132, followed by treatment with 20 µM corylin for 8 h, expression of Ikkβ was detected. L 293 T cells were transfected with Flag-IKKβ and HA-ubiquitin overexpression plasmids for 48 h, and the cells were supplemented with 20 µM corylin for 48 h, the cells lysates were immunoprecipitated with Flag and detected by anti-HA antibody to show the ubiquitylation of IKKβ. Bars represent means ± SD. *p < 0.05, **p < 0.01, ***p < 0.001. Each experiment was performed at least three times.
Fig. 8
Fig. 8. Corylin improves ovariectomy-induced bone loss.
The OVX mice were divided into four groups (n = 6 in each group). The mice were treated with E2 (0.1 mg/kg) or corylin (30, 60 mg/kg) for 16 weeks. A Body weight after OVX was recorded for 16 weeks. BE Serum CTX-1, ALP, strACP and calcium concentration in five groups of mice (n = 6). F Representative reconstructed 3D μCT images of proximal tibia of five group mice. G–K Quantification of BMD, BV/TV, Tb.N, Tb.Sp, SMI from μCT images of five group mice (n = 5). L H&E and TRAP staining of the femora from five group mice (black arrows, TRAP-positive cells). Scale bars, 500 μm and 100 μm. Bars represent means ± SD. *p < 0.05, **p < 0.01, ***p < 0.001.

References

    1. Soysa NS, Alles N. Osteoclast function and bone-resorbing activity: An overview. Biochem Bioph Res Co. 2016;476:115–20. doi: 10.1016/j.bbrc.2016.05.019. - DOI - PubMed
    1. Starling S. New anti-osteoporosis drug target identified. Nat Rev Endocrinol. 2021;17:5–5. - PubMed
    1. Wei HJ, Xu YH, Wang YB, Xu LT, Mo CY, Li LZ, et al. Identification of fibroblast activation protein as an osteogenic suppressor and anti-osteoporosis drug target. Cell Rep. 2020;33:108252. - PubMed
    1. Tu KN, Lie JD, Wan CKV, Cameron M, Austel AG, Nguyen JK, et al. Osteoporosis: a review of treatment options. P T. 2018;43:92–104. - PMC - PubMed
    1. Ikebuchi Y, Aoki S, Honma M, Hayashi M, Sugamori Y, Khan M, et al. Coupling of bone resorption and formation by RANKL reverse signalling. Nature. 2018;561:195–200. doi: 10.1038/s41586-018-0482-7. - DOI - PubMed

Publication types