. 2022 Oct 5;10(1):145.
doi: 10.1186/s40478-022-01448-y.

Müller cell degeneration and microglial dysfunction in the Alzheimer's retina

Affiliations

Müller cell degeneration and microglial dysfunction in the Alzheimer's retina

Qinyuan Alis Xu et al. Acta Neuropathol Commun. .

Abstract

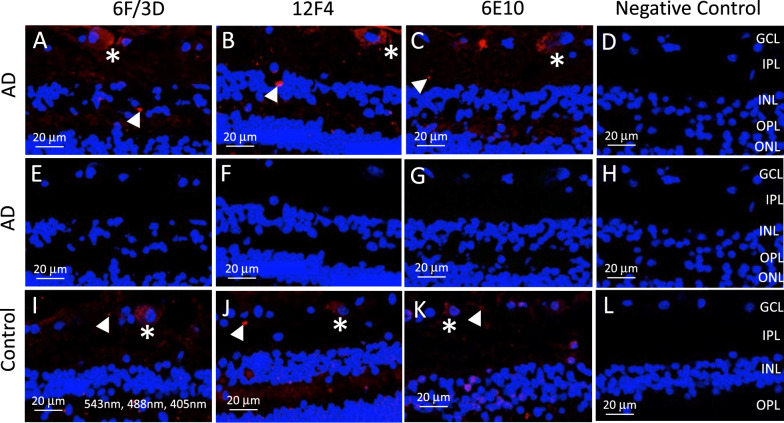
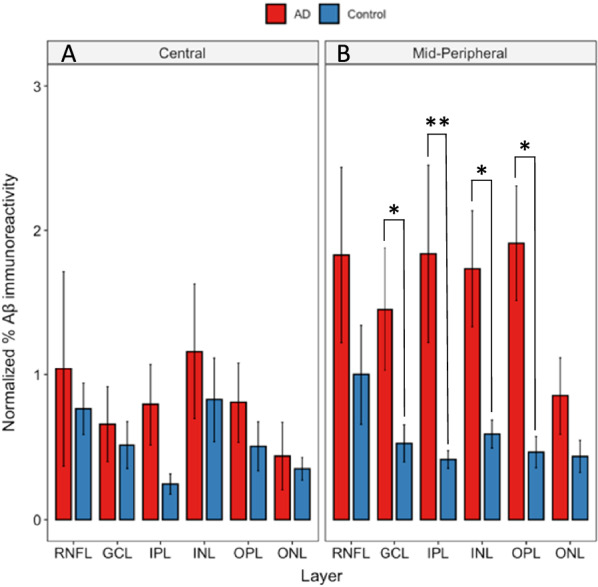
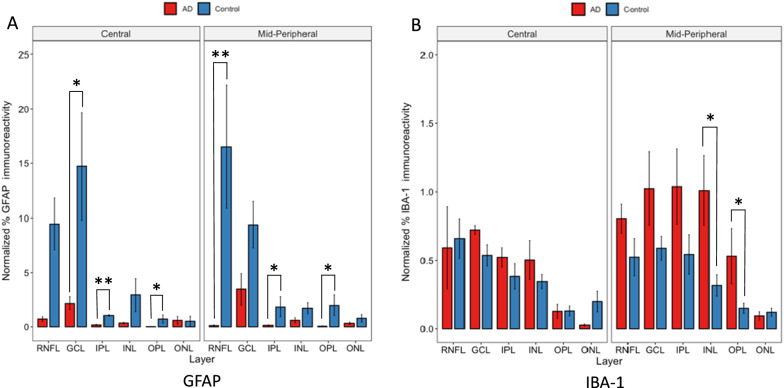
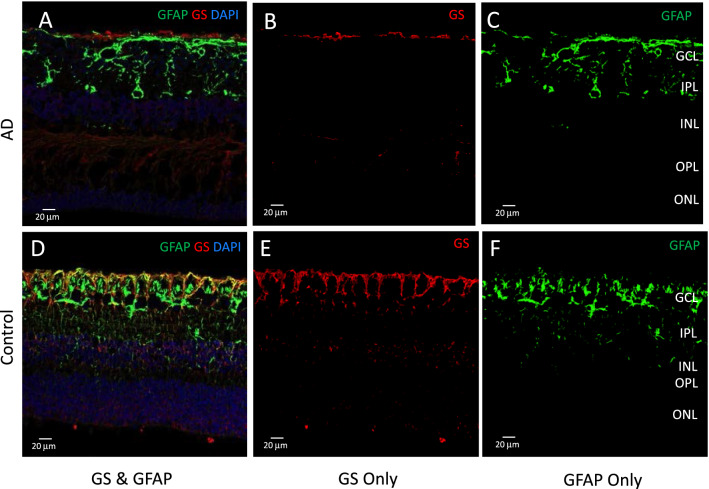
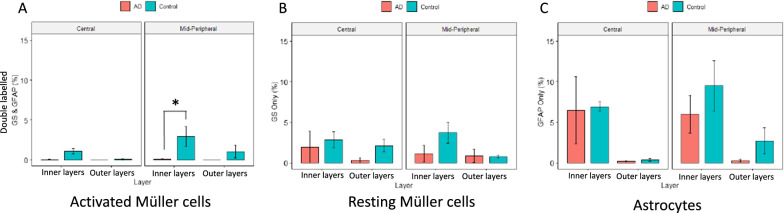
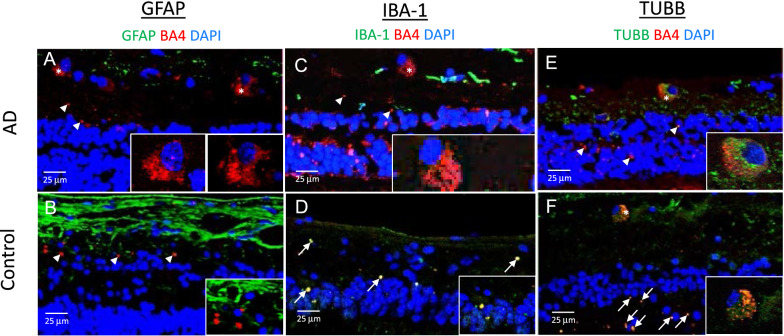
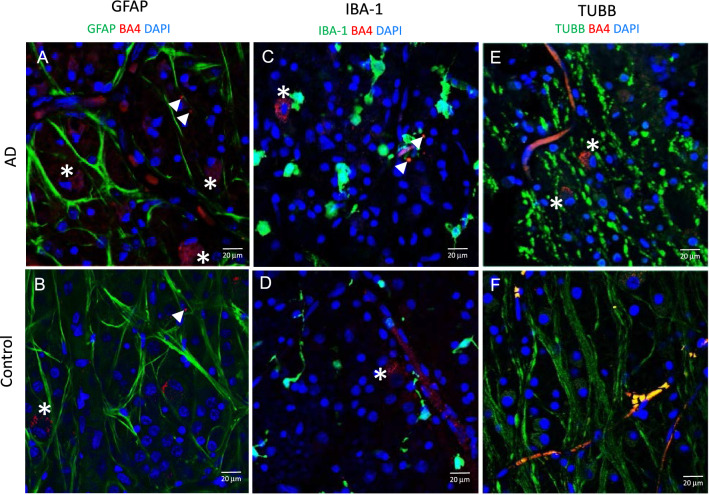
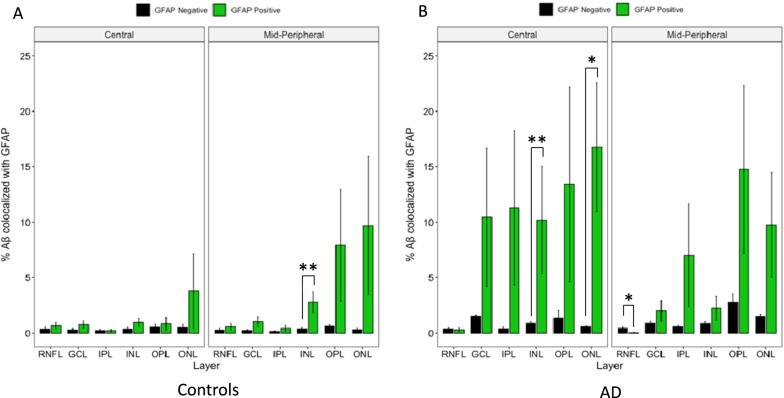
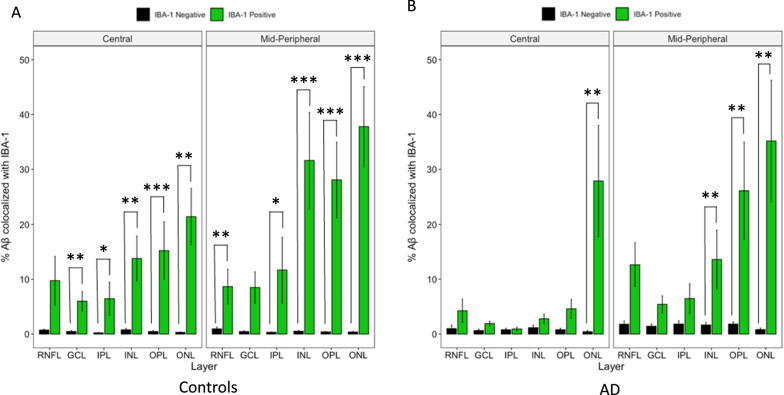
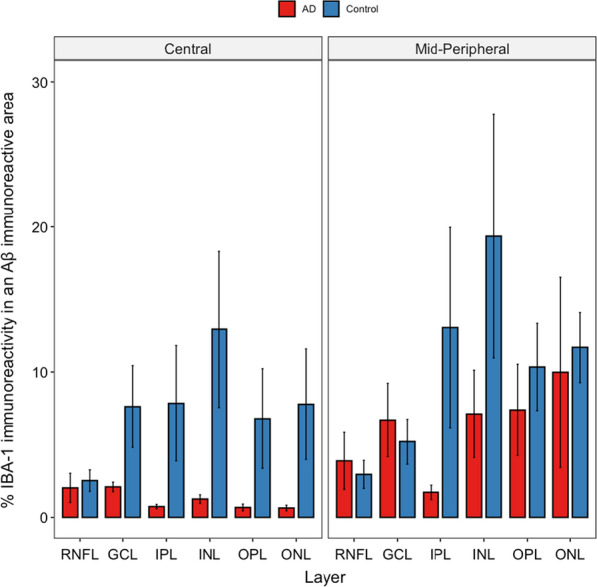
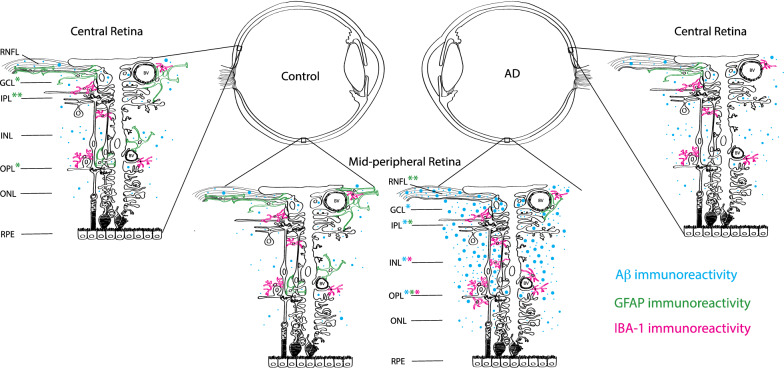
Amyloid beta (Aβ) deposits in the retina of the Alzheimer's disease (AD) eye may provide a useful diagnostic biomarker for AD. This study focused on the relationship of Aβ with macroglia and microglia, as these glial cells are hypothesized to play important roles in homeostasis and clearance of Aβ in the AD retina. Significantly higher Aβ load was found in AD compared to controls, and specifically in the mid-peripheral region. AD retina showed significantly less immunoreactivity against glial fibrillary acidic protein (GFAP) and glutamine synthetase (GS) compared to control eyes. Immunoreactivity against ionized calcium binding adapter molecule-1 (IBA-1), a microglial marker, demonstrated a higher level of microgliosis in AD compared to control retina. Within AD retina, more IBA-1 immunoreactivity was present in the mid-peripheral retina, which contained more Aβ than the central AD retina. GFAP co-localized rarely with Aβ, while IBA-1 co-localized with Aβ in more layers of control than AD donor retina. These results suggest that dysfunction of the Müller and microglial cells may be key features of the AD retina.

Keywords: Alzheimer’s disease; Amyloid-β; Biomarker; Macroglia; Microglia; Retina.


Conflict of interest statement

The authors declare that the research was conducted in the absence of any commercial or financial relationships that could be construed as a potential conflict of interest.

Figures

Fig. 1
Fig. 1
Post-mortem human retina preparation. A Paraffin embedded sagittal cross-sections. (5 μm in thickness). The retina was divided into 4 sectors. Central retina, C1 and C2, were sectors adjacent to the optic nerve head, around 5 mm away measured circumferentially. Sectors P1 and P2 were mid-peripheral retinal zones, around 10 mm away from the optic nerve head measured circumferentially. B Preparation of free-floating retinal punches and wholemount (4 mm in diameter). Schematic not to scale
Fig. 2
Fig. 2
Comparisons of immunofluorescence using three Aβ antibodies. Cross sections of Alzheimer’s disease (AD) retina were processed with three monoclonal mouse antibodies against Aβ: A, E Clone 6F/3D, which labels β-amyloid containing the N-terminal epitope (Agilent, CA, USA); B, F 12F4, which labels the C-terminus of β-amyloid and is specific for the isoform ending at the 42nd amino acid (Biolegend, CA, USA); and C, G 6E10, which recognizes the epitope that lies within the amino acids 3–8 of β-amyloid as well as the precursor forms (Biolegend, CA, USA). Note that immunolabeling pattern is consistent with all three antibodies and identifies what is likely intracellular labelling of retinal ganglion cells (asterisks) and extracellular deposits (arrowheads). Negative control sections in which the primary antibody was omitted resulted in no immunofluorescence (D). All sections were also imaged under 488 nm for autofluorescence that may be associated with melanopsin containing retinal ganglion cells. Note that no green or yellow/orange signals were observed in AD in which both 543 nm and 488 nm were used, and confirmed in EH in which the same section was imaged under 488 nm only. I-L) Cross sections of control retina were also processed for all three monoclonal mouse antibodies against Aβ and demonstrated both what is likely intracellular labelling of retinal ganglion cells (asterisks) and extracellular deposits (arrowheads). DAPI was used to label nuclei throughout all panels and imaged under 405 nm
Fig. 3
Fig. 3
Layer-wise retina Aβ load in Alzheimer’s disease (AD) retina compared to controls. Red bars represent AD donors (N = 5). Blue bars represent age-matched controls (N = 7). BA4 labelled post-mortem human retina cross-sections were imaged at central and mid-peripheral locations in relation to optic nerve head. Normalized area percentage of BA4 labelled Aβ was calculated in each retinal layer and plotted against the particular layer. Aβ was significantly higher in the AD donors in the mid-peripheral GCL (p < 0.05), IPL (p < 0.01), INL (p < 0.05), and OPL (p < 0.05). However, in central retina there was no significant differences between AD and control retina. * represent p < 0.05. ** represent p < 0.01. Error bars = Standard Error
Fig. 4
Fig. 4
Layer-wise GFAP and IBA-1 in Alzheimer’s disease (AD) retina compared to controls. Red bars represent AD donors (N = 5). Blue bars represent age-matched controls (N = 7). A GFAP labelled post-mortem human retina cross-sections are imaged at central and mid-peripheral locations in relation to optic nerve head. Normalized area percentage of GFAP positive pixels is calculated in each retinal layer and plotted against the particular layer. GFAP immunoreactivity, is lower in AD donors, as seen by the red bars generally lower than the blue bars. This is significant in the central GCL (p < 0.05), IPL (p < 0.01), and OPL (p < 0.05) and mid-peripheral RNFL (p < 0.01), IPL (p < 0.05), and OPL (p < 0.05). B IBA-1 labelled post-mortem human retina cross-sections are imaged at central and mid-peripheral locations in relation to optic nerve head. Normalized area percentage of IBA-1 positive pixels is calculated in each retinal layer and plotted against the particular layer. IBA-1 immunoreactivity is higher in AD donors, as seen by the red bars generally higher than the blue bars. This is significant in mid-peripheral INL and OPL (p < 0.05). Note that the ranges of the y-axes of the two panels are different as there was generally more GFAP immunoreactivity than IBA-1 throughout our study * represent p < 0.05. **represent p < 0.01. Error bars = Standard Error
Fig. 5
Fig. 5
Thresholding for GS and GFAP immunostaining. Glutamine synthetase (GS) immunolabelling (red) marks both resting and activated Müller cells. Glial filamentary acidic protein (GFAP) immunolabelling (green) is present in activated Müller cells and astrocytes. Representative images of cross-sections stained with GS and GFAP. A, D Pixels positive for both GS and GFAP (yellow) activated Müller cells. B, E Pixels positive for GS Only represent resting Müller cells. C, F Pixels positive for GFAP Only represent astrocytes
Fig. 6
Fig. 6
Quantitative analysis of GS and/or GFAP staining in AD compared to control eyes. Retinal layers were grouped into inner layers (RNFL, GCL, IPL) and outer layers (INL, OPL, ONL). Red bars represent AD eyes, green bars represent control eyes. A Percentage of pixels double labelled by both GS & GFAP in inner and outer retina is shown. Activated Müller cells, labelled with both GS & GFAP, shows lower levels of immunoreactivity in AD (red bars) compared to control eyes (green bars). This was significant in the inner layers of mid-peripheral retina. B Percentage of pixels labelled with GS only in inner and outer retina is shown. C Percentage of pixels labelled with GFAP only in inner and outer retina is shown. * represent p < 0.05. Error bars = Standard Error
Fig. 7
Fig. 7
Representative immunofluorescence images of retinal cross-sections. A, C, E Post-mortem human retina samples were processed from AD donors (Mean age = 78.6) (N = 5). BDF Post-mortem human retina samples were processed from controls (Mean age = 76.8) (N = 6). Tissues underwent immunohistochemistry staining for Aβ (red), nuclei (blue), and either GFAP for astrocytes/Müller cells (green) or IBA-1 for microglia (green) or TUBB3 for neuronal microtubules (green). Aβ immunofluorescence was evident within what is likely the retinal ganglion cells (asterisk) and the neuropil and extracellular spaces (arrowheads). Double labelling is seen (arrows). Stronger Aβ immunoreactivity (red) was observed intracellularly in retinal ganglion cells and in the neuropil of AD donors compared to controls. Scale bar = 25 µm
Fig. 8
Fig. 8
Representative immunofluorescence images of retinal punches. A, C, E Post-mortem human retina samples were processed from AD donors (Mean age = 75.3) (N = 3). B, D, F Post-mortem human retina samples were processed from controls (Mean age = 70.7) (N = 3). Tissues underwent immuno-histochemistry staining for Aβ (red), and either GFAP for astrocytes/Müller cells (green), IBA-1 for microglia (green) or TUBB3 for neuronal microtubules (green). Aβ (red) immunofluorescence was evident within what was likely the retinal ganglion cells (asterisk) and in the neuropil and extracellular spaces (arrows). Stronger Aβ immunoreactivity (red) was observed intracellularly in retinal ganglion cells and in the neuropil of AD donors compared to controls. Note abnormal nodular appearance of axonal profiles (green TUBB3) in AD (E). Scale bar = 20 µm. Error bars = Standard Error
Fig. 9
Fig. 9
Layer-wise cross-sectional colocalization profile of GFAP labelled astrocytes with Aβ. Left panel illustrate age-matched controls (N = 7). Right panel illustrate AD donors (N = 5). The primary antibody against GFAP was visualized using a FITC-labelled secondary antibody. The primary antibody against Aβ was visualized using a Cy3-labelled secondary antibody. Green bars represent the percentage of Aβ positive pixels among FITC (GFAP) -positive pixels. Black bars represent the percentage of Aβ positive pixels among FITC (GFAP) -negative pixels. Colocalization is defined by FITC-positive pixels having a significantly higher percentage of Aβ positivity than FITC-negative pixels. Aβ colocalization with GFAP is calculated in each retinal layer and plotted on the x-axis. One out of 12 geo-layers in controls (A) and 3 out of 12 geo-layers in AD donors (B) showed significant Aβ-GFAP colocalization. * represent p < 0.05. ** represent p < 0.01. Error bars = Standard Error
Fig. 10
Fig. 10
Layer-wise cross-sectional colocalization profile of IBA-1 labelled microglia with Aβ. Left panel illustrate age-matched controls (N = 7). Right panel illustrate AD donors (N = 5). The primary antibody IBA-1 was visualized using a FITC-labelled secondary antibody. The primary antibody against Aβ was visualized using a Cy3-labelled secondary antibody. Green bars represent the percentage of Aβ positive pixels among FITC (IBA-1) -positive pixels. Black bars represent the percentage of Aβ positive pixels among FITC (IBA-1) -negative pixels. Colocalization is defined by FITC (IBA-1) -positive pixels having a significantly higher percentage of Aβ positivity than FITC-negative pixels. Aβ colocalization with IBA-1 is calculated in each retinal layer and plotted on the x-axis. Ten out of 12 geo-layers in controls (A) and 4 out of 12 geo-layers in AD donors (B) showed significant Aβ-IBA-1 colocalization. * represent p < 0.05. **represent p < 0.01. *** represent p < 0.001. Error bars = Standard Error
Fig. 11
Fig. 11
Layer-wise cross-sectional colocalization profile of TUBB3 labelled neurons with Aβ. Left panel illustrate age-matched controls (N = 7). Right panel illustrate AD donors (N = 5). The primary antibody against TUBB3 was visualized using a FITC-labelled secondary antibody. The primary antibody against Aβ was visualized using a Cy3-labelled secondary antibody. Green bars represent the percentage of Aβ positive pixels among FITC (TUBB3) -positive pixels. Black bars represent the percentage of Aβ positive pixels among FITC (TUBB3) -negative pixels. Colocalization is defined by FITC (TUBB3) -positive pixels having a significantly higher percentage of Aβ positivity than FITC-negative pixels. Each bar-pair represent a geo-layer. Aβ colocalization with TUBB3 is calculated in each retinal layer and plotted on the X-axis. Seven out of 12 geo-layers in controls (A) and 12 out of 12 geo-layers in AD (B) showed significant Aβ-TUBB3 colocalization. *represent p < 0.05. **represent p  < 0.01. Error bars = Standard Error
Fig. 12
Fig. 12
Aβ co-localization with Microglia. Percent of IBA-1 immunoreactivity in a BA4 immunoreactive area was plotted against the retinal layers in central vs. mid-peripheral retina. Red bars represent AD donors (N = 5). Blue bars represent age-matched controls (N = 7). Although the average values of IBA-1 immunoreactivity in a BA4 immunoreactive area in the control eyes were larger than those in the AD eyes, the difference did not reach significance (alpha = 0.05), Error bars = Standard Error.
Fig. 13
Fig. 13
Summary schematic of layer-wise location of Aβ, GFAP, and IBA-1 immunostaining. Representative schematic demonstrates the qualitative and quantitative data from this study. Blue represents Aβ immunoreactivity. Green represents GFAP immunoreactivity. Pink represents IBA-1 immunoreactivity. AD retina is shown on the right, and control retina is shown on the left. The asterisks on the layer abbreviations represents the types of cells seen in this layer. RNFL Retinal nerve fiber layer. GCL Ganglion cell layer. IPL Inner plexiform layer. INL Inner nuclear layer. OPL Outer plexiform layer. ONL Outer nuclear layer. RPE Retinal pigment epithelium. *Represent p < 0.05. **Represent p < 0.01

Similar articles

Cited by

References

    1. Akiyama H, Barger S, Barnum S, Bradt B, Bauer J, Cole GM, Cooper NR, Eikelenboom P, Emmerling M, Fiebich BL. Inflammation and alzheimer’s disease. Neurobiol Aging. 2000;21:383–421. doi: 10.1016/S0197-4580(00)00124-X. - DOI - PMC - PubMed
    1. Alzheimer’s A (2015) 2015 Alzheimer's disease facts and figures. Alzheimer's & dementia. J Alzheimer's Association, 11:332 - PubMed
    1. Benzinger TL, Blazey T, Jack CR, Koeppe RA, Su Y, Xiong C, Raichle ME, Snyder AZ, Ances BM, Bateman RJ. Regional variability of imaging biomarkers in autosomal dominant alzheimer’s disease. Proc Natl Acad Sci. 2013;110:E4502–E4509. doi: 10.1073/pnas.1317918110. - DOI - PMC - PubMed
    1. Blanks JC, Schmidt SY, Torigoe Y, Porrello KV, Hinton DR, Blanks RH. Retinal pathology in alzheimer's disease. II. Regional neuron loss and glial changes in GCL. Neurobiol Aging. 1996;17:385–395. doi: 10.1016/0197-4580(96)00009-7. - DOI - PubMed
    1. Blanks JC, Torigoe Y, Hinton DR, Blanks RH. Retinal pathology in Alzheimer's disease. I. Ganglion cell loss in foveal/parafoveal retina. Neurobiol Aging. 1996;17:377–384. doi: 10.1016/0197-4580(96)00010-3. - DOI - PubMed

Publication types