

Stochastic dynamics and ribosome-RNAP interactions in transcription-translation coupling
- PMID: 36199250
- PMCID: PMC9822797
- DOI: 10.1016/j.bpj.2022.09.041
Stochastic dynamics and ribosome-RNAP interactions in transcription-translation coupling
Abstract
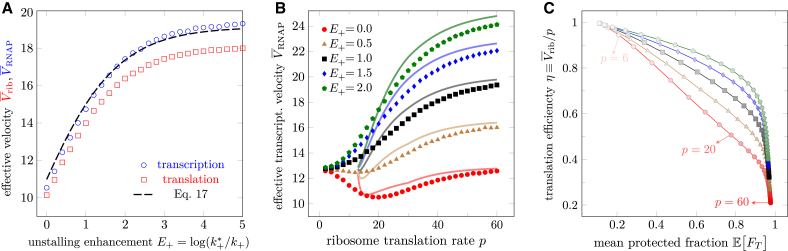
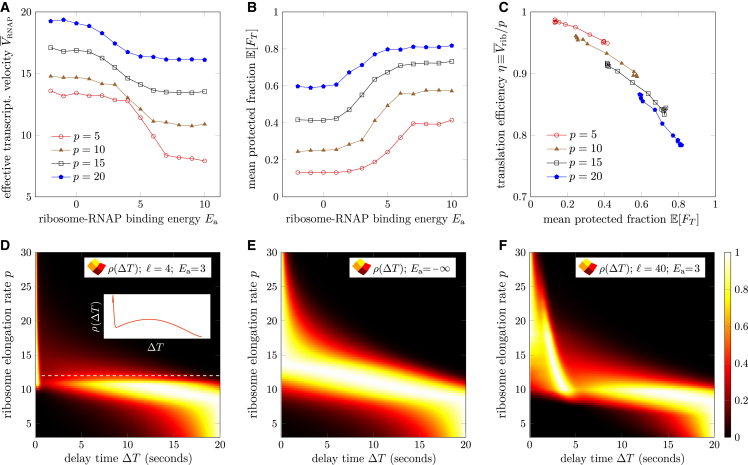
Under certain cellular conditions, transcription and mRNA translation in prokaryotes appear to be "coupled," in which the formation of mRNA transcript and production of its associated protein are temporally correlated. Such transcription-translation coupling (TTC) has been evoked as a mechanism that speeds up the overall process, provides protection against premature termination, and/or regulates the timing of transcript and protein formation. What molecular mechanisms underlie ribosome-RNAP coupling and how they can perform these functions have not been explicitly modeled. We develop and analyze a continuous-time stochastic model that incorporates ribosome and RNAP elongation rates, initiation and termination rates, RNAP pausing, and direct ribosome and RNAP interactions (exclusion and binding). Our model predicts how distributions of delay times depend on these molecular features of transcription and translation. We also propose additional measures for TTC: a direct ribosome-RNAP binding probability and the fraction of time the translation-transcription process is "protected" from attack by transcription-terminating proteins. These metrics quantify different aspects of TTC and differentially depend on parameters of known molecular processes. We use our metrics to reveal how and when our model can exhibit either acceleration or deceleration of transcription, as well as protection from termination. Our detailed mechanistic model provides a basis for designing new experimental assays that can better elucidate the mechanisms of TTC.
Copyright © 2022 Biophysical Society. Published by Elsevier Inc. All rights reserved.
Conflict of interest statement
Declaration of interests The authors declare no competing interests.
Figures


Comment in
-
Transcription-translation coupling: Traveling a road under construction.Biophys J. 2023 Jan 3;122(1):1-3. doi: 10.1016/j.bpj.2022.12.006. Epub 2022 Dec 6. Biophys J. 2023. PMID: 36525978 Free PMC article. No abstract available.
Similar articles
-
Measures of single- versus multiple-round translation argue against a mechanism to ensure coupling of transcription and translation.Proc Natl Acad Sci U S A. 2018 Oct 16;115(42):10774-10779. doi: 10.1073/pnas.1812940115. Epub 2018 Oct 1. Proc Natl Acad Sci U S A. 2018. PMID: 30275301 Free PMC article.
-
Structural basis of RfaH-mediated transcription-translation coupling.Nat Struct Mol Biol. 2024 Dec;31(12):1932-1941. doi: 10.1038/s41594-024-01372-w. Epub 2024 Aug 8. Nat Struct Mol Biol. 2024. PMID: 39117885 Free PMC article.
-
Tracking transcription-translation coupling in real time.Nature. 2025 Jan;637(8045):487-495. doi: 10.1038/s41586-024-08308-w. Epub 2024 Dec 4. Nature. 2025. PMID: 39633055 Free PMC article.
-
Methodology for the analysis of transcription and translation in transcription-coupled-to-translation systems in vitro.Methods. 2015 Sep 15;86:51-9. doi: 10.1016/j.ymeth.2015.05.029. Epub 2015 Jun 14. Methods. 2015. PMID: 26080048 Review.
-
Two Old Dogs, One New Trick: A Review of RNA Polymerase and Ribosome Interactions during Transcription-Translation Coupling.Int J Mol Sci. 2019 May 27;20(10):2595. doi: 10.3390/ijms20102595. Int J Mol Sci. 2019. PMID: 31137816 Free PMC article. Review.
Cited by
-
Protein translation can fluidize bacterial cytoplasm.PNAS Nexus. 2024 Nov 22;3(12):pgae532. doi: 10.1093/pnasnexus/pgae532. eCollection 2024 Dec. PNAS Nexus. 2024. PMID: 39660062 Free PMC article.
-
Transcription-translation coupling: Traveling a road under construction.Biophys J. 2023 Jan 3;122(1):1-3. doi: 10.1016/j.bpj.2022.12.006. Epub 2022 Dec 6. Biophys J. 2023. PMID: 36525978 Free PMC article. No abstract available.
-
Defining the networks that connect RNase III and RNase J-mediated regulation of primary and specialized metabolism in Streptomyces venezuelae.J Bacteriol. 2025 May 22;207(5):e0002425. doi: 10.1128/jb.00024-25. Epub 2025 Apr 14. J Bacteriol. 2025. PMID: 40227046 Free PMC article.
-
spotter: a single-nucleotide resolution stochastic simulation model of supercoiling-mediated transcription and translation in prokaryotes.Nucleic Acids Res. 2023 Sep 22;51(17):e92. doi: 10.1093/nar/gkad682. Nucleic Acids Res. 2023. PMID: 37602419 Free PMC article.
References
-
- Miller O.L., Hamkalo B.A., Thomas C.A. Visualization of bacterial genes in action. Science. 1970;169:392–395. - PubMed
-
- Sydow J.F., Cramer P. RNA polymerase fidelity and transcriptional proofreading. Curr. Opin. Struct. Biol. 2009;19:732–739. Catalysis and regulation/Proteins. - PubMed
-
- Knippa K., Peterson D.O. Fidelity of RNA polymerase II transcription: role of Rbp9 in error detection and proofreading. Biochemistry. 2013;52:7807–7817. - PubMed
-
- Sahoo M., Klumpp S. Backtracking dynamics of RNA polymerase: pausing and error correction. J. Phys. Condens. Matter. 2013;25:374104. - PubMed
