Distinctive Metabolism-Associated Gene Clusters That Are Also Prognostic in Intrahepatic Cholangiocarcinoma and Hepatocellular Carcinoma
- PMID: 36199423
- PMCID: PMC9527115
- DOI: 10.1155/2022/6595989
Distinctive Metabolism-Associated Gene Clusters That Are Also Prognostic in Intrahepatic Cholangiocarcinoma and Hepatocellular Carcinoma
Retraction in
-
Retracted: Distinctive Metabolism-Associated Gene Clusters That Are Also Prognostic in Intrahepatic Cholangiocarcinoma and Hepatocellular Carcinoma.Oxid Med Cell Longev. 2023 Aug 2;2023:9815947. doi: 10.1155/2023/9815947. eCollection 2023. Oxid Med Cell Longev. 2023. PMID: 37565164 Free PMC article.
Abstract
Objective: To offer new prognostic evaluations by exploring potentially distinctive genetic features of hepatocellular carcinoma (HCC) and intrahepatic cholangiocarcinoma (ICC).
Methods: There were 12 samples for gene expression profiling processes in this study. These included three HCC lesion samples and their matched adjacent nontumor liver tissues obtained from patients with HCC, as well as three ICC samples and their controls collected similarly. In addition to the expression matrix generated on our own, profiles of other cohorts from The Cancer Genome Atlas (TCGA) program and the Gene Expression Omnibus (GEO) were also employed in later bioinformatical analyses. Differential analyses, functional analyses, protein interaction network analyses, and gene set variation analyses were used to identify key genes. To establish the prognostic models, univariate/multivariate Cox analyses and subsequent stepwise regression were applied, with the Akaike information criterion evaluating the goodness of fitness.
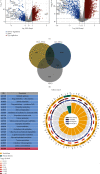
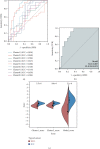
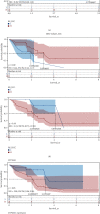
Results: The top three pathways enriched in HCC were all metabolism-related; they were fatty acid degradation, retinol metabolism, and arachidonic acid metabolism. In ICC, on the other hand, additional pathways related to fat digestion and absorption and cholesterol metabolism were identified. Consistent characteristics of such a metabolic landscape were observed across different cohorts. A prognostic risk score model for calculating HCC risk was constructed, consisting of ADH4, ADH6, CYP2C9, CYP4F2, and RDH16. This signature predicts the 3-year survival with an AUC area of 0.708 (95%CI = 0.644 to 0.772). For calculating the risk of ICC, a prognostic risk score model was built upon the expression levels of CYP26A1, NAT2, and UGT2B10. This signature predicts the 3-year survival with an AUC area of 0.806 (95% CI = 0.664 to 0.947).
Conclusion: HCC and ICC share commonly abrupted pathways associated with the metabolism of fatty acids, retinol, arachidonic acids, and drugs, indicating similarities in their pathogenesis as primary liver cancers. On the flip side, these two types of cancer possess distinctive promising biomarkers for predicting overall survival or potential targeted therapies.
Copyright © 2022 Linchao Ding et al.
Conflict of interest statement
The authors declare that the research was conducted in the absence of any commercial or financial relationships that could be construed as a potential conflict of interest.
Figures


Similar articles
-
Differentially expressed gene profiles of intrahepatic cholangiocarcinoma, hepatocellular carcinoma, and combined hepatocellular-cholangiocarcinoma by integrated microarray analysis.Tumour Biol. 2015 Aug;36(8):5891-9. doi: 10.1007/s13277-015-3261-1. Epub 2015 Feb 26. Tumour Biol. 2015. PMID: 25712376
-
The clinical characteristics and prognostic factors of combined Hepatocellular Carcinoma and Cholangiocarcinoma, Hepatocellular Carcinoma and Intrahepatic Cholangiocarcinoma after Surgical Resection: A propensity score matching analysis.Int J Med Sci. 2021 Jan 1;18(1):187-198. doi: 10.7150/ijms.50883. eCollection 2021. Int J Med Sci. 2021. PMID: 33390787 Free PMC article.
-
A novel three‑miRNA signature predicts survival in cholangiocarcinoma based on RNA‑Seq data.Oncol Rep. 2018 Sep;40(3):1422-1434. doi: 10.3892/or.2018.6534. Epub 2018 Jun 27. Oncol Rep. 2018. PMID: 29956786
-
Synchronous double cancers of primary hepatocellular carcinoma and intrahepatic cholangiocarcinoma: a case report and review of the literature.World J Surg Oncol. 2014 Nov 10;12:337. doi: 10.1186/1477-7819-12-337. World J Surg Oncol. 2014. PMID: 25385169 Free PMC article. Review.
-
Double primary hepatic cancer (hepatocellular carcinoma and intrahepatic cholangiocarcinoma) originating from hepatic progenitor cell: a case report and review of the literature.World J Surg Oncol. 2016 Aug 17;14(1):218. doi: 10.1186/s12957-016-0974-6. World J Surg Oncol. 2016. PMID: 27535234 Free PMC article. Review.
Cited by
-
The SLIT/ROBO Pathway in Liver Fibrosis and Cancer.Biomolecules. 2023 May 1;13(5):785. doi: 10.3390/biom13050785. Biomolecules. 2023. PMID: 37238655 Free PMC article. Review.
-
Eicosanoids and other oxylipins in liver injury, inflammation and liver cancer development.Front Physiol. 2023 Feb 2;14:1098467. doi: 10.3389/fphys.2023.1098467. eCollection 2023. Front Physiol. 2023. PMID: 36818443 Free PMC article. Review.
-
Development and validation of a coagulation-related genes prognostic model for hepatocellular carcinoma.BMC Bioinformatics. 2023 Mar 9;24(1):89. doi: 10.1186/s12859-023-05220-4. BMC Bioinformatics. 2023. PMID: 36894886 Free PMC article.
-
Disulfidptosis-related signatures for prognostic and immunotherapy reactivity evaluation in hepatocellular carcinoma.Eur J Med Res. 2023 Dec 6;28(1):571. doi: 10.1186/s40001-023-01535-3. Eur J Med Res. 2023. PMID: 38057871 Free PMC article.
-
Signature construction and molecular subtype identification based on liver-specific genes for prediction of prognosis, immune activity, and anti-cancer drug sensitivity in hepatocellular carcinoma.Cancer Cell Int. 2024 Feb 19;24(1):78. doi: 10.1186/s12935-024-03242-3. Cancer Cell Int. 2024. PMID: 38374122 Free PMC article.
References
Publication types
MeSH terms
Substances
LinkOut - more resources
Full Text Sources
Medical

