. 2021 Oct;1(10):919-931.
doi: 10.1038/s43587-021-00123-6. Epub 2021 Oct 11.

Effect of APOE alleles on the glial transcriptome in normal aging and Alzheimer's disease

Affiliations

Effect of APOE alleles on the glial transcriptome in normal aging and Alzheimer's disease

Alberto Serrano-Pozo et al. Nat Aging. 2021 Oct.

Abstract

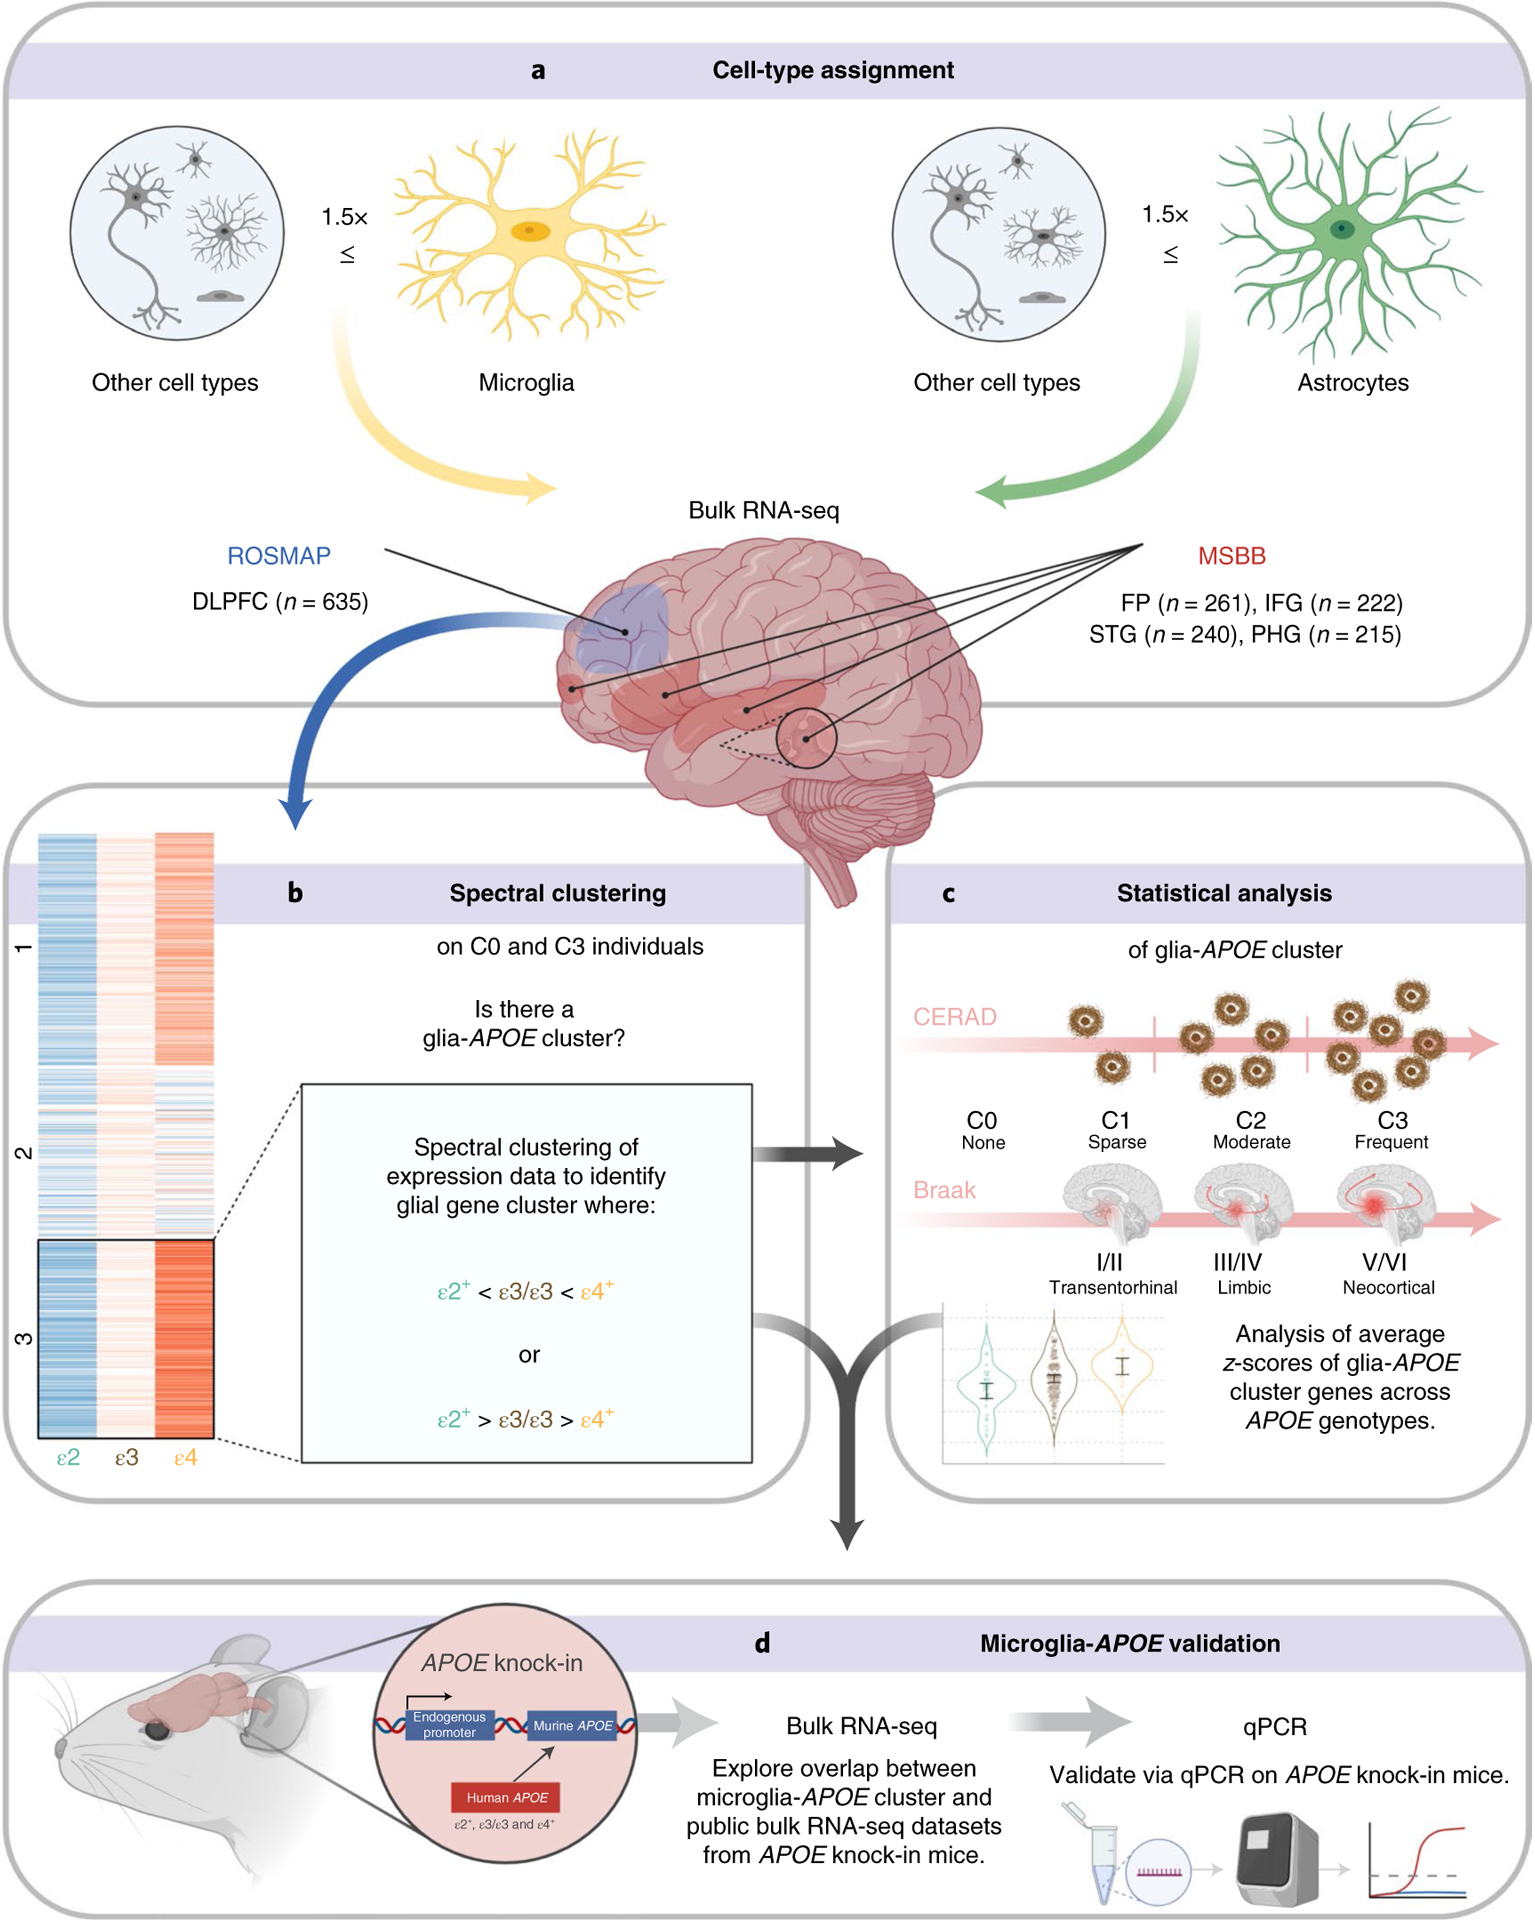
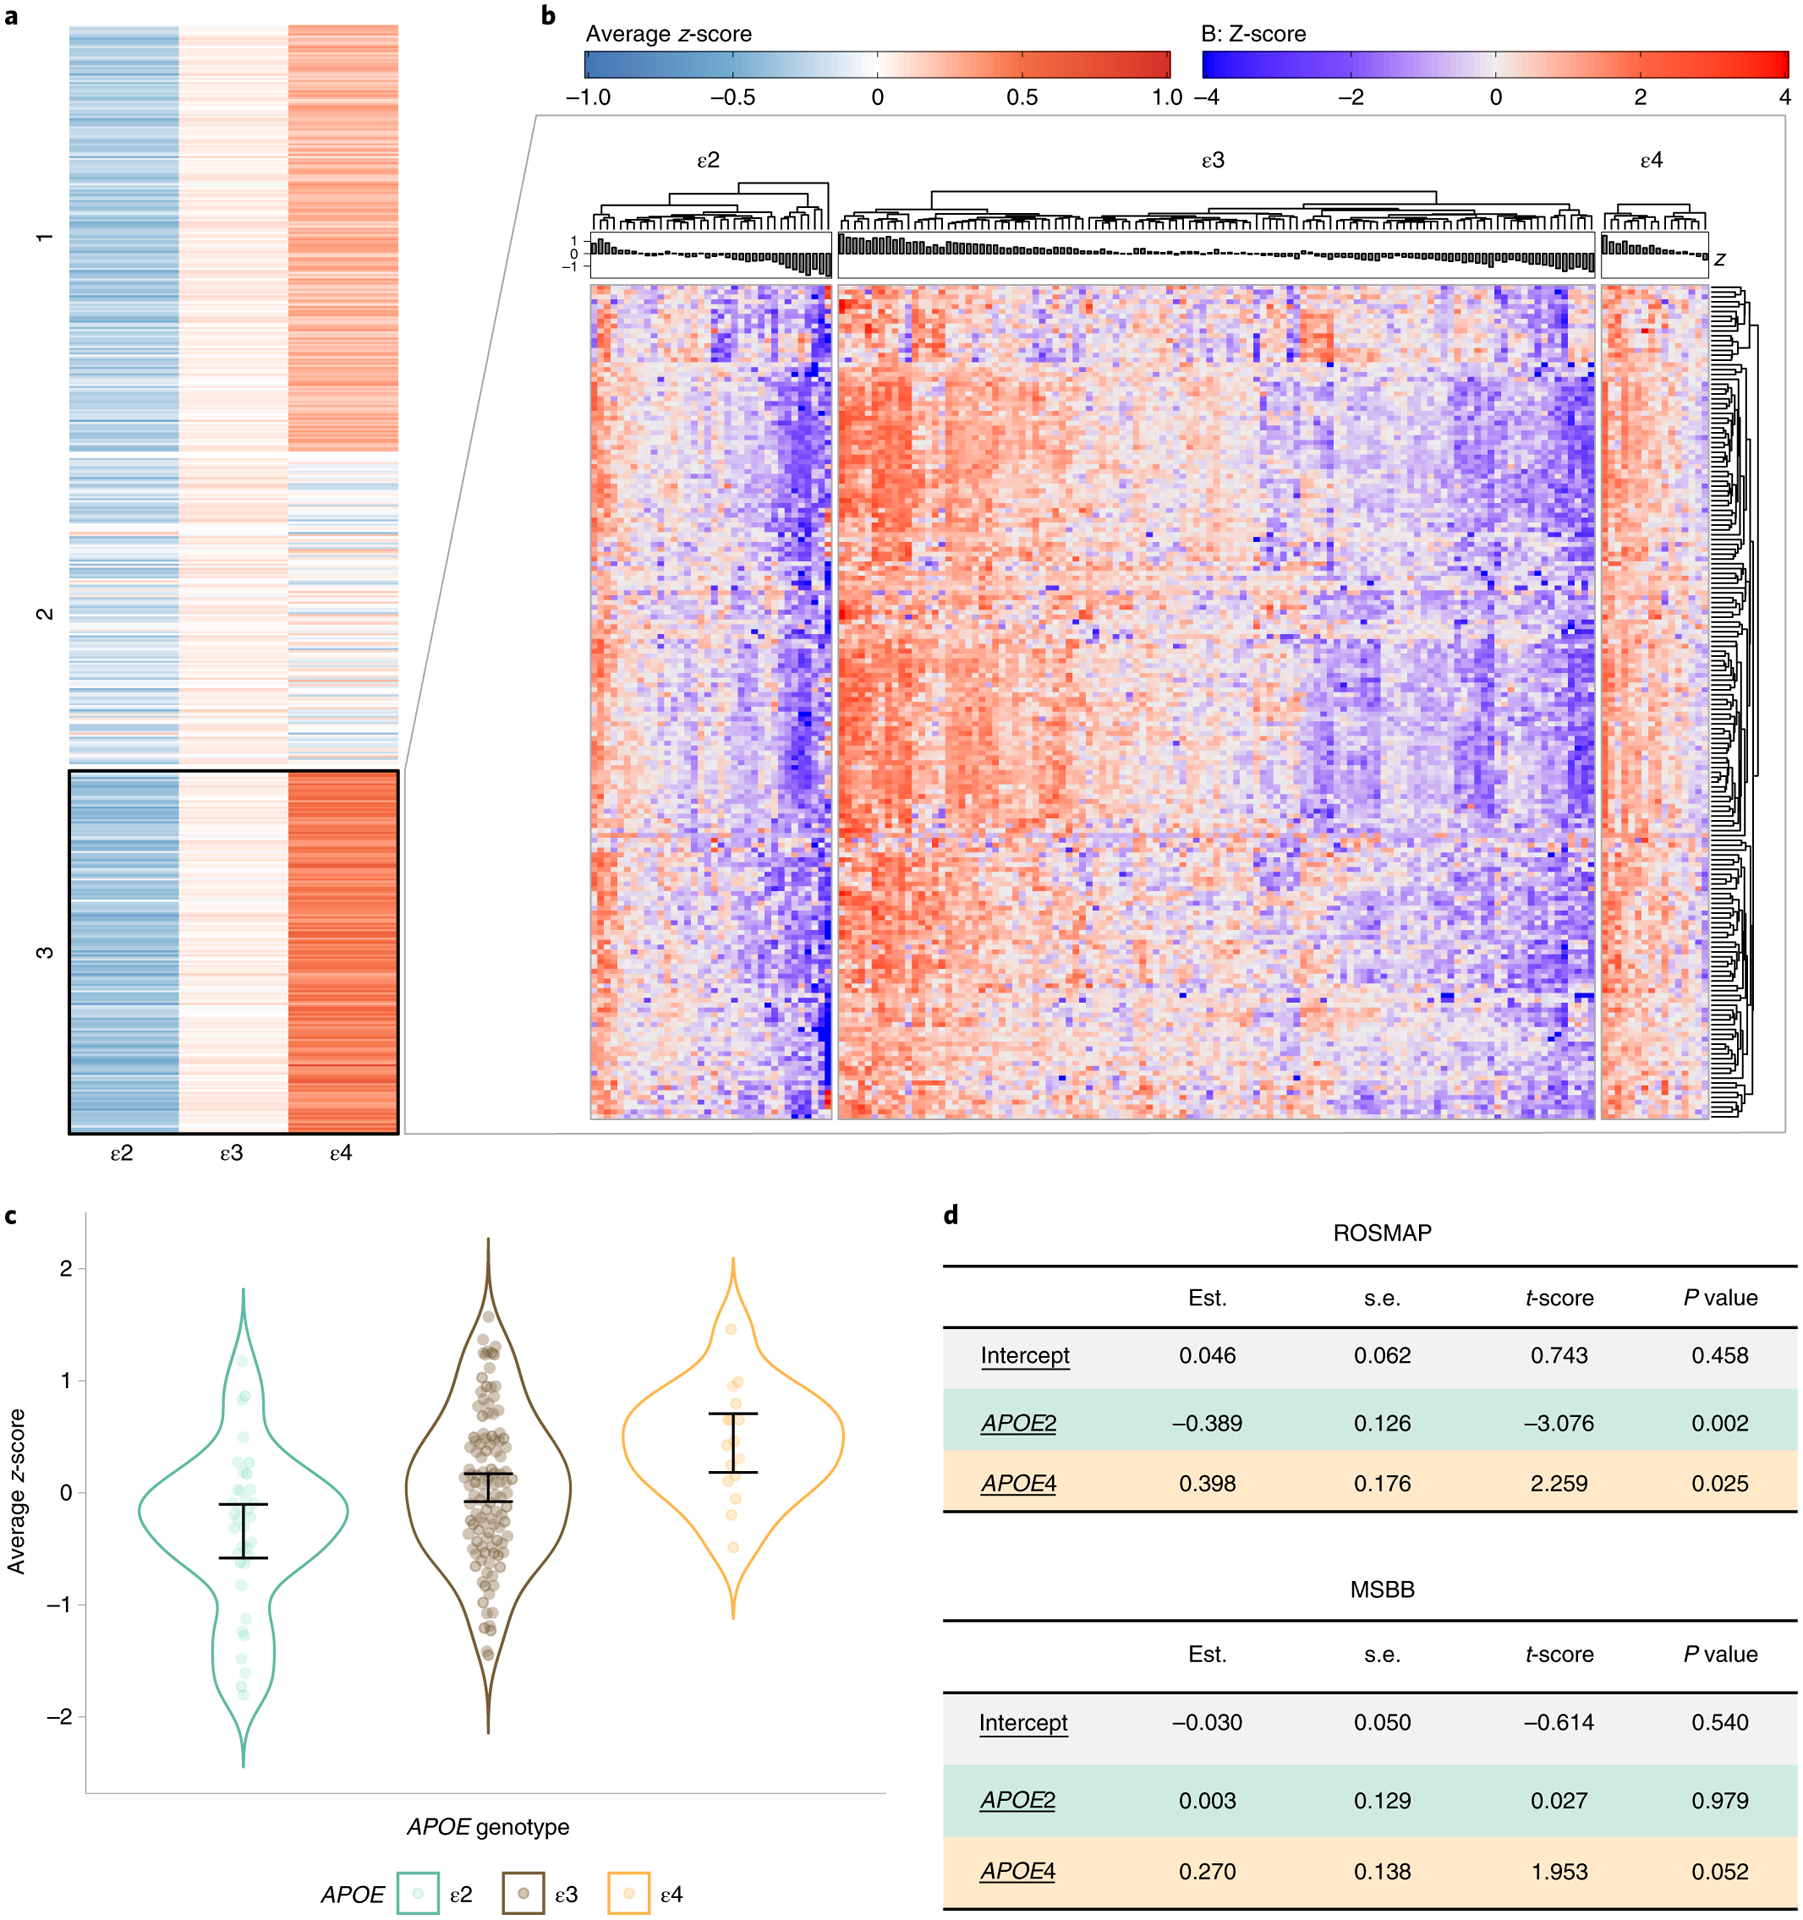
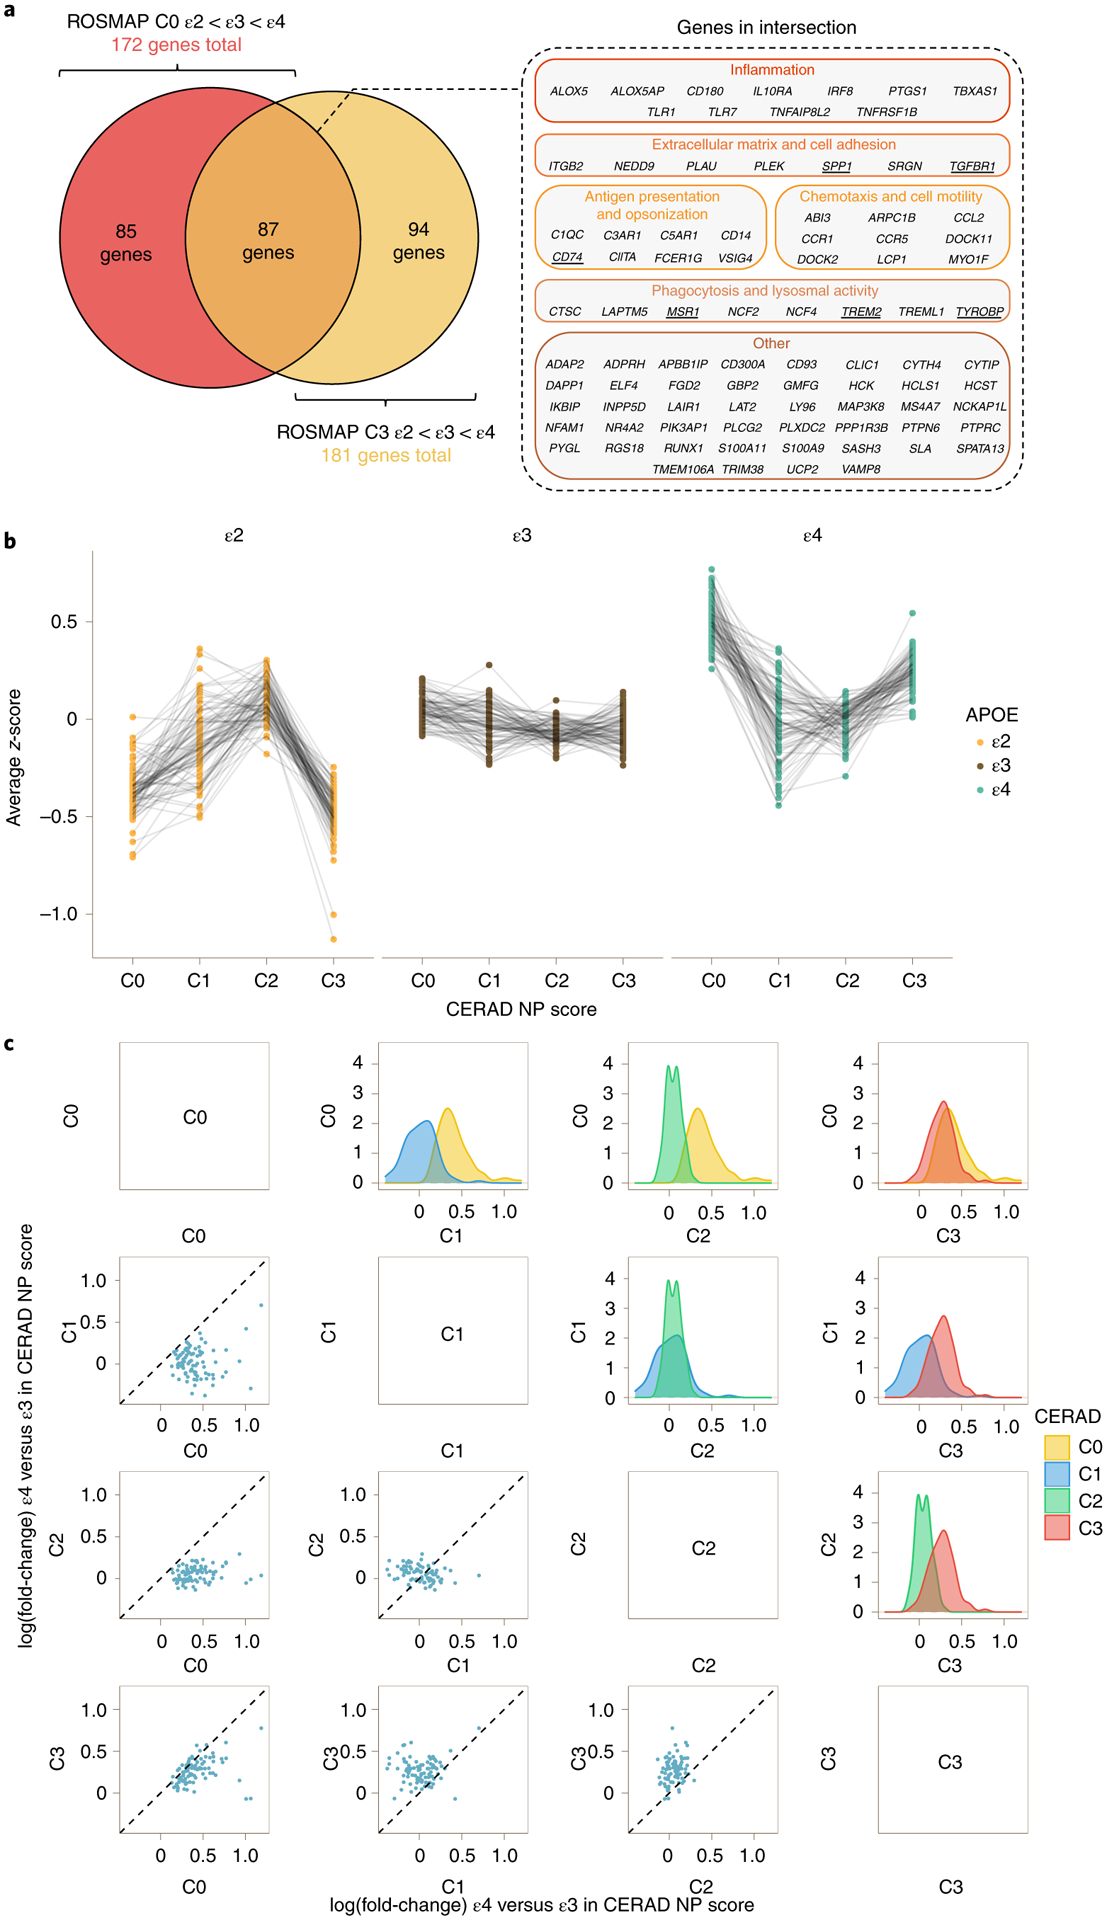
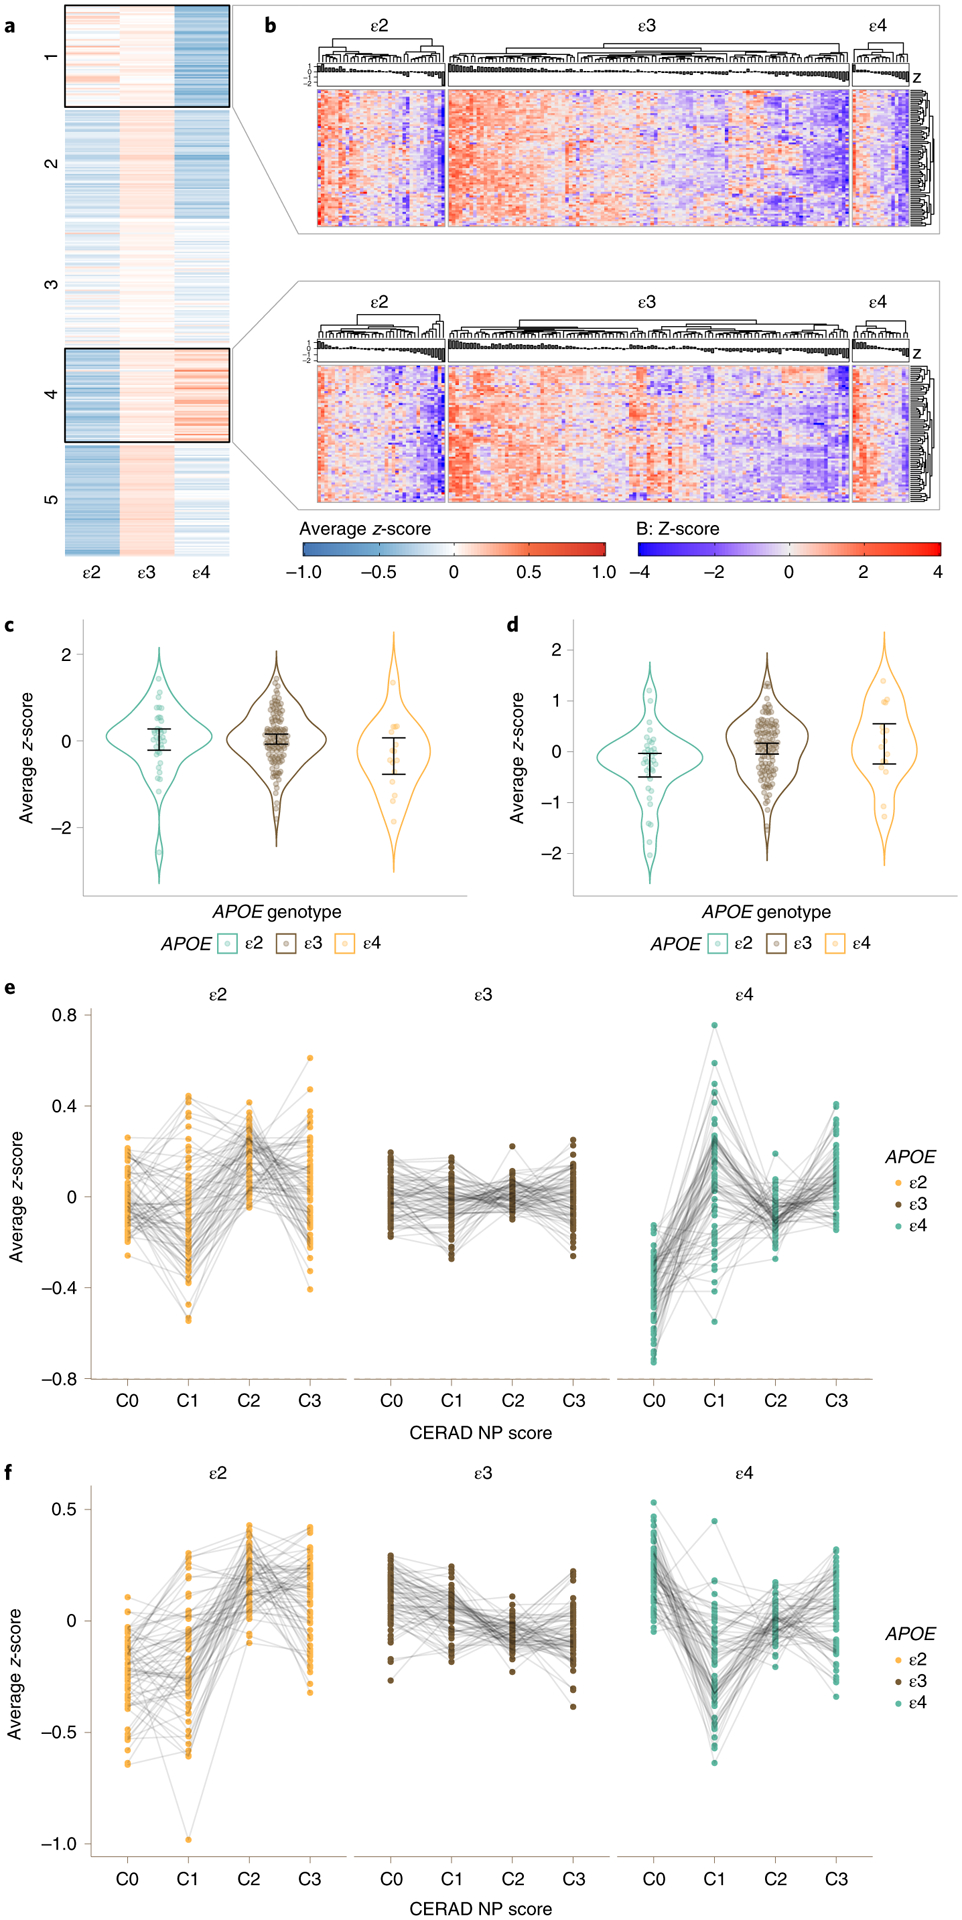
The roles of APOEε4 and APOEε2-the strongest genetic risk and protective factors for Alzheimer's disease-in glial responses remain elusive. We tested the hypothesis that APOE alleles differentially impact glial responses by investigating their effects on the glial transcriptome from elderly control brains with no neuritic amyloid plaques. We identified a cluster of microglial genes that are upregulated in APOEε4 and downregulated in APOEε2 carriers relative to APOEε3 homozygotes. This microglia-APOE cluster is enriched in phagocytosis-including TREM2 and TYROBP-and proinflammatory genes, and is also detectable in brains with frequent neuritic plaques. Next, we tested these findings in APOE knock-in mice exposed to acute (lipopolysaccharide challenge) and chronic (cerebral β-amyloidosis) insults and found that these mice partially recapitulate human APOE-linked expression patterns. Thus, the APOEε4 allele might prime microglia towards a phagocytic and proinflammatory state through an APOE-TREM2-TYROBP axis in normal aging as well as in Alzheimer's disease.


Conflict of interest statement

Competing interests The authors declare no competing interests.

Figures

Fig. 1 |
Fig. 1 |. Workflow of integrative analyses of APOE associations with microglia and astrocyte transcriptomic phenotypes.
a, Microglia- and astrocyte-predominant genes were defined as those whose expression is ≥1.5-fold in microglia or astrocytes, with respect to expression in all other cell types (neurons, oligodendrocytes, endothelial cells; and astrocytes or microglia, respectively), based on a public cell-type-specific RNA-seq database. Public bulk RNA-seq databases from ROSMAP DLPFC and MSBB STG, IFG, PHG and FP were interrogated for expression levels of these microglia- and astrocyte-predominant genes across APOE alleles ((ε2+: ε2/ε2, ε2/ε3); (ε3: ε3/ε3); (ε4+: ε2/ε4, ε3/ε4, ε4/ε4)) and CERAD NP scores (C0, none; C1, sparse; C2, moderate; C3, frequent). b, Spectral clustering of group averaged z-scores of gene expression levels enabled the identification of gene clusters that follow an ε2 > ε3 > ε4 or an ε2 < ε3 < ε4 pattern in subjects without NPs (C0) and with frequent NPs (C3), supporting an association with the APOE genotype that is independent of APOE effects on AD neuropathological changes. c, Statistical analyses were performed to test whether cluster genes are differentially expressed between APOEε2 carriers, APOEε4 carriers and APOEε3 homozygotes. d, APOE-associated genes obtained from human transcriptomic datasets were cross-validated in mouse APOE knock-in mice expressing different human APOE alleles in the mouse Apoe locus, by both RT–qPCR and analysis of publicly available transcriptomic datasets from these mice.
Fig. 2 |
Fig. 2 |. Identification of a microglial gene signature associated with APOE genotype in normal aging.
a, Spectral clustering of group averaged expression-level z-score for each of 519 microglia-predominant genes in ROSMAP subjects with no NPs (CERAD 0), split by APOE group. b, Heatmap showing detail of the expression level of cluster 2 genes from a for all ROSMAP DLPFC C0 subjects, by APOE group (n = 36 APOEε2 carriers, n = 113 APOEε3 homozygotes, n = 16 APOEε4 carriers). Note that the 172 genes of this microglia-APOE cluster overall have higher expression levels in APOEε4 and lower in APOEε2 carriers relative to APOEε3 homozygotes, who have substantial interindividual variability. c, Violin plots showing average expression-level z-score of the 172 genes of the microglia-APOE cluster in each subject, by APOE group. Error bars represent the lower and upper 95% normal confidence limits of the sample mean based on the t-distribution. d, Statistical analysis of the microglia-APOE cluster by APOE group in ROSMAP and MSBB subjects from all brain regions. The average z-scores of cluster genes were tested using a linear model. Estimated coefficient (est.), standard error (s.e.m.), t-score and corresponding two-sided P value are represented.
Fig. 3 |
Fig. 3 |. The microglia-APOE signature is independent of known APOE effects on AD neuropathological changes.
a, Venn diagram (left) showing intersection between the 172 genes from the microglia-APOE cluster obtained by spectral clustering in ROSMAP C0 subjects and the 181 genes from C3 subjects. Note that the 87 DEGs in the intersection included relevant phagocytic and proinflammatory genes (right). The underlined genes were subsequently tested by RT–qPCR in APOE knock-in mice. b, Dot plots with connecting lines depicting group averaged expression-level z-scores of the 87 genes from a split by CERAD NP score and APOE genotype. Note that the most prominent changes across APOE genotypes correspond to C0 (no NPs) and C3 (frequent NPs) subjects. c, Correlation matrix comparing the APOEε4 versus APOEε3 change in expression levels (log(fold-change)) of the 87 DEGs from the microglia-APOE cluster of C0 and C3 subjects in the ROSMAP cohort. The scatter dot plots on the left and density plots on the right demonstrate that the largest differences between APOEε4 carriers and APOEε3 homozygotes are observed in C1 (sparse NPs) and C2 (moderate NPs) versus both C0 (no NPs) and C3 (frequent NPs) subjects. By contrast, APOEε4 versus APOEε3 differences in expression levels were attenuated between C1 (sparse NPs) and C2 (moderate NPs) subjects, and between C0 (no NPs) and C3 (frequent NPs) subjects, suggesting either higher heterogeneity in microglial activation state in intermediate stages (C1 and C2) masking APOE genotype effects, or two waves of activation of this microglial transcriptional program (in C0 and C3).
Fig. 4 |
Fig. 4 |. Astrocyte transcriptomic changes associated with APOE genotype in normal aging.
a, Spectral clustering of subject group averaged expression-level z-score for each of 397 astrocyte-predominant genes in ROSMAP subjects with no neuritic plaques (CERAD 0), split by APOE group (ε2: ε2/ε2 + ε2/ε3; ε3: ε3/ε3; and ε4: ε2/ε4 + ε3/ε4 + ε4/ε4). b, Heatmap showing detail of the expression level of cluster 1 and 4 genes from a for all individuals of each APOE group. Note that the 69 genes of cluster 1 overall have higher expression levels in APOEε2 and lower in APOEε4 carriers relative to APOEε3 homozygotes, whereas the 75 genes of cluster 4 overall have higher expression levels in APOEε4 and lower in APOEε2 carriers relative to APOEε3 homozygotes. c,d, Violin plots showing group averaged expression-level z-score of the 69 genes of cluster 1 (c) and the 75 genes of cluster 4 (d) for all ROSMAP DLPFC C0 subjects, by APOE group (n = 36 APOEε2 carriers, n = 113 APOEε3 homozygotes, n = 16 APOEε4 carriers). Error bars indicate the sample mean ±95% normal confidence limits based on t-distribution. e, Dot plots with connecting lines depicting group averaged expression-level z-scores of the 69 genes from cluster 1 in the ROSMAP cohort, split by CERAD NP score and APOE genotype. f, Dot plots with connecting lines depicting group averaged expression-level z-scores of the 75 genes from cluster 4 in the ROSMAP cohort, split by CERAD NP score and APOE genotype. Note that there is much more interindividual variability and more variability across APOE groups compared to the microglia-APOE cluster.
Fig. 5 |
Fig. 5 |. Cross-validation of microglia-APOE cluster in APOE knock-in mice.
a, Bar graphs of relative quantification (2−ΔΔCt) showing mean ± s.e.m. of the expression levels of relevant microglial (underlined in Fig. 3a) and astrocyte genes across 10–12-month-old APOE2 (n = 8), APOE3 (n = 8) and APOE4 (n = 8) knock-in mice, and the results of one-way ANOVA with Tukey’s post hoc tests. Outliers in ΔCt values were detected and discarded from statistical analyses in Clu, huAPOE and Msr1. b, Bar graphs of relative quantification (2−ΔΔCt) showing mean ± s.e.m. of the expression levels of relevant genes across n = 15 biologically independent APOE3 and n = 17 biologically independent APOE4 knock-in mice treated with either PBS or LPS, and the results of two-way ANOVA with genotype, treatment and genotype × treatment interactions. Outliers in ΔCt values were detected and discarded from statistical analyses in C1qa, Cx3cr1 and Tgfbr1. c, Bar graphs of relative quantification (2−ΔΔCt) showing mean ± s.e.m. of the expression levels of relevant genes across APP/PS1 mice crossed with APOE3 (n = 8) and APOE4 (n = 10) knock-in mice, and the results of one-way ANOVA with Tukey’s post hoc tests. Outliers in ΔCt values were detected and removed from statistical analyses in Clu, Gfap and Tyrobp. NS, non-significant.

References

    1. Kunkle BW et al. Genetic meta-analysis of diagnosed Alzheimer’s disease identifies new risk loci and implicates Aβ, tau, immunity and lipid processing. Nat. Genet 51, 414–430 (2019). - PMC - PubMed
    1. Yamazaki Y, Zhao N, Caulfield TR, Liu C-C & Bu G Apolipoprotein E and Alzheimer disease: pathobiology and targeting strategies. Nat. Rev. Neurol 15, 501–518 (2019). - PMC - PubMed
    1. Reiman EM et al. Exceptionally low likelihood of Alzheimer’s dementia in APOE2 homozygotes from a 5,000-person neuropathological study. Nat. Commun 11, 667 (2020). - PMC - PubMed
    1. Serrano-Pozo A, Qian J, Monsell SE, Betensky RA & Hyman BT APOEε2 is associated with milder clinical and pathological Alzheimer disease. Ann. Neurol 77, 917–929 (2015). - PMC - PubMed
    1. Ossenkoppele R et al. Prevalence of amyloid PET positivity in dementia syndromes: a meta-analysis. JAMA 313, 1939–1949 (2015). - PMC - PubMed

Publication types

Substances