

doi: 10.1038/s43587-022-00181-4.
Epub 2022 Mar 7.
Cerebral amyloid angiopathy is associated with glymphatic transport reduction and time-delayed solute drainage along the neck arteries
Affiliations
- PMID: 36199752
- PMCID: PMC9531841
- DOI: 10.1038/s43587-022-00181-4
Item in Clipboard
Cerebral amyloid angiopathy is associated with glymphatic transport reduction and time-delayed solute drainage along the neck arteries
Nat Aging.
2022 Mar.
Erratum in
-
Publisher Correction: Cerebral amyloid angiopathy is associated with glymphatic transport reduction and time-delayed solute drainage along the neck arteries.Nat Aging. 2022 May;2(5):454. doi: 10.1038/s43587-022-00223-x. Nat Aging. 2022. PMID: 37118076 No abstract available.
-
Author Correction: Cerebral amyloid angiopathy is associated with glymphatic transport reduction and time-delayed solute drainage along the neck arteries.Nat Aging. 2023 Dec;3(12):1603. doi: 10.1038/s43587-023-00544-5. Nat Aging. 2023. PMID: 38001312 No abstract available.
No abstract available
Figures

Brain sections from ventral hippocampus from (a) 3months (M), (b) 6M and (c) 12M wild-type rats and age-matched rTg-DI rats (d-f). The brain sections were labeled with Amylo-Glo to detect fibrillar amyloid (blue), rabbit polyclonal antibody to detect cerebral microvessels (red), and goat polyclonal antibody to GFAP to identify astrocytes (green). Scale bars = 50 μm. Note that an increased number of perivascular astrocytes is evident in rTg-DI rats as early as 3M. This experiment was independently repeated twice with similar results.

Brain sections from ventral hippocampus of (a) 3-month (M), (b) 6M and (c) 12 wild-type rats and age-matched rTg-DI rats (d-f). The brain sections were labeled with Amylo-Glo to detect fibrillar amyloid (blue), rabbit polyclonal antibody to detect cerebral microvessels (red), and goat polyclonal antibody to Iba-1 to identify microglia (green). Scale bars = 50 μm. Note that increased number of microglia cells are evident in rTg-DI rats as early as 3M. This experiment was independently repeated twice with similar results.

a Graph with quantification of CSF compartment volumes of the 3-month, (M) 6M and 12M WT (light blue bars) cohort and corresponding rTg-DI rat cohorts (blue bars). Each dot above the bar represents the value obtained from one rat. Note: WT n = 9, 10, 8 at 3,6 and 12 months; rTg-DI n = 9, 9, 10 at 3, 6, and 12 months, respectively from 3 independent experiments. Data are mean ± SEM. Statistical analysis with two-way ANOVA with independent variables including strain (rTg-DI vs WT rats), time (age: 3, 6, 12M) and the time × strain interaction were fit to compare the mean differences of different outcomes between rTg-DI and WT rats, between different time points within each strain of rats. A p-value of less than 0.05 was chosen to indicate statistical significance and no adjustment of multiple testing was considered. **p-value = 0.004. b Graph with quantification tissue compartment volumes of the 3M 6M and 12M WT (light blue bars) and rTg-DI rat (blue bars) cohorts. Each dot above the bar represents the value obtained from one rat. Note: WT n = 9, 10, 8 at 3,6 and 12 months; rTg-DI n = 9, 9, 10 at 3, 6, and 12 months, respectively from 3 independent experiments. Data are mean ± SEM. Statistical analysis same as in b. *p-value = 0.038, **p-value = 0.021, ***p-value = 0.015.
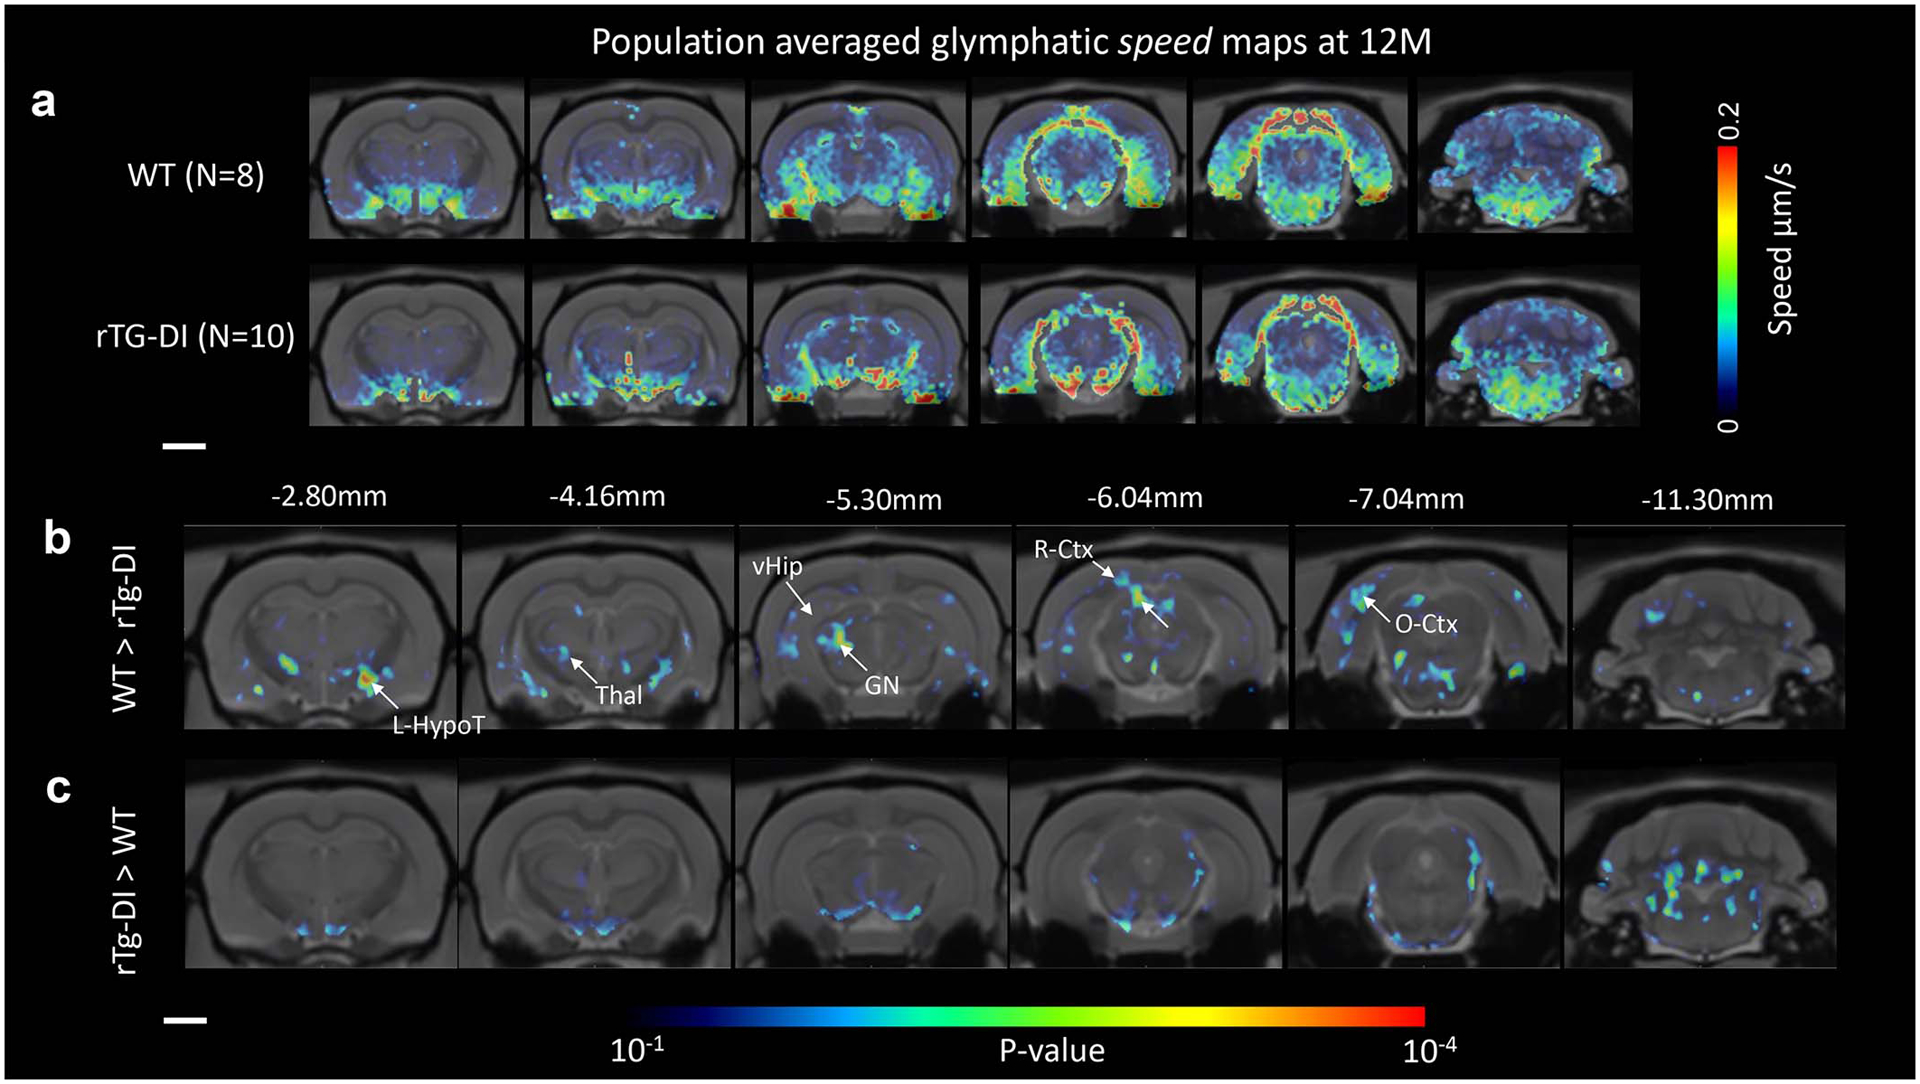
a Spatially normalized population averaged color coded speed maps of 12-month (M) old WT (N=8) and 12M rTg-DI (N=10) rats are shown overlaid onto population averaged proton density weighted anatomical MRI brain templates. b For the 12M WT (N=8) and 12M rTg-DI (N=10) cohorts, statistical parametric maps (color coded for p-values) were calculated at p-value < 0.05 and overlaid onto the MRI brain images to display anatomical areas with significant more speed in WT rats in comparison to rTg-DI rats or the reverse comparison. Note that the p-value map is uncorrected via the false-discovery rate procedure. Scale bars = 2mm. Anatomical levels of the axially displayed anatomical templates are given by their nearest Bregma distance. L-HypoT = left hypothalamus; Thal = thalamus; vHip = ventral hippocampus; GN = geniculate nucleus; R-Ctx = retro-splenial cortex; O-Ctx = Occipital cortex. Scale bar = 3 mm.

a Graph with quantification of the mean heart rate recorded of the anesthetized rats during MRI imaging from 3-month (M) 6M and 12M WT (light blue bars) and age-matched rTg-DI rats (blue bars). Each dot above the bar represents the mean heart rate recorded over the 2–3 h imaging period from one rat. Data are mean ± SEM. Note: WT n = 9, 10, 8 animals examined at 3,6 and 12 M, respectively, as independent experiments; rTg-DI n = 9, 9, 10 animals examined at 3,6 and 12 M, respectively, as independent experiments. Statistical analysis with two-way ANOVA with independent variables including strain (rTg-DI vs WT rats), time (age: 3, 6, 12M) and the time × strain interaction were fit to compare the mean differences of different outcomes between rTg-DI and WT rats, between different time points within each strain of rats. A p-value of less than 0.05 was chosen to indicate statistical significance and no adjustment of multiple testing was considered. *p-value = 0.030, **p-value = 0.013, ****p-value < 0.0001.
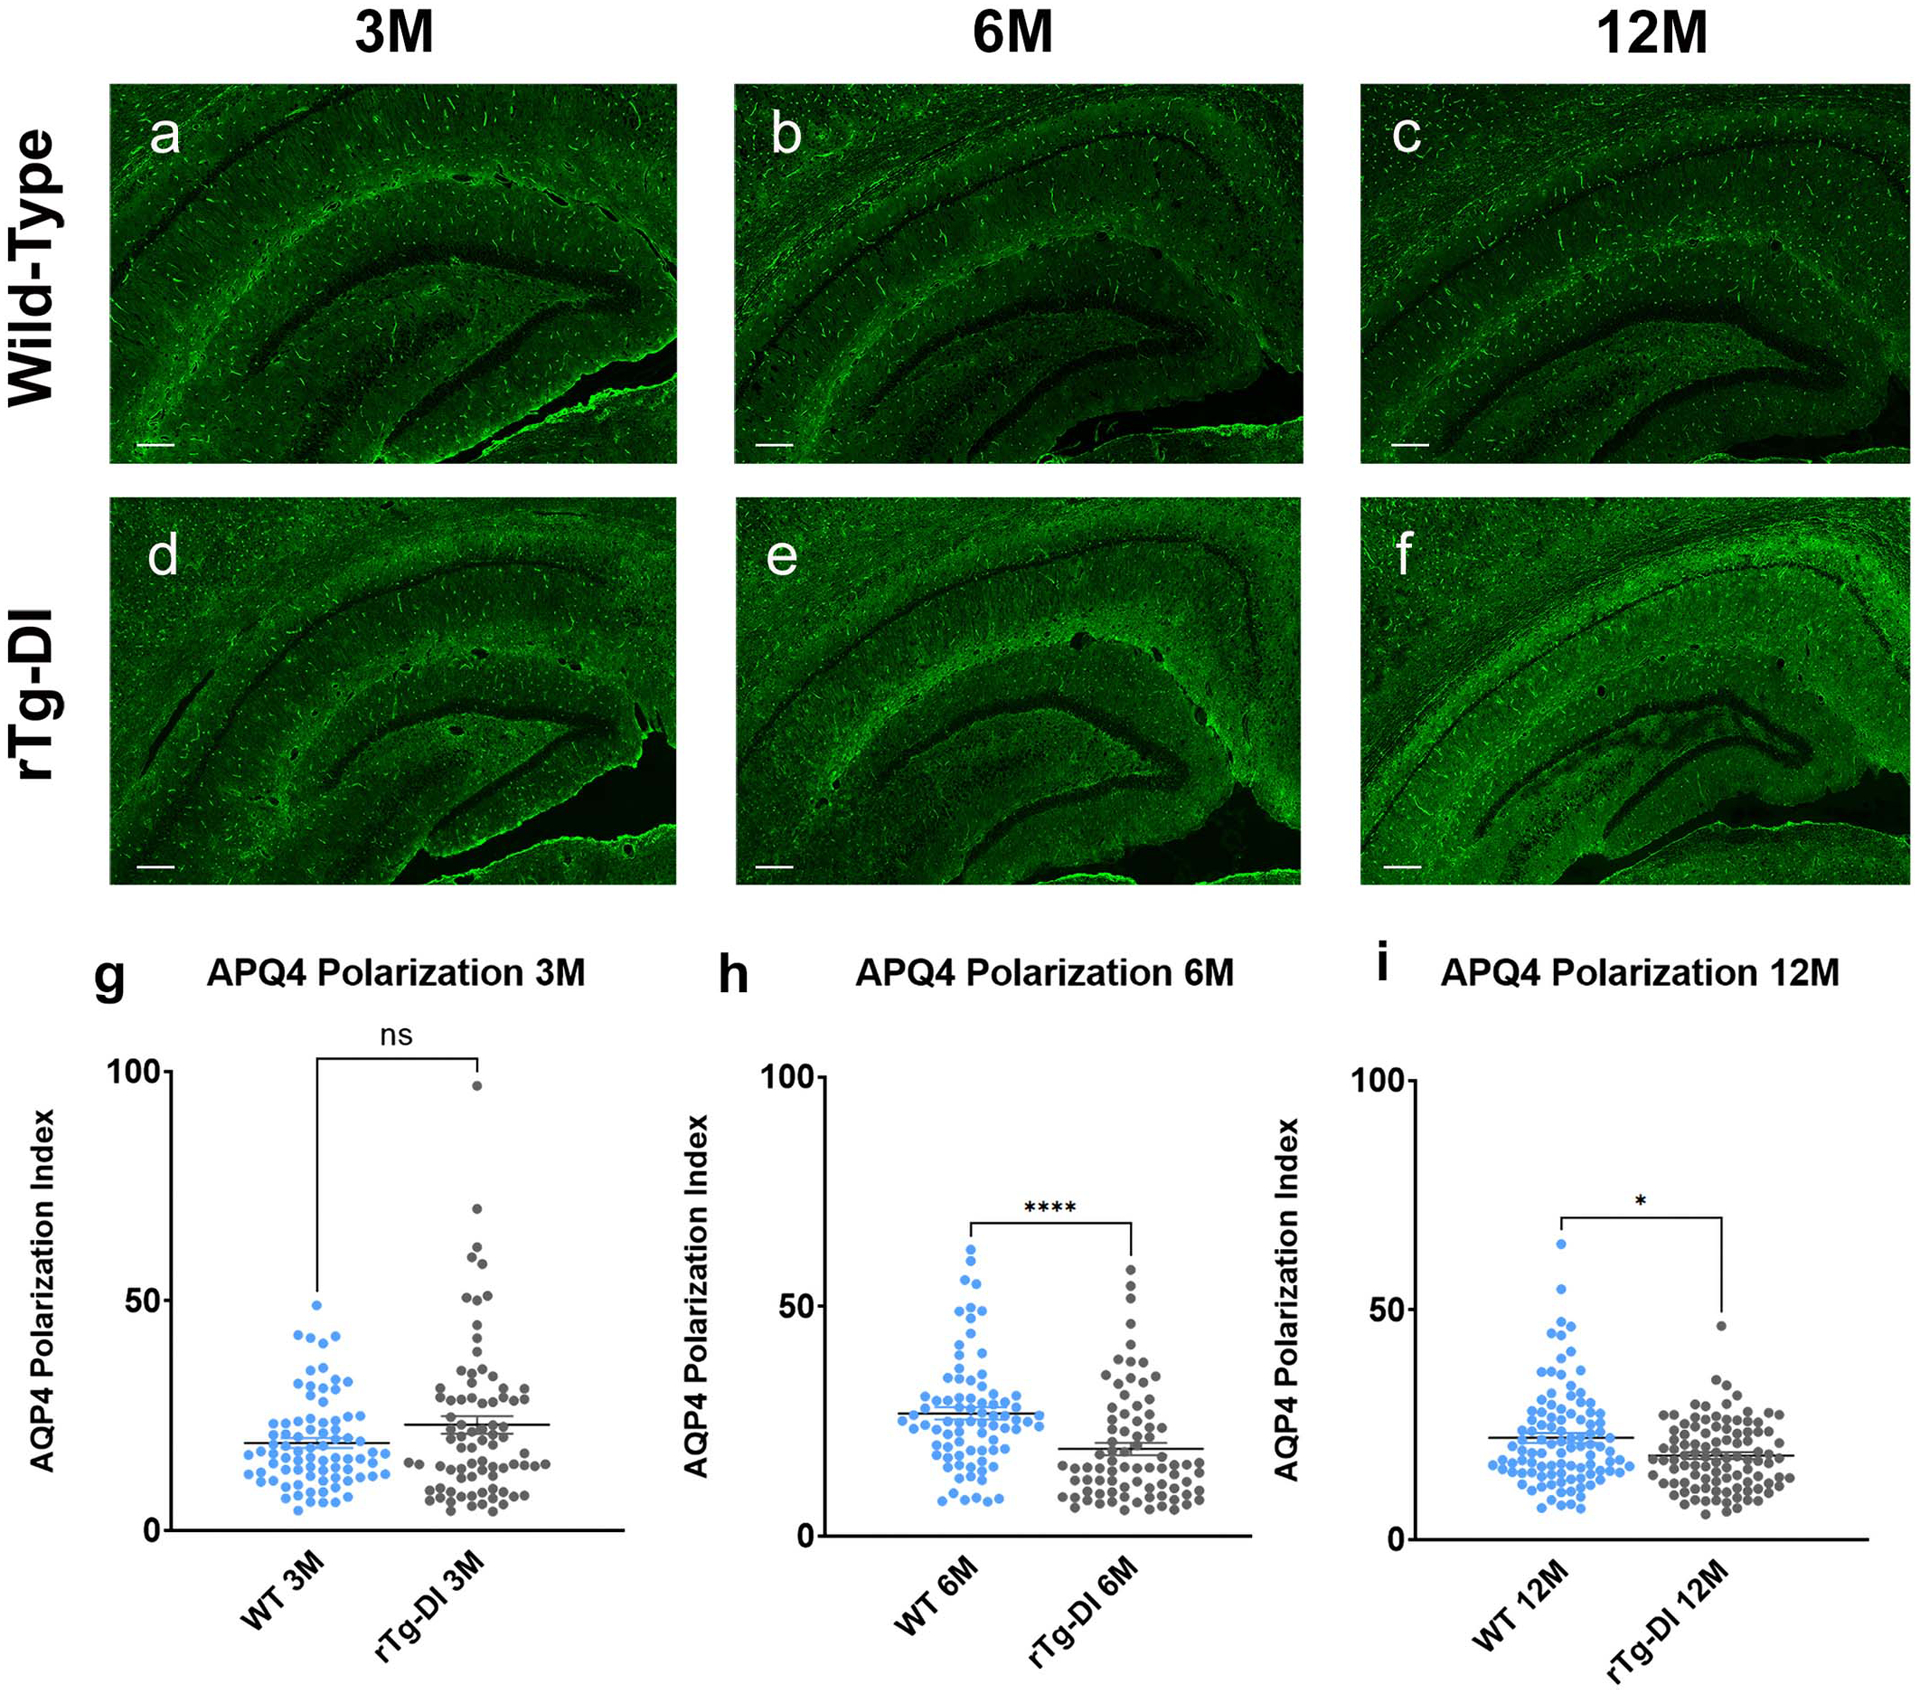
Changes in APQ4 localization was evaluated in WT and CAA rats by immunofluorescence. a-c: Representative slices at the level of the ventral hippocampus from 3M (a), 6M (b) and 12M (c) WT rats showing strong perivascular AQP4 expression and localization across all age cohorts. d-f Corresponding brain slices at the level from age-matched rTg-DI rats demonstrating that the localization of perivascular AQP4 changes with evolving CAA pathology and is down-regulated in relation to the vasculature resulting in higher tissue ‘background’ AQP4 expression in 6M (e) and 12M (f) rTg-DI rats in comparison to 3M rTg-DI rats (D). Scale bar = 500 μ g-i: Graphs of quantification of AQP4 expression in perivascular domains surrounding capillaries in WT and rTg-DI rats. At 3M there are no differences in perivascular AQP4 expression across the strains (g), however, at 6M and 12M the polarization index is decreased in rTg-DI compared to WT inferring more dispersed expression away from the capillary (h, i). Each dot represents the polarization from one capillary in the ventral hippocampus, with n=20 capillaries/rat and n=4 for 3M and 6M groups and 20capillaries/rat and n=5 for the 12M group from three independent experiments. Horizontal bars indicate mean ± SEM.; two-tailed Mann-Whitney U test. *p-value < 0.05, ****p-value < 0.0001.

a Graphs of time signal changes in individual right-sided (dashed blue lines) and left-sided (blue lines) deep cervical lymph nodes (dcLN) derived from independent experiments of n=6 normal Sprague Dawley (SD) rats. dcLN data from one rat was excluded to excessive vascular motion artefacts. Blue line indicates the mean peak time. b Corresponding graphs of time signal changes in individual right-sided (dashed magenta lines) and left-sided (magenta lines) parotid lymph nodes from the same cohort of normal SD rats. c Corresponding graphs of the time signal changes observed in the submandibular cervical lymph nodes (average of 2–3 nodes/rat) from the same cohort of normal SD rats. d-f: Velocity flux vectors – color coded for magnitude – from three different SD rats overlaid onto anatomical masks of the carotid arteries and dcLN showing the direction of solute drainage along the external carotid artery and within the carotid bifurcation towards the dcLN (black boxes). Scale bars = 1 mm.

a, b Spatially normalized population-averaged CSF speed maps of the 12M WT cohort (N=8) shown in two orthogonal plane views. Black arrow in b points to the olfactory fossa. c, d Corresponding CSF speed map of the 12M rTg-DI cohort (N=10) showing fast speed trajectories throughout the CSF compartment. Scale bars = 2mm. e, f Statistical parametric maps (color coded for p-values) overlaid onto a CSF binary map highlighting areas with differences in speed for two conditions: WT > rTg-DI (e) and rTg-DI > WT (f). Scale bars = 2mm. g Graph with quantification CSF speed of WT (blue bars) and rTg-DI rats (grey bars). Each dot above the bar represents values from one rat. Data are mean ± SEM, two-way ANOVA with CSF volume as a covariate factor. **p-value = 0.013, ***p = 0.003. ****p < 0.0001. h Graph with quantification of mean glymphatic solute speed from WT and rTg-DI rats. Data are mean ± SEM, two-way ANOVA with tissue volume as a covariate factor. *p-value = 0.044. i, j Statistical parametric maps (color coded for p-values) show tissue areas with differences in solute speed for two conditions: WT > rTg-DI (i) and rTg-DI > WT (j). k Graph with quantification of glymphatic (tissue) v-flux from WT and rTg-DI rats. Data are mean ± SEM, two-way ANOVA with tissue volume as a covariate factor. *p-value = 0.037, **p-value = 0.017. l, m Graphs of v-flux from the hippocampus and cerebellum of WT and rTg-DI rats. Data are mean ± SEM, two-way ANOVA. Hippocampus v-flux: *p-value = 0.045, **p-value = 0.009. Cerebellum v-flux: *p-value = 0.035. Note for g, h & k-l: WT n = 9, 10, 8 animals examined at 3,6 and 12 months, respectively, as independent experiments; rTg-DI n = 9, 9, 10 animals examined at 3,6 and 12 months, respectively, as independent experiments. A p-value of less than 0.05 was chosen to indicate statistical significance and no adjustment of multiple testing was considered.
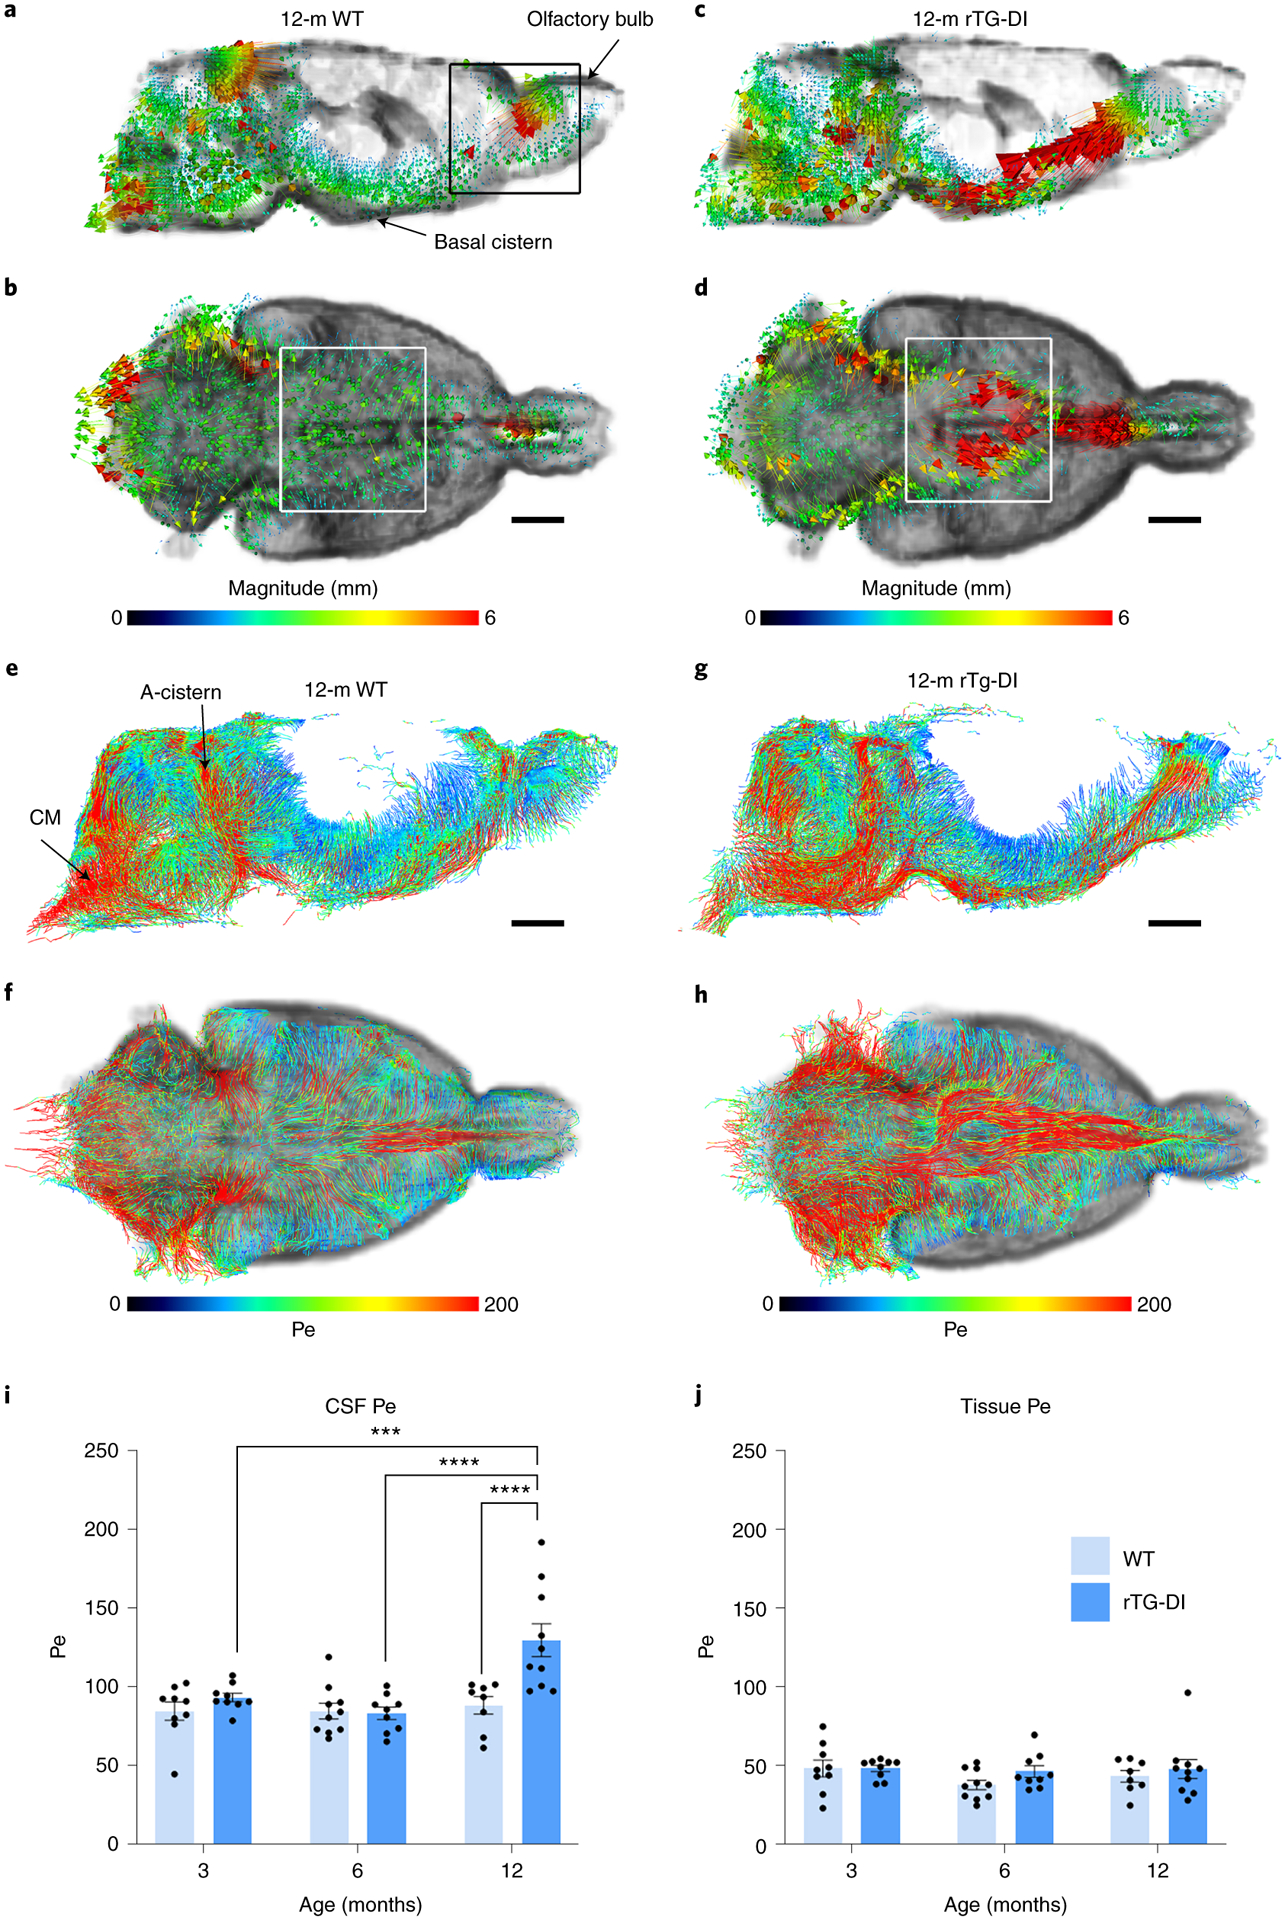
a, b Representative examples of velocity flux vectors (color coded for magnitude) in two orthogonal planes from a 12M WT rat. The black box highlights the olfactory fossa. Scale bar = 3mm. c, d Corresponding velocity flux vectors from a 12M rTg-DI rat showing different magnitude and directional pattern on the skull base. Scale bar = 3mm. White boxes in b and d highlight the Circle of Willis area showing that vectors are directed towards the olfactory bulb. e, f Representative examples of pathlines endowed with color coded Péclet (Pe) values from 12M WT rat. The red and blue colors indicate advection-dominated diffusion-dominated regions, respectively. Note the advection-dominated areas dominate the CSF compartment. g, h Corresponding pathlines endowed with color coded Pe values from a 12M rTg-DI rat with end-stage CAA disease demonstrating strong advective current along the skull base. CM = cisterna magna; A-cistern = ambient cistern. Scale bars = 3mm. i, j, Graphs with quantification of CSF and tissue Péclet number of 3-month, (M) 6M and 12M WT (light blue bars) and rTg-DI rats (blue bars). Each dot above the bar represents the value obtained from one rat. Note: WT n = 9, 10, 8 at 3, 6 and 12 months, respectively; rTg-DI n = 9, 9, 10 at 3, 6, and 12 months, respectively from three independent experiments. Data are mean ± SEM. Statistical analysis with two-way ANOVA with independent variables including strain (rTg-DI vs WT rats), time (age: 3, 6, 12M) and the time x strain interaction were fit to compare the mean differences of different outcomes between rTg-DI and WT rats, between different time points within each strain of rats. A p-value of less than 0.05 was chosen to indicate statistical significance and no adjustment of multiple testing was considered. ***p-value < 0.001, ****p-value < 0.0001.

a Illustration of the radiofrequency (RF) surface coil positioned above the neck of the rat. b The entire field-of-view captured in the neck region visualized as a 3D maximum intensity projection (MIP) image. The submandibular lymph nodes (smLN) and deep cervical lymph nodes (dcLN) are outlined (orange) to illustrate their locations in relation to brain, spine, and neck vasculature. c 3D MIPs show anatomical landmarks for locating the cervical lymph nodes in relation to the vasculature (red). Scale bar = 1mm. ICA=Internal carotid artery; ECA=external carotid artery, ParLN=Parotid lymph node. CCA=common carotid artery, sm Gland=submandibular gland. d MRI of dcLN from a normal rat acquired at a voxel resolution of 0.008 mm3. e Corresponding solute drainage map of the dcLN. Drainage is represented by color-coded signal intensity normalized to the CSF signal and time-averaged over ~2hr. Scale bars = 2 mm. f Time signal curves of tracer uptake in the left- and right- dcLNs from a normal rat. Blue line indicates the time of peak signal. g Front view of a 3D signal map of the entire field-of-view of the neck area from a normal rat. The color-coded map represents the total signal, time averaged over the ~2hr from the time of CSF administration of GadoSpin. The large vessels are displayed as a grey-scale binary mask. High signal intensity areas represent GadoSpin predominantly in the CSF compartment. Anatomical map showing the location of the right dcLN positioned lateral to the carotid arteries. h: Distinct signal (drainage) streams along the neck arteries and dcLN on the right side from a normal rat. Streams along the external carotid artery (ECA) and at the CCA bifurcation appear to merge with the dcLN. The efferent lymphatic vessel (Eff) is also visible. i: Corresponding vector velocity flux vectors (color coded for magnitude) are shown overlaid on a mask of the arteries. High magnitude velocity flux vectors along the ECA pointing towards the dcLN are noted.
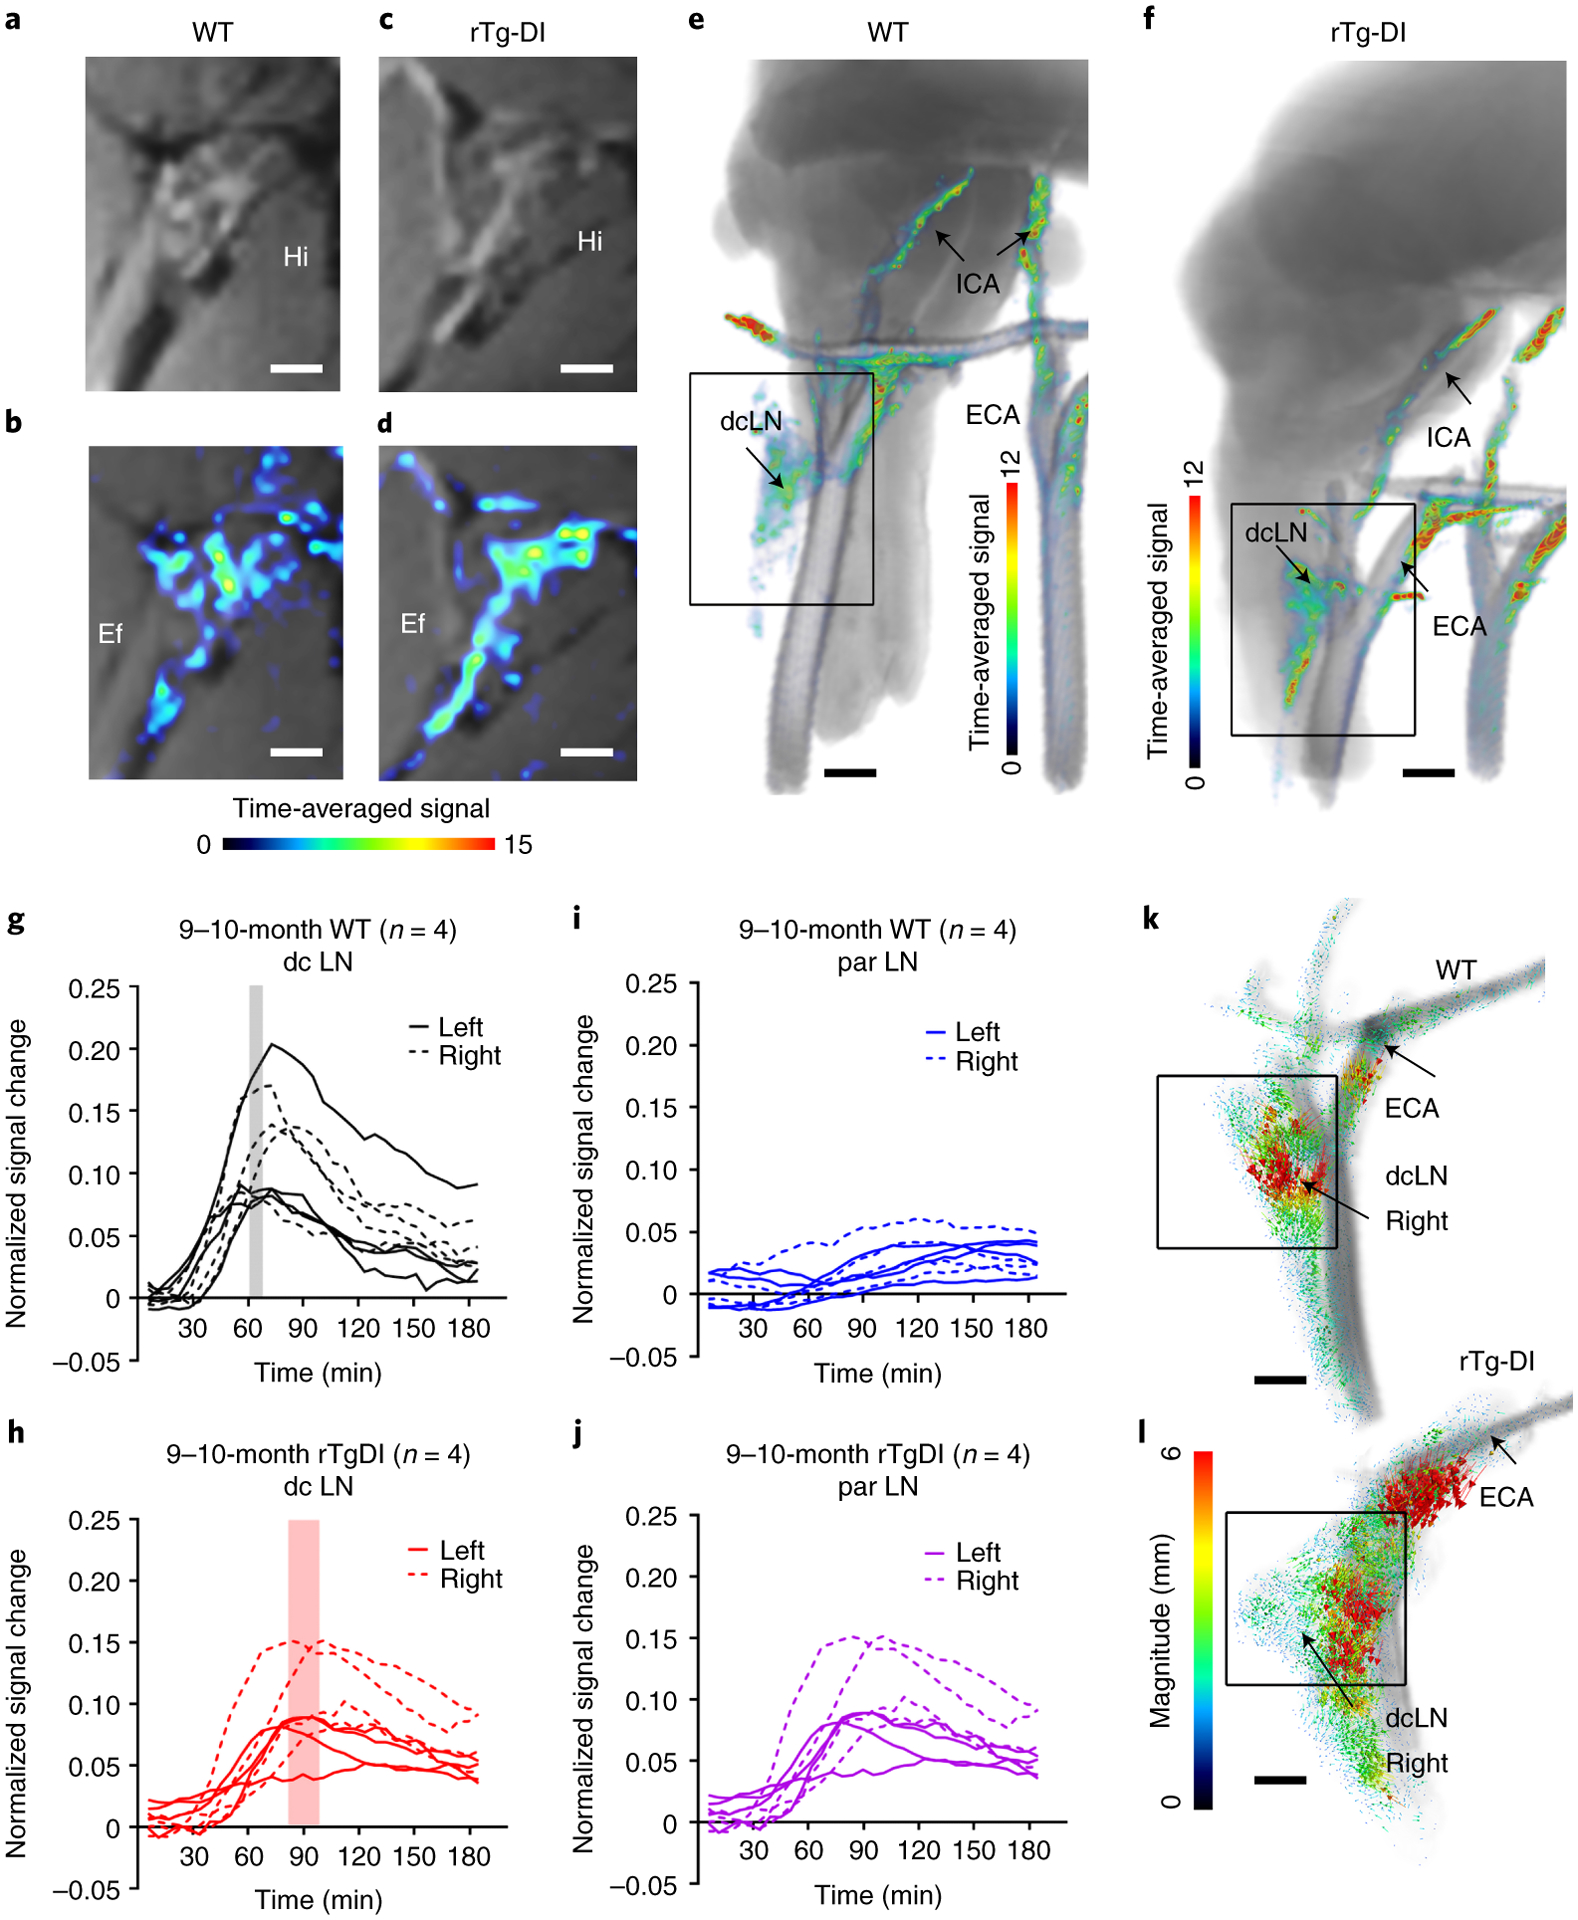
a Summed post-contrast anatomical MRI images of a deep cervical lymph node (dcLN) from a normal 9 month (M) old WT rat. b Corresponding dcLN drainage map represented by color-coded signal intensity time-averaged over ~2hrs and normalized to CSF signal intensity. Note higher signal intensity in the hilum (Hi) and efferent lymphatic vessel (Ef). c, d Corresponding images from a 9M rTg-DI rat showing similar draining pattern to the dcLN. a-d Scale bars = 2.0 mm. e, f 3D color-coded solute drainage maps showing discrete solute streams along the neck arteries and right dcLN from a 9M WT rat and a 9M rTg-DI rat. e, f Scale bars = 2mm. g Time signal curves (TSC) extracted from dcLNs derived from independent experiments of n=4 WT rats. Each line represents signal change in an individual right- or left-sided dcLNs and the rectangle represents the mean time-to-peak for solute drainage of all the dcLNs. h Corresponding TSC data extracted from dcLNs derived from independent experiments of n=4 rTg-DI rats. An independent, two-sided t-test revealed that the dcLN time-to-peak of rTg-DI rats was significantly longer than that of WT rats (left dcLN: p-value = 0.017; right dcLN: p-value = 0.007). i, j Corresponding TSC extracted from parotid lymph nodes from the same WT and rTg-DI rats. Each line represents an individual parotid lymph node. k, l Velocity flux vectors – color coded for magnitude – from one of the 9M WT and 9M rTg-DI rats overlaid on the corresponding anatomical template showing solute drainage along the external carotid artery (ECA) directed towards the dcLN (black box) in both rats. Scale bars = 1 mm.
References
-
- Thal DR et al. Two types of sporadic cerebral amyloid angiopathy. J Neuropathol Exp Neurol 61, 282–293 (2002). - PubMed
Publication types
MeSH terms
Grants and funding
LinkOut - more resources
Full Text Sources
Medical
