Review
. 2022 Sep 1;12(38):24946-24957.
doi: 10.1039/d2ra04795k. eCollection 2022 Aug 30.

Recent progress of Ga-based liquid metals in catalysis

Affiliations
Review

Recent progress of Ga-based liquid metals in catalysis

Xi Sun et al. RSC Adv. .

Abstract

Within the last decade, the application of gallium-based liquid metals in catalysis has received great attention from around the world. This article provides an overview concerning Ga-based liquid metals (LMs) in energy and environmental applications, such as the catalytic synthesis of ethylene by non-petroleum routes via Pd-Ga liquid catalysts, alkane dehydrogenation via Pd-Ga or Pt-Ga catalysts, CO2 hydrogenation to methanol via Ni Ga or Pd/Ga2O3 catalysts, and catalytic degradation of CO2 via EGaIn liquid metal catalysts below 500 °C, where Ga-based liquid metal catalysts exhibit high selectivity and low energy consumption. The formation of isolated metal sites in a liquid metal matrix allows the integration of several characteristics of multiphase catalysis (particularly the operational friendliness of product separation procedures) with those of homogeneous catalysis. In the end, this article sheds light on future prospects, opportunities, and challenges of liquid metal catalysis.


Conflict of interest statement

There are no conflicts to declare.

Figures
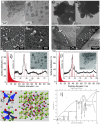
Fig. 1
Fig. 1. TEM images of Ga–Pd nanoparticles: (a) GaPd2 cluster particles, 3–7 nm diameter; (b) GaPd nanoparticles, 1–5 nm diameter; SEM images of (c) GaPd2 and (d) GaPd loaded on alumina carriers; (e) SEM images of pure Ga-modified porous glass. (f and g) Pd/Ga = 10 samples before reaction; (h) Pd/Ga sample 20 h post-reaction; (i) GaPd particle size distribution measured by disk centrifuge, TEM image, and XRD image with a theoretical histogram of nanoparticles; (j) GaPd2 particle size distribution measured by disk centrifuge, TEM image, and XRD image with theoretical histograms; (k) chemical bonding analysis plots in GaPd and Ga7Pd3; (l) Ga–Pd phase diagram.
Fig. 2
Fig. 2. SCALMS loaded with Al2O3 (blue), SiO2 (red), and SiC (black) at 500–600 °C in terms of propane productivity (a–c) and catalyst selectivity (d–f).
Fig. 3
Fig. 3. (a) The HRTEM image of the Pd/β-Ga2O3 catalyst after reaction; (b) metal particle size distribution.
Fig. 4
Fig. 4. Performance evaluation of EGaIn alloys. (a) Carbon production rate with a continuous pass of CO2 to the bubble tower reactor at 200 °C and ambient pressure; (b) reduction product rate with a continuous pass of CO2 at different temperatures; (c) XPS analysis of solid product elemental composition; (d) Faraday efficiency product diagram; (e) Schematic diagram of Ce-Galinstan catalysis.
Fig. 5
Fig. 5. Schematics and Raman spectra of solid carbon produced from CO2 using liquid metal. (a–d) Schematic illustrations for preparing a suspension of the catalyst (a and b) and the CO2 reduction process (c and d) using various mechanical energy inputs. (e) A schematic illustration of the CO2 conversion process. The formation/detachment of the carbon flakes and the generation/escape of O2 are indicated. (f–k) Raman spectra of the samples obtained from the reaction mixes of Ga with various silver salts as precursors in DMF: (f) AgF (vs. time), (g) AgCl, (h) AgBr, (i) AgI, (j) AgOTf, and (k) AgNO3. The D and G bands at 1350 cm−1 and 1600 cm−1, respectively, emerged after the reactions occur. (l and m) Raman spectra (vs. time) from mixture surfaces from the ten-times diluted reaction system (Ga and AgF mix) by employing DMF (l) and DMF + ETA (m) as the reaction solutions. The blue and red curves in (f)–(m) are the respective Raman spectra for the samples before and after reaction.
Fig. 6
Fig. 6. Time-dependent UV-Vis absorption spectra of the reduction of 7.2 × 10⁻⁵ M methylene blue by excess NaBH4 in the presence of (a) Ag–Galinstan and (b) Au–Galinstan catalysts.
None
Xi Sun
None
Hui Li

References

    1. Wang Q. Yu Y. Liu J. Adv. Eng. Mater. 2018;20:1700781.
    1. Lu Y. Hu Q. Lin Y. Pacardo D. B. Wang C. Sun W. Ligler F. S. Dickey M. D. Gu Z. Nat. Commun. 2015;6:1–10. - PMC - PubMed
    1. Dickey M. D. Chiechi R. C. Larsen R. J. Weiss E. A. Weitz D. A. Whitesides G. M. Adv. Funct. Mater. 2008;18:1097–1104.
    1. Calabrese R. E. Bury E. Haque F. Koh A. Park C. Composites, Part B. 2022;234:109686.
    1. Ozutemiz K. B. Wissman J. Ozdoganlar O. B. Majidi C. Adv. Mater. Interfaces. 2018;5:1701596.