

The R-S difference index: A new electrocardiographic method for differentiating idiopathic premature ventricular contractions originating from the left and right ventricular outflow tracts presenting a left bundle branch block pattern
- PMID: 36200051
- PMCID: PMC9527274
- DOI: 10.3389/fphys.2022.1002926
The R-S difference index: A new electrocardiographic method for differentiating idiopathic premature ventricular contractions originating from the left and right ventricular outflow tracts presenting a left bundle branch block pattern
Abstract
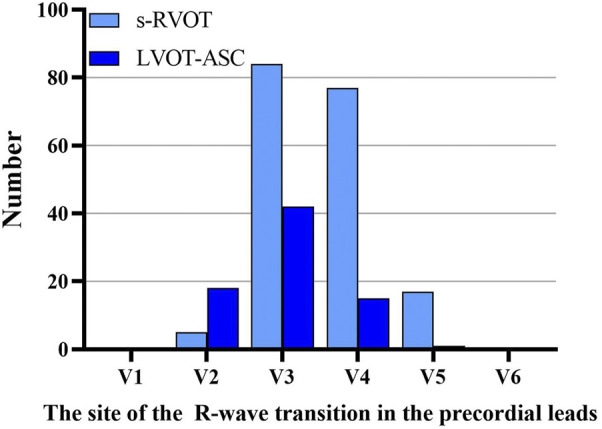
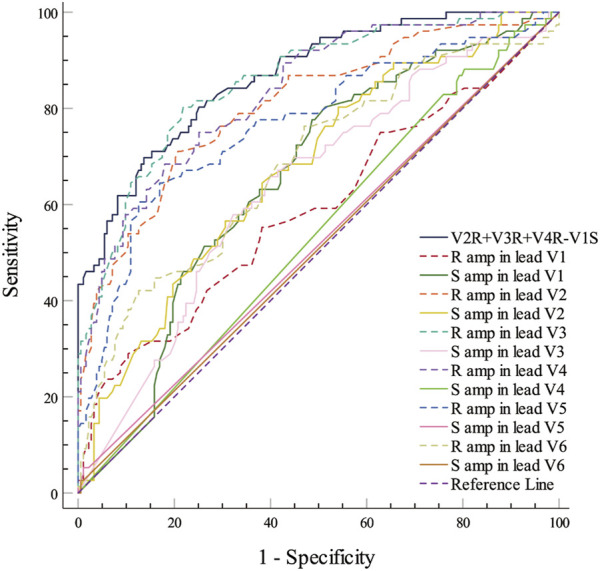
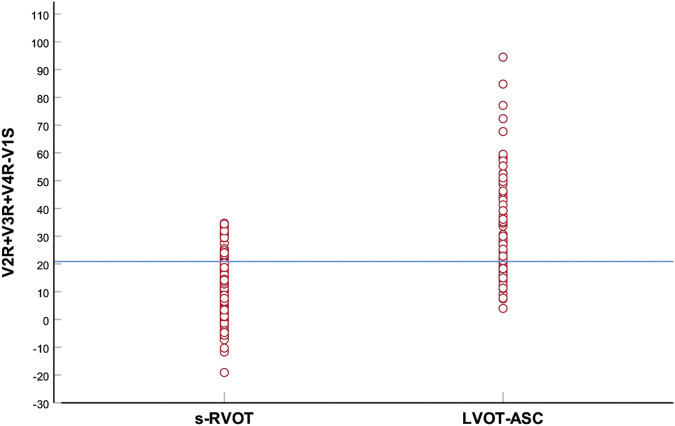
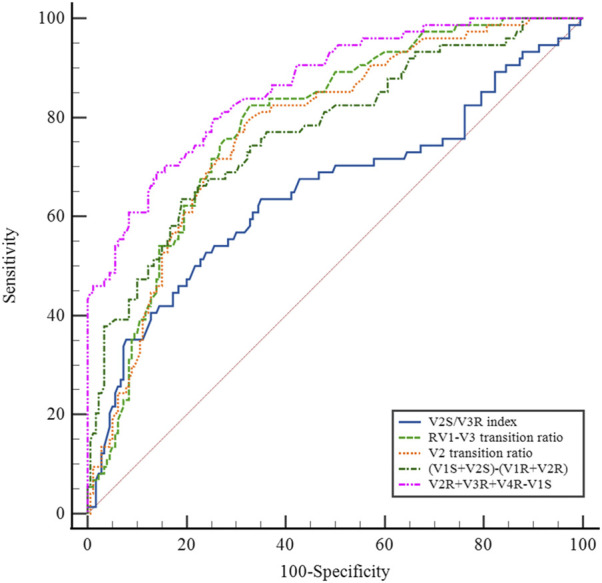
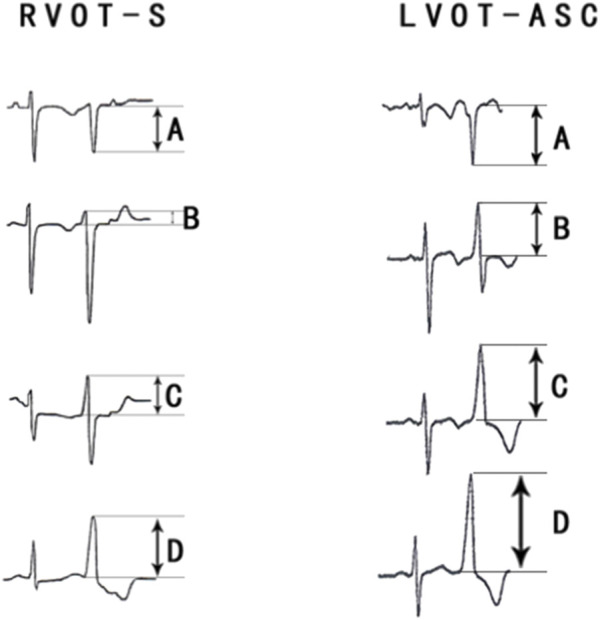
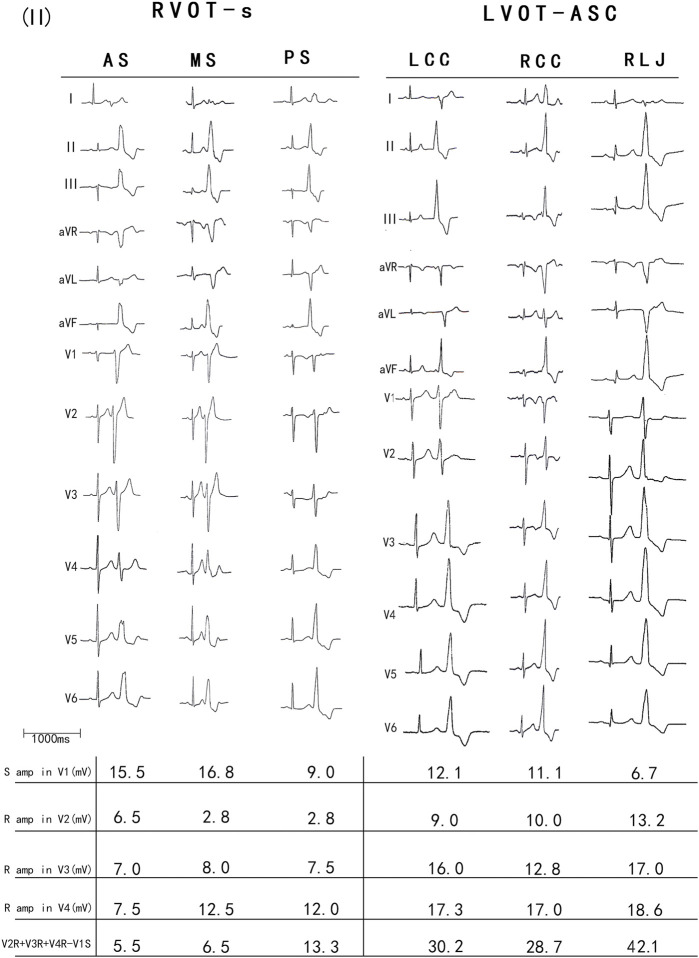
Introduction: Differentiating idiopathic premature ventricular contractions (PVCs) originating from the right and left ventricular outflow tracts with a left bundle branch block (LBBB) morphology is relevant to catheter ablation planning and important for lowering the risk of complications. This study established a novel electrocardiographic (ECG) criterion to discriminate PVCs originating from the septum of the right ventricular outflow tract (s-RVOT) and those originating from the aortic sinus cusp of the left ventricular outflow tract (LVOT-ASC). Methods: A total of 259 patients with idiopathic PVCs originating from ventricular outflow tract with a LBBB pattern who underwent successful catheter ablation were retrospectively included. Among them, the PVCs originated from the s-RVOT in 183 patients and from the LVOT-ASC in 76 patients. The surface ECGs of the PVCs and sinus beats were analyzed using an electronic caliper. The R-S difference index in the precordial leads was calculated as V2R + V3R + V4R - V1S. Results: PVCs originating from both the s-RVOT and LVOT-ASC displayed an inferior axis (dominant R waves in leads II, III, and aVF). Compared with the s-RVOT group, the R-wave amplitudes on leads II, III, and aVF were significantly larger in the LVOT-ASC group (p < 0.001, p < 0.003, and p < 0.001, respectively). Compared to the LVOT-ASC group, the s-RVOT group showed smaller R-wave amplitudes on leads V1-V6 (p = 0.021, p < 0.001, p < 0.001, p < 0.001, p < 0.001, and p < 0.001, respectively) and larger S-wave amplitudes on leads V1-V3 (p < 0.001, p < 0.001, and p < 0.001, respectively). Lead V3 was the most common transitional lead in both groups. Analysis of the receiver operating characteristic curve showed that the R-wave amplitude on lead V3 had the largest area under the curve (AUC) of 0.856 followed by the R-wave amplitudes on leads V4 (0.834) and V2 (0.806). The AUC of the R-S difference index was 0.867. An R-S difference index greater than 20.9 predicted an LVOT-ASC origin with 73.7% sensitivity and 86.3% specificity. This index is superior to previous criteria in differentiating PVCs with LBBB morphology and inferior axis originating from s-RVOT vs. LVOT-ASC. Conclusions: The R-S difference index in precordial leads is a useful new ECG criterion for distinguishing LVOT-PVCs from RVOT-PVCs with LBBB morphology.
Keywords: aortic sinus cusp; diagnostic index; electrocardiogram; premature ventricular contractions; septal right ventricular outflow tract.
Copyright © 2022 Zhao, Li, Zhang, Xie, Lu, Liu, Miao and Cui.
Conflict of interest statement
The authors declare that the research was conducted in the absence of any commercial or financial relationships that could be construed as a potential conflict of interest.
Figures
References
-
- Betensky B. P., Park R. E., Marchlinski F. E., Hutchinson M. D., Garcia F. C., Dixit S., et al. (2011). The V(2) transition ratio: A new electrocardiographic criterion for distinguishing left from right ventricular outflow tract tachycardia origin. J. Am. Coll. Cardiol. 57 (22), 2255–2262. 10.1016/j.jacc.2011.01.035 - DOI - PubMed
-
- Di C., Wan Z., Tse G., Letsas K. P., Liu T., Efremidis M., et al. (2019). The V1-V3 transition index as a novel electrocardiographic criterion for differentiating left from right ventricular outflow tract ventricular arrhythmias. J. Interv. Card. Electrophysiol. 56 (1), 37–43. 10.1007/s10840-019-00612-0 - DOI - PubMed
-
- Efremidis M., Vlachos K., Kyriakopoulou M., Mililis P., Martin C. A., Bazoukis G., et al. (2021). The RV1-V3 transition ratio: A novel electrocardiographic criterion for the differentiation of right versus left outflow tract premature ventricular complexes. Heart Rhythm O2 2 (5), 521–528. 10.1016/j.hroo.2021.07.009 - DOI - PMC - PubMed
LinkOut - more resources
Full Text Sources
Miscellaneous