

Combination of Changes in CEA and CA199 Concentration After Neoadjuvant Chemoradiotherapy Could Predict the Prognosis of Stage II/III Rectal Cancer Patients Receiving Neoadjuvant Chemoradiotherapy Followed by Total Mesorectal Excision
- PMID: 36200095
- PMCID: PMC9529229
- DOI: 10.2147/CMAR.S377784
Combination of Changes in CEA and CA199 Concentration After Neoadjuvant Chemoradiotherapy Could Predict the Prognosis of Stage II/III Rectal Cancer Patients Receiving Neoadjuvant Chemoradiotherapy Followed by Total Mesorectal Excision
Abstract
Background: Previous studies have shown that the levels of serum tumor markers CEA and CA19-9 were related to chemoradiotherapy. Therefore, it has been assumed that dynamic monitoring of these markers could predict the prognosis of stage II/III rectal cancer (RC). Therefore, this study proposed to evaluate the prognostic value of changes in serum tumor biomarkers for stage II/III RC patients undergoing neoadjuvant chemoradiotherapy (NCRT) followed by total mesorectal excision (TME).
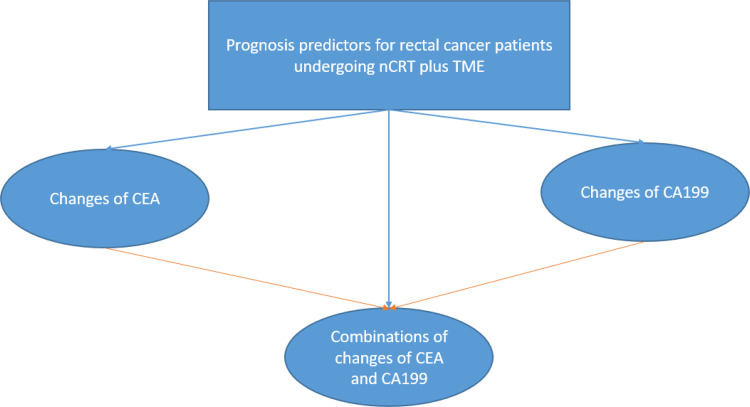
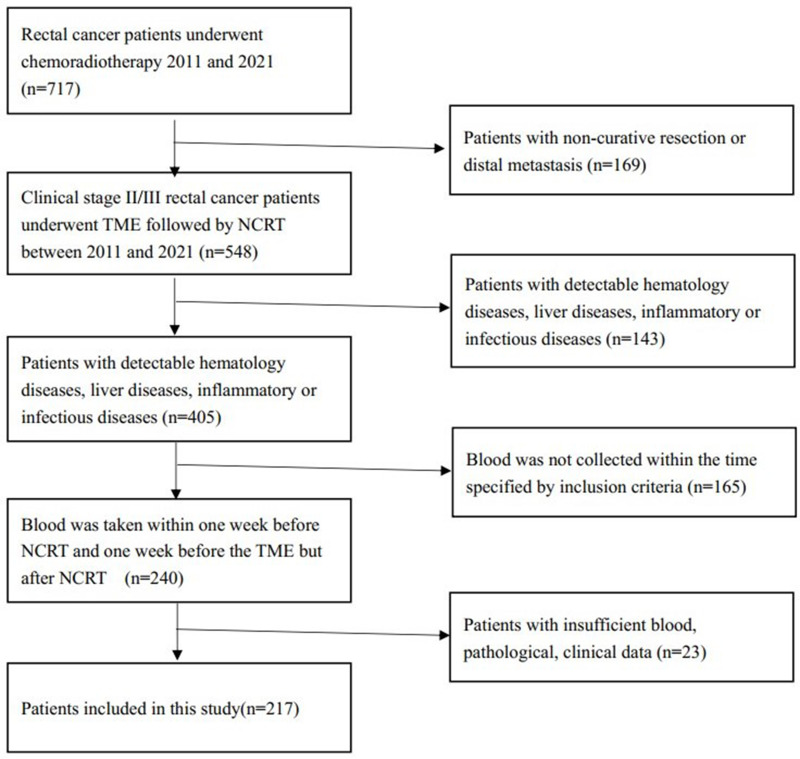
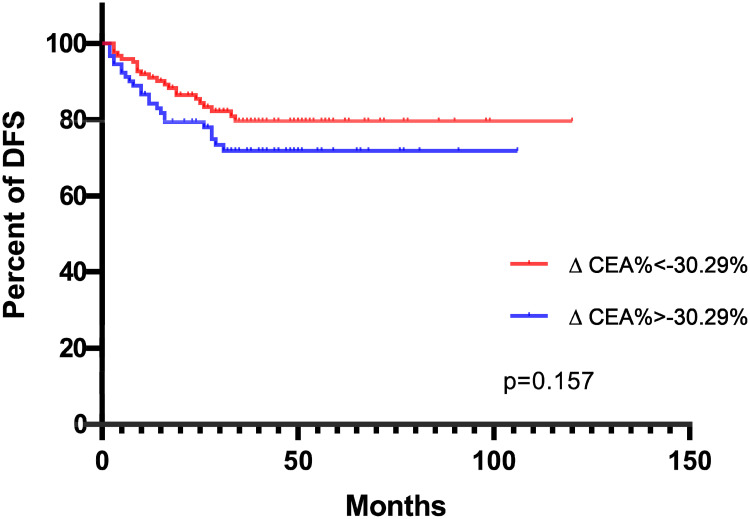
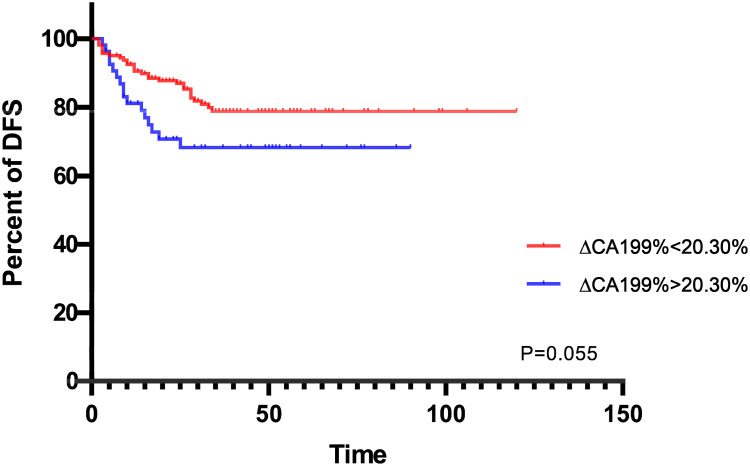
Methods: A total of 217 patients with stage II/III RC receiving NCRT followed by TME were retrospectively analyzed. Serum CEA and CA199 levels were measured within one week before NCRT and one week before TME. The optimal cut-off points of ∆CEA% and ∆CA199% for prognosis prediction were calculated by receiver operating characteristics (ROC) analysis. Independent prognostic predictors were identified by univariate and multivariate Cox regression analyses. To avoid the efficiency of ∆CEA% and ∆CA199% on serum tumor biomarker change (STBC) score, two models including and excluding ∆CEA% and ∆CA199% were established separately in multivariate analysis.
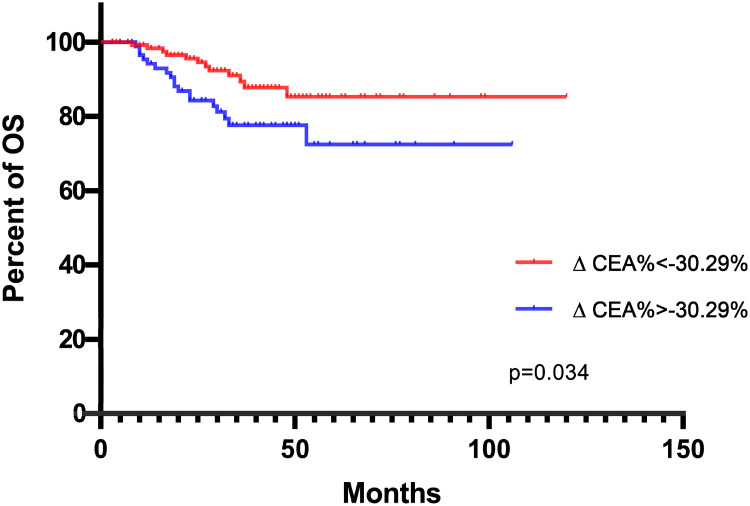
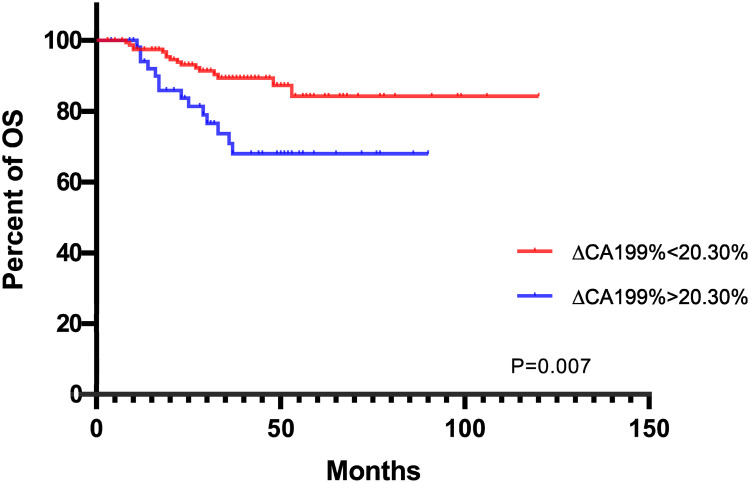
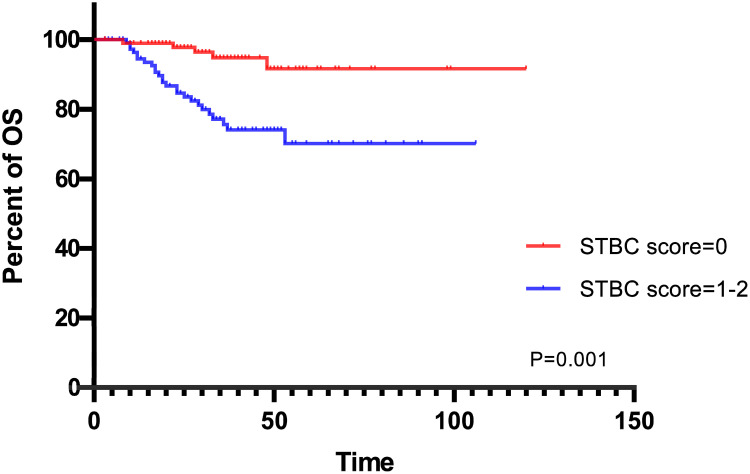
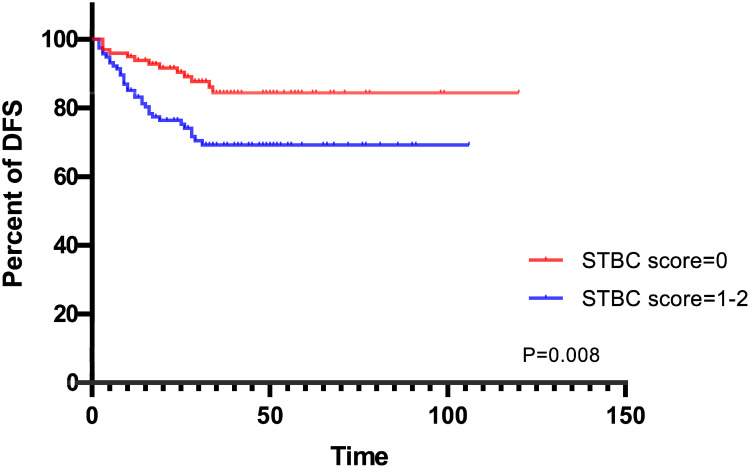
Results: The optimal cut-off point for ∆CEA% and ∆CA199% were -30.29% and 20.30%, respectively. Univariate analysis showed that ∆CEA%, ∆CA199%, STBC score, ypT staging and yN staging could predict OS. ypT staging and STBC score could predict DFS. In multivariate analysis, only ∆CA199% (HR = 0.468, 95% CI: 0.220-0.994, p = 0.048), ypT staging (HR = 0.420, 95% CI: 0.182-0.970, p = 0.042), and STBC score (HR = 0.204, 95% CI: 0.078-0.532, p = 0.001) were independently related to OS; and STBC score (HR = 0.412, 95% CI: 0.216-0.785, p=0.007) and ypT staging (HR = 0.421, 95% CI: 0.224-0.792, p = 0.007) were independently related to DFS.
Conclusion: We established a combined STBC score to predict the prognosis of stage II/III RC patients receiving NCRT followed by TME. The predictive value of the combined score was stronger than a single marker alone and even stronger than several pathological indicators.
Keywords: STBC score; neoadjuvant chemoradiotherapy; prognosis; stage II/III rectal cancer; total mesorectal excision.
© 2022 Zhao et al.
Conflict of interest statement
The authors declare that the research was conducted in the absence of any commercial or financial relationships that could be construed as a potential conflict of interest.
Figures
Similar articles
-
Predictive value of a serum tumor biomarkers scoring system for clinical stage II/III rectal cancer with neoadjuvant chemoradiotherapy.World J Gastrointest Oncol. 2022 Oct 15;14(10):2014-2024. doi: 10.4251/wjgo.v14.i10.2014. World J Gastrointest Oncol. 2022. PMID: 36310703 Free PMC article.
-
The combination of pre-neoadjuvant chemoradiotherapy inflammation biomarkers could be a prognostic marker for rectal cancer patients.Sci Rep. 2022 Mar 11;12(1):4286. doi: 10.1038/s41598-022-07726-y. Sci Rep. 2022. PMID: 35277532 Free PMC article.
-
Prognostic Value of Pretreatment Serum CA199 in Patients with Locally Advanced Rectal Cancer Treated with CRT Followed by TME with Normal Pretreatment Carcinoembryonic Antigen Levels.Dig Surg. 2021;38(1):24-29. doi: 10.1159/000508442. Epub 2020 Nov 10. Dig Surg. 2021. PMID: 33171467
-
Lateral lymph node dissection reduces local recurrence of locally advanced lower rectal cancer in the absence of preoperative neoadjuvant chemoradiotherapy: a systematic review and meta-analysis.World J Surg Oncol. 2020 Nov 23;18(1):304. doi: 10.1186/s12957-020-02078-1. World J Surg Oncol. 2020. PMID: 33228677 Free PMC article.
-
What is the role of lateral lymph node dissection in rectal cancer patients with clinically suspected lateral lymph node metastasis after preoperative chemoradiotherapy? A meta-analysis and systematic review.Cancer Med. 2020 Jul;9(13):4477-4489. doi: 10.1002/cam4.2643. Epub 2020 Apr 30. Cancer Med. 2020. PMID: 32352659 Free PMC article.
Cited by
-
Predictive Value of the Interaction between CEA and Hemoglobin in Neoadjuvant CCRT Outcomes in Rectal Cancer Patients.J Clin Med. 2023 Dec 14;12(24):7690. doi: 10.3390/jcm12247690. J Clin Med. 2023. PMID: 38137759 Free PMC article.
-
Relationship between clinical features and distant metastases in rectal cancer predicted based on a nomogram: a retrospective cohort study.Sci Rep. 2024 Dec 28;14(1):31219. doi: 10.1038/s41598-024-82595-1. Sci Rep. 2024. PMID: 39732932 Free PMC article.
-
Development and validation of nomograms based on pre-/post-operative CEA and CA19-9 for survival predicting in stage I-III colorectal cancer patients after radical resection.Front Oncol. 2024 Oct 11;14:1402847. doi: 10.3389/fonc.2024.1402847. eCollection 2024. Front Oncol. 2024. PMID: 39464705 Free PMC article.
-
Determining the optimal surgical margin using whole scene pathology and molecular surgical margin analysis in colorectal cancer radical surgery-a cross-sectional study.Transl Cancer Res. 2025 Jun 30;14(6):3532-3541. doi: 10.21037/tcr-24-1146. Epub 2025 Jun 19. Transl Cancer Res. 2025. PMID: 40687231 Free PMC article.
References
LinkOut - more resources
Full Text Sources
