

RUNX2 interacts with SCD1 and activates Wnt/β-catenin signaling pathway to promote the progression of clear cell renal cell carcinoma
- PMID: 36200301
- PMCID: PMC10028032
- DOI: 10.1002/cam4.5326
RUNX2 interacts with SCD1 and activates Wnt/β-catenin signaling pathway to promote the progression of clear cell renal cell carcinoma
Abstract
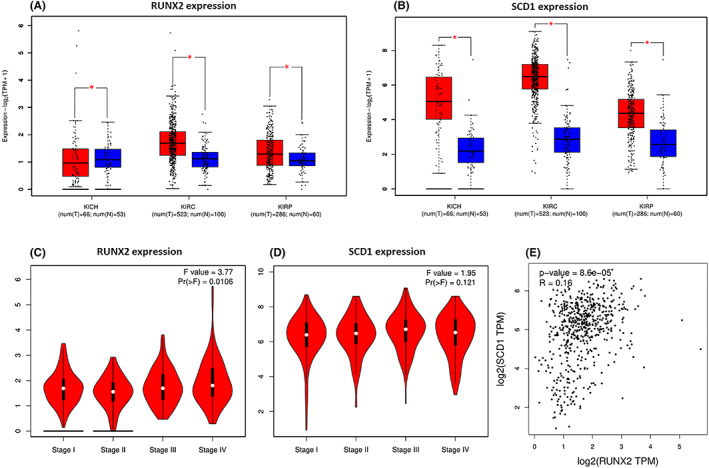
Background: Previous studies have demonstrated that Runt-associated transcription factor 2 (RUNX2) serves as the main transcription factor for osteoblast differentiation and chondrocyte maturation. RUNX2 is related to a variety of tumors, particularly tumor invasion and metastasis, while the expression and molecular mechanisms of RUNX2 in clear cell renal cell carcinoma (ccRCC) keep to be determined. Stearyl CoA desaturase 1 (SCD1), an endoplasmic reticulum fatty acid desaturase, transfers saturated fatty acids to monounsaturated fatty acids, is expressed highly in numerous malignancies.
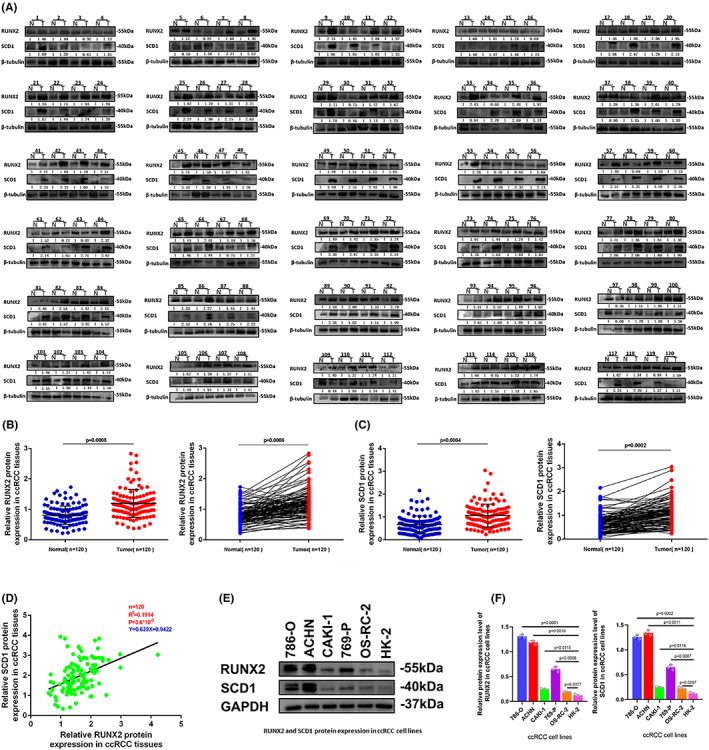
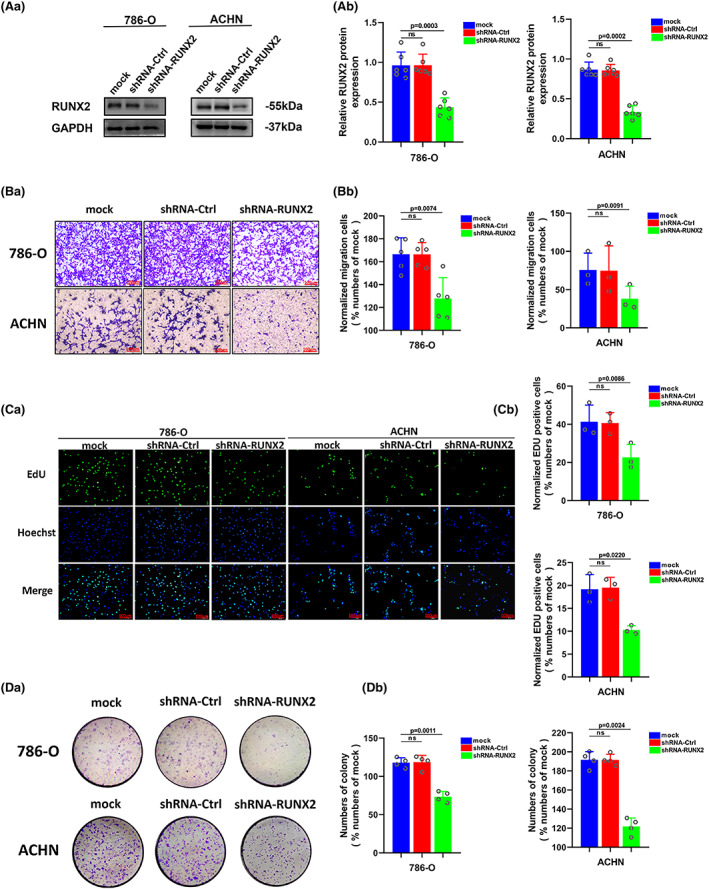
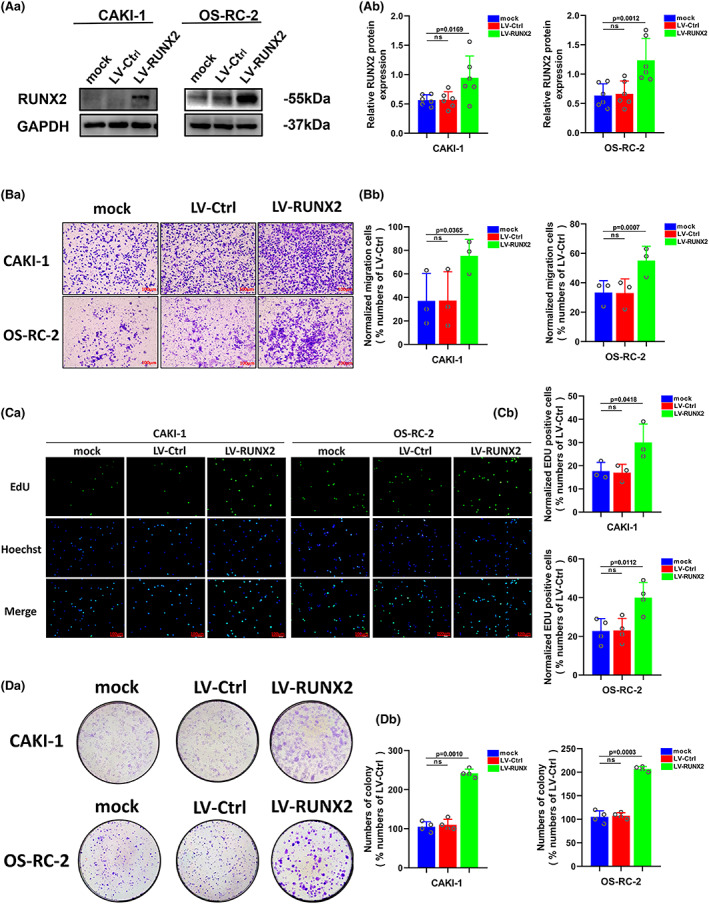
Methods: The Cancer Genome Atlas (TCGA) datebase and Western blot was used to analyzed the mRNA and protein levels of the target gene in ccRCC tissues and adjacent tissues. The proliferation ability of ccRCC cells was tested by colony forming and EdU assay. The migration ability of cells was detected by transwell assay. Immunoprecipitation was utilized to detect protein-protein interaction. Cycloheximide chase assay was used to measure the half-life of SCD1 protein.
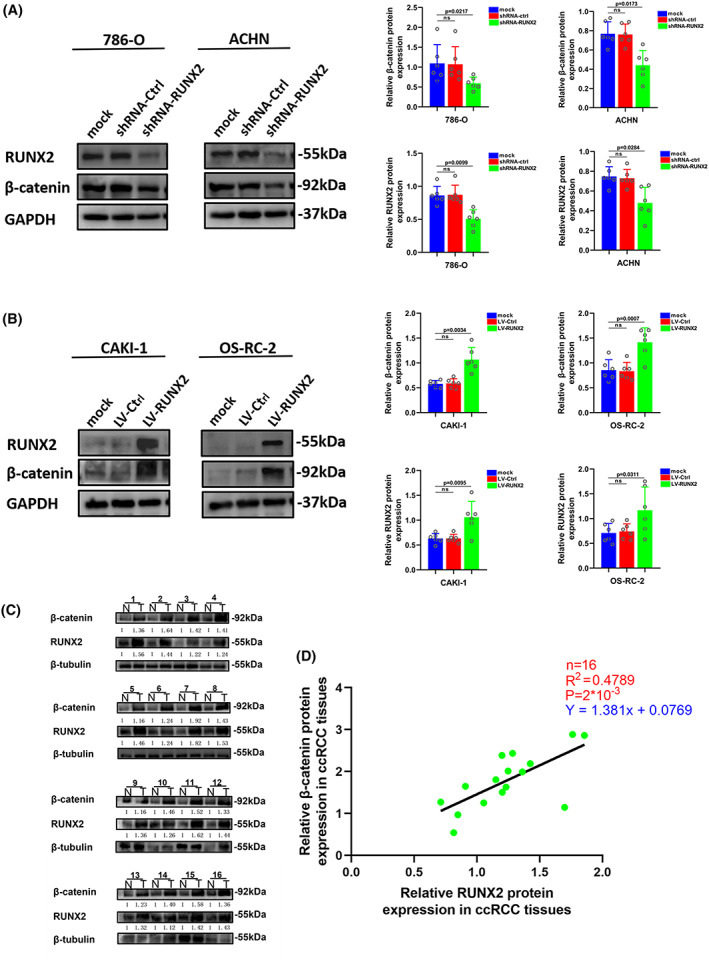
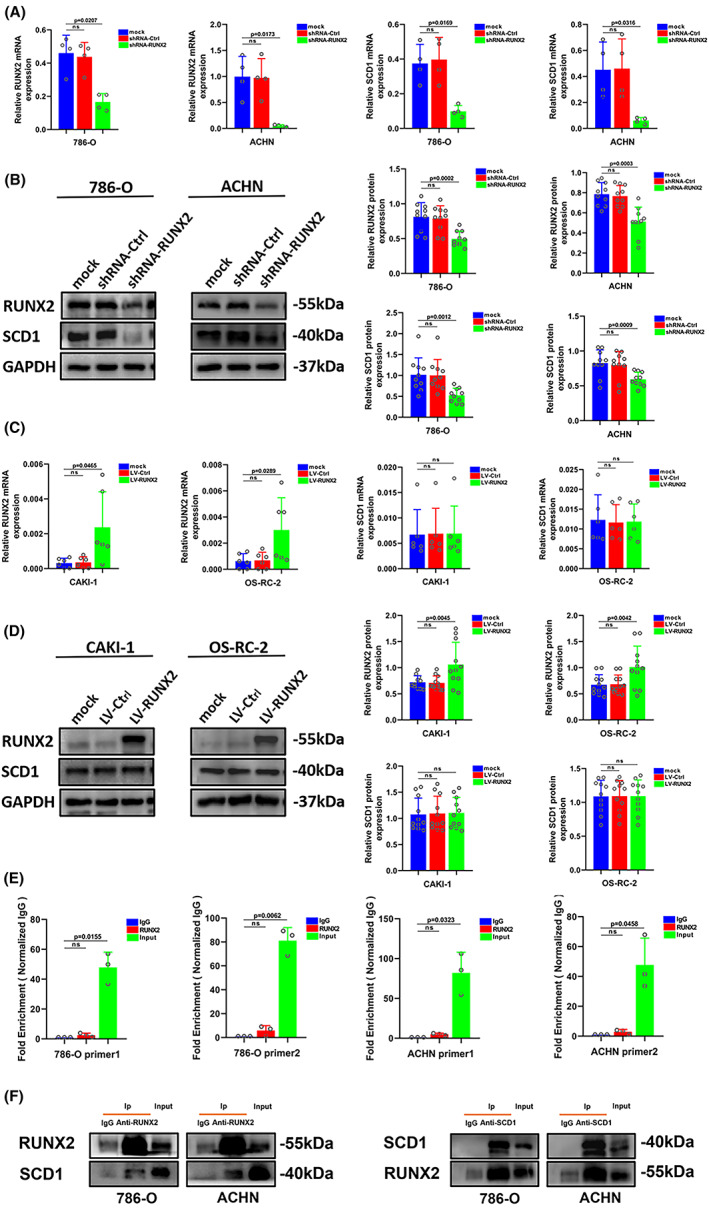
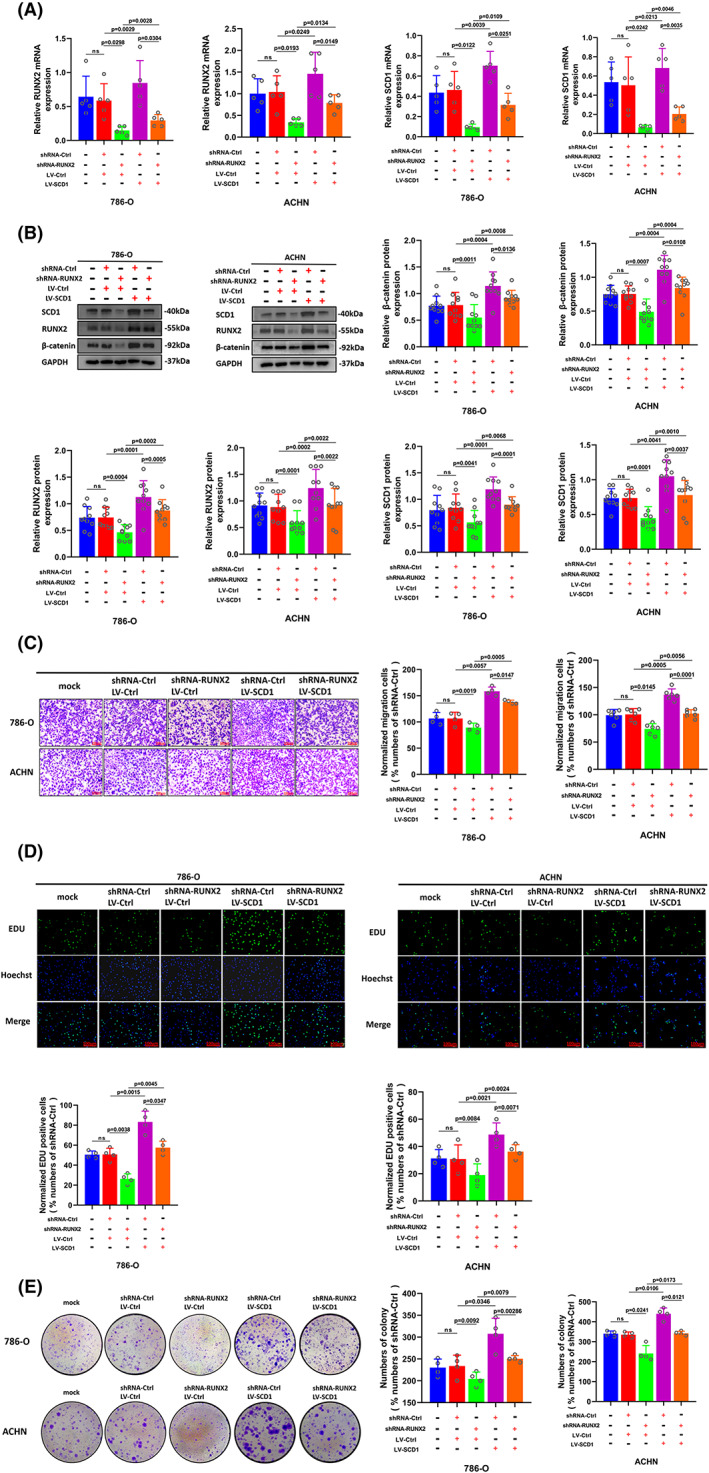
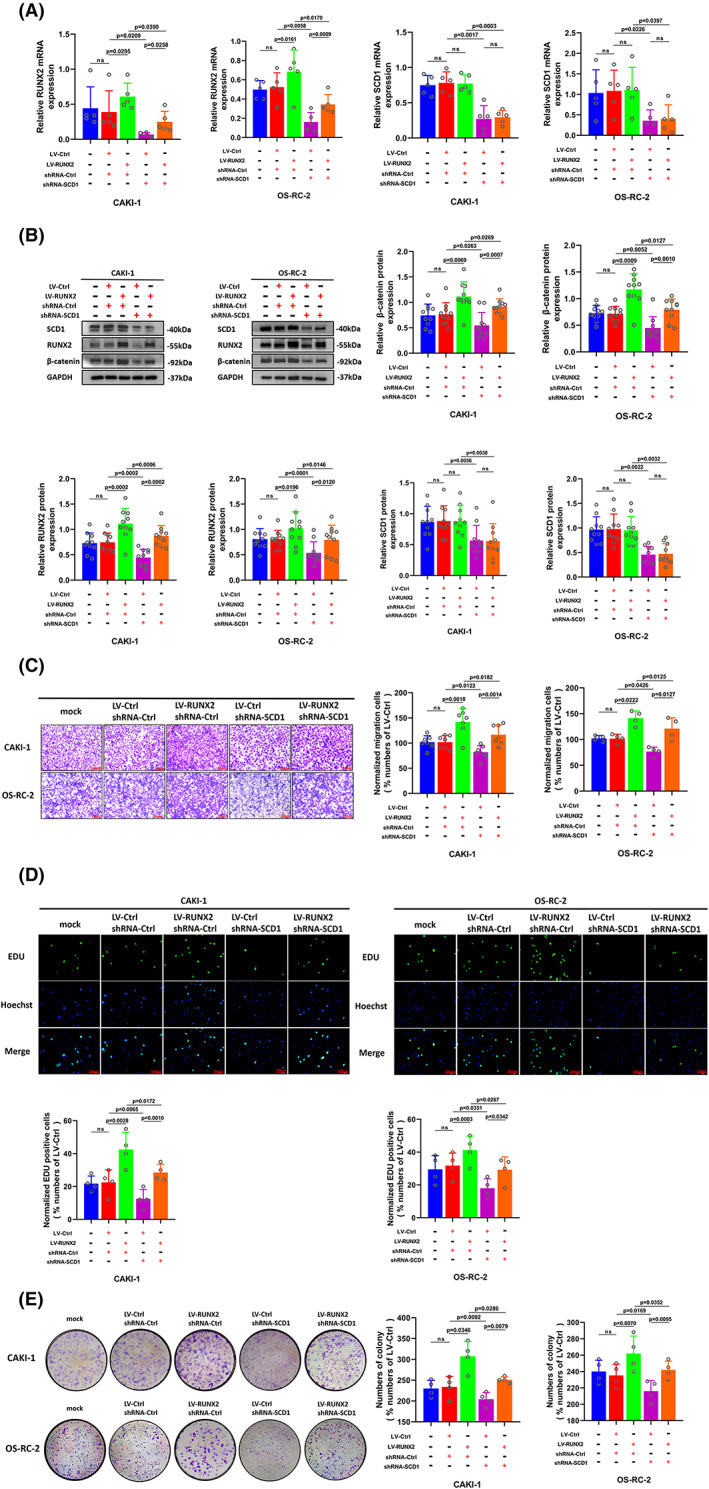
Results: In this study, the expressions of RUNX2 and SCD1 are increased in ccRCC tissues as well as ccRCC cell lines. Both RUNX2 and SCD1 could promote proliferation and migration in ccRCC cells. Furthermore, RUNX2 could physically interact with SCD1. In addition, the functional degradation and the inactivation of Wnt/β-catenin signaling pathway triggered by the downregulation of RUNX2 could be partly offset by the overexpression of SCD1.
Conclusion: The findings indicate that the RUNX2/SCD1 axis may act as a potential therapeutic target via the Wnt/β-catenin signaling pathway of ccRCC.
Keywords: Wnt/β-catenin; clear cell renal cell carcinoma; progression; runt-related transcription factor 2; stearyl CoA desaturase 1.
© 2022 The Authors. Cancer Medicine published by John Wiley & Sons Ltd.
Conflict of interest statement
The authors declare that the research was conducted in the absence of any commercial or financial relationships that could be construed as a potential conflict of interest.
Figures
Similar articles
-
Phosphorylated MAPK11 promotes the progression of clear cell renal cell carcinoma by maintaining RUNX2 protein abundance.J Cell Mol Med. 2023 Sep;27(17):2583-2593. doi: 10.1111/jcmm.17870. Epub 2023 Jul 31. J Cell Mol Med. 2023. PMID: 37525479 Free PMC article.
-
Positive feedback loop and synergistic effects between hypoxia-inducible factor-2α and stearoyl-CoA desaturase-1 promote tumorigenesis in clear cell renal cell carcinoma.Cancer Sci. 2013 Apr;104(4):416-22. doi: 10.1111/cas.12108. Epub 2013 Mar 3. Cancer Sci. 2013. PMID: 23331615 Free PMC article.
-
Stearoyl-CoA desaturase 1 is a novel molecular therapeutic target for clear cell renal cell carcinoma.Clin Cancer Res. 2013 May 1;19(9):2368-80. doi: 10.1158/1078-0432.CCR-12-3249. Epub 2013 Apr 30. Clin Cancer Res. 2013. PMID: 23633458 Free PMC article.
-
Stearoyl-CoA desaturase 1 as a therapeutic target for cancer: a focus on hepatocellular carcinoma.Mol Biol Rep. 2022 Sep;49(9):8871-8882. doi: 10.1007/s11033-021-07094-2. Epub 2022 Jul 29. Mol Biol Rep. 2022. PMID: 35906508 Review.
-
Molecular landscape of clear cell renal cell carcinoma: targeting the Wnt/β-catenin signaling pathway.Discov Oncol. 2025 Apr 14;16(1):524. doi: 10.1007/s12672-025-02228-5. Discov Oncol. 2025. PMID: 40227498 Free PMC article. Review.
Cited by
-
METTL14 Suppresses Tumor Stemness and Metastasis of Colon Cancer Cells by Modulating m6A-Modified SCD1.Mol Biotechnol. 2024 Aug;66(8):2095-2105. doi: 10.1007/s12033-023-00843-7. Epub 2023 Aug 17. Mol Biotechnol. 2024. PMID: 37592151
-
New players in the landscape of renal cell carcinoma bone metastasis and therapeutic opportunities.Int J Cancer. 2025 Feb 1;156(3):475-487. doi: 10.1002/ijc.35181. Epub 2024 Sep 22. Int J Cancer. 2025. PMID: 39306698 Free PMC article. Review.
-
Targeting Stearoyl-CoA Desaturase 1 Through PI3K-AKT-mTOR Signaling in Head and Neck Squamous Cell Carcinoma.OTO Open. 2025 Jun 19;9(2):e70143. doi: 10.1002/oto2.70143. eCollection 2025 Apr-Jun. OTO Open. 2025. PMID: 40538996 Free PMC article.
-
RUNX2 and Cancer.Int J Mol Sci. 2023 Apr 10;24(8):7001. doi: 10.3390/ijms24087001. Int J Mol Sci. 2023. PMID: 37108164 Free PMC article. Review.
-
Role of RUNX2 in breast cancer development and drug resistance (Review).Oncol Lett. 2023 Mar 15;25(5):176. doi: 10.3892/ol.2023.13762. eCollection 2023 May. Oncol Lett. 2023. PMID: 37033103 Free PMC article. Review.
References
MeSH terms
Substances
LinkOut - more resources
Full Text Sources
Medical
