. 2022 Oct;10(19):e15484.
doi: 10.14814/phy2.15484.

Modeling renal autoregulation in a hemodynamic, first-trimester gestational model

Affiliations

Modeling renal autoregulation in a hemodynamic, first-trimester gestational model

Maaike van Ochten et al. Physiol Rep. 2022 Oct.

Abstract

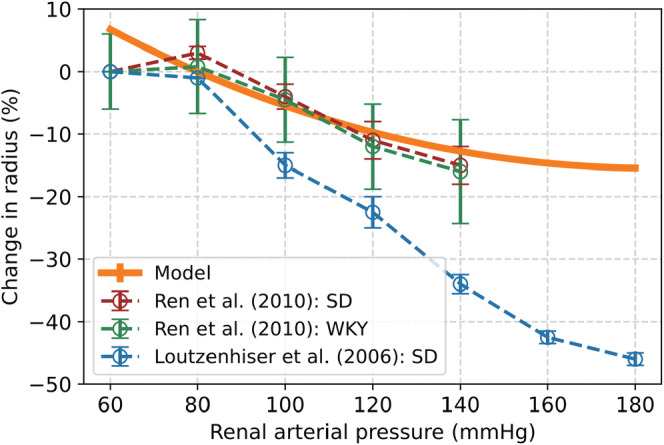
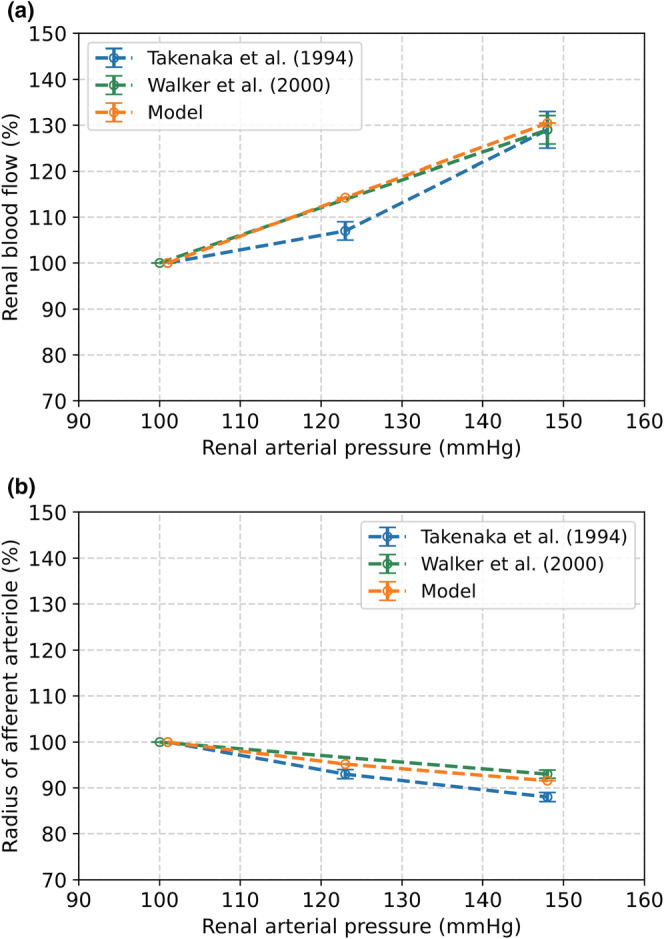
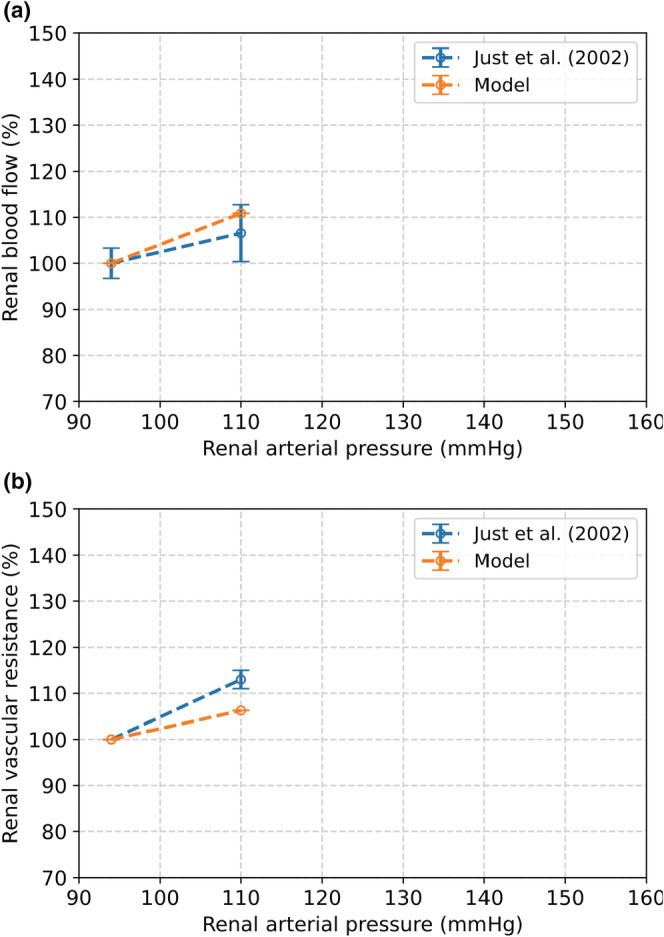
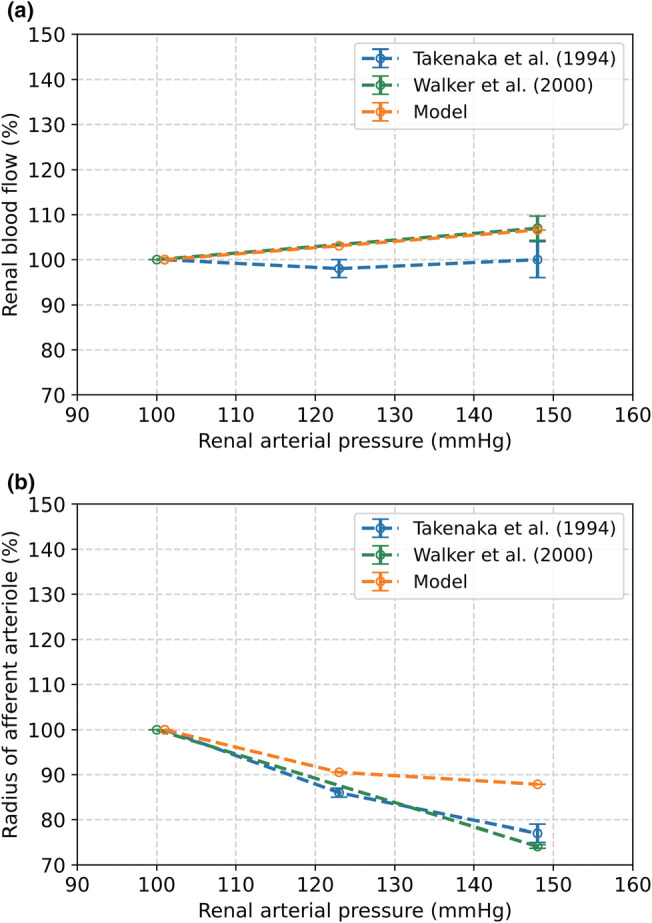
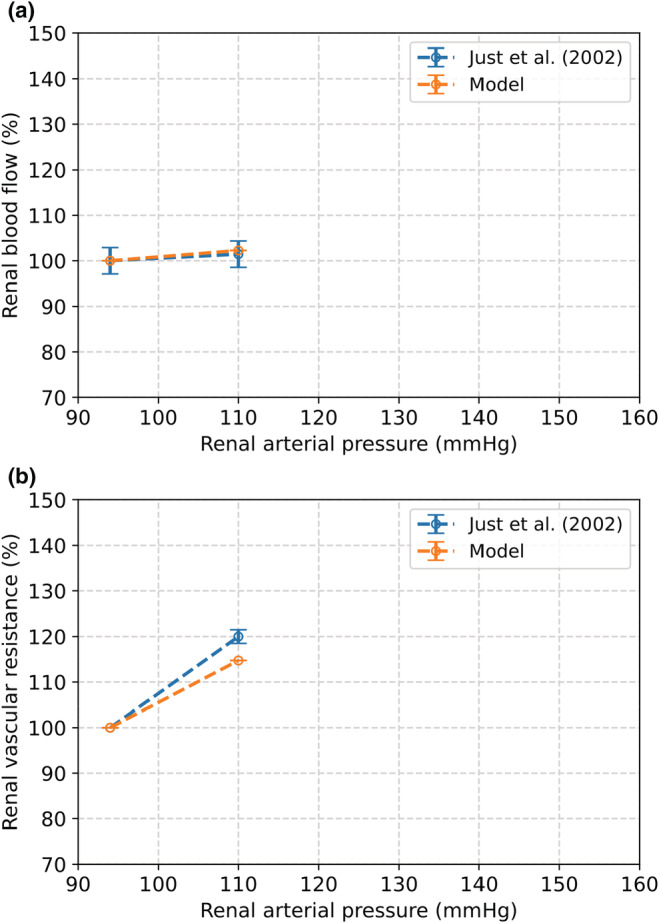
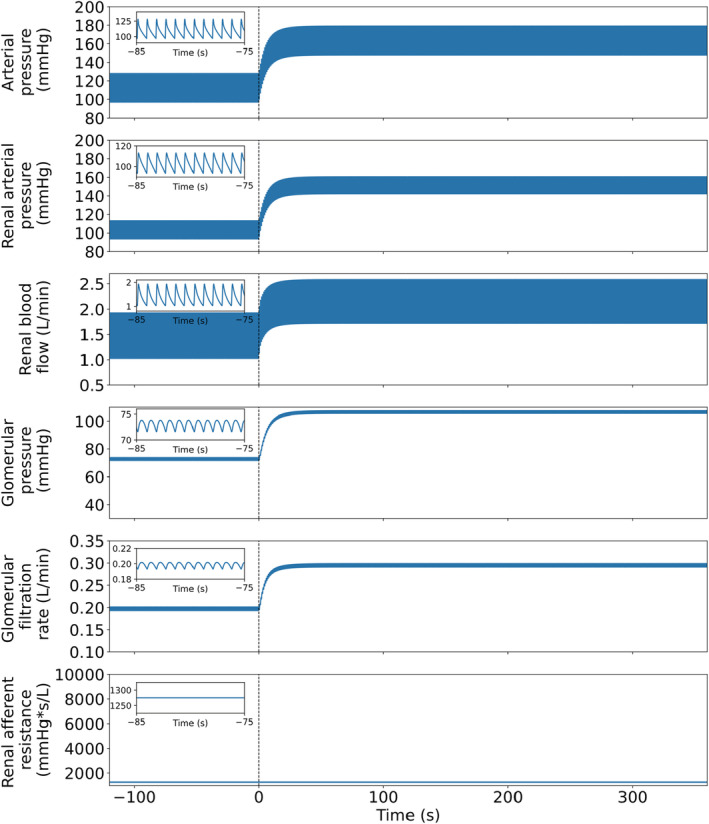
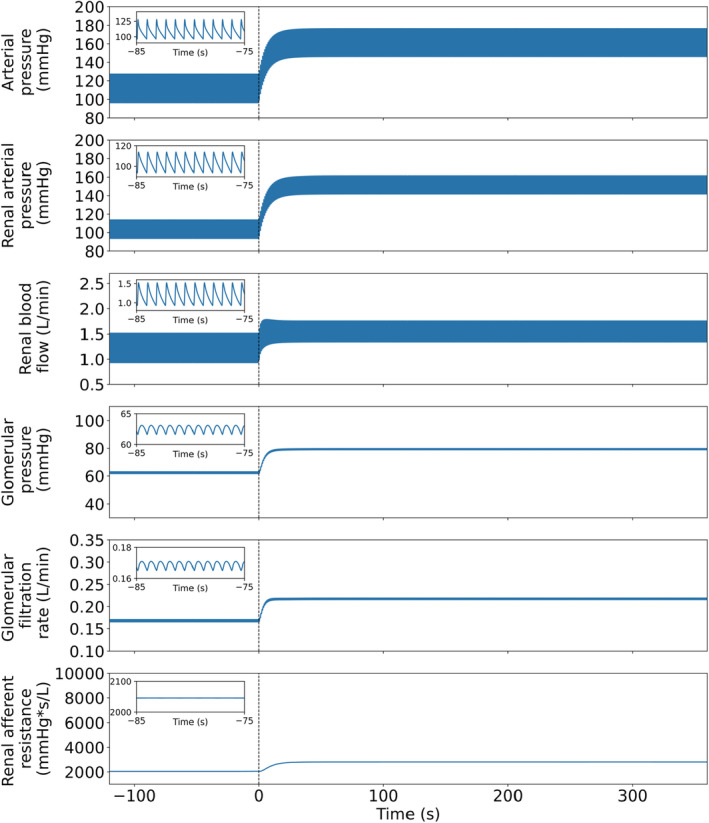
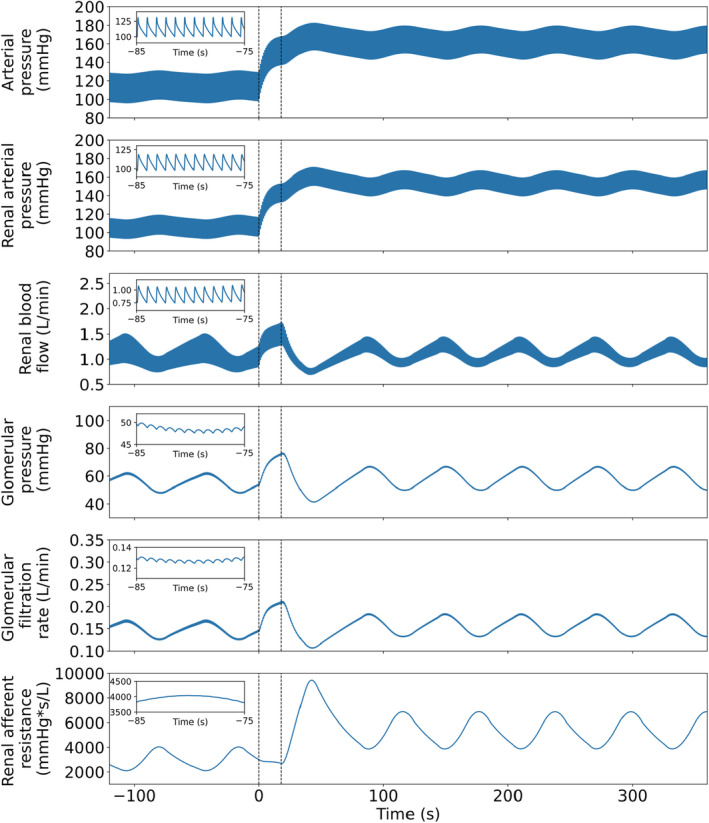
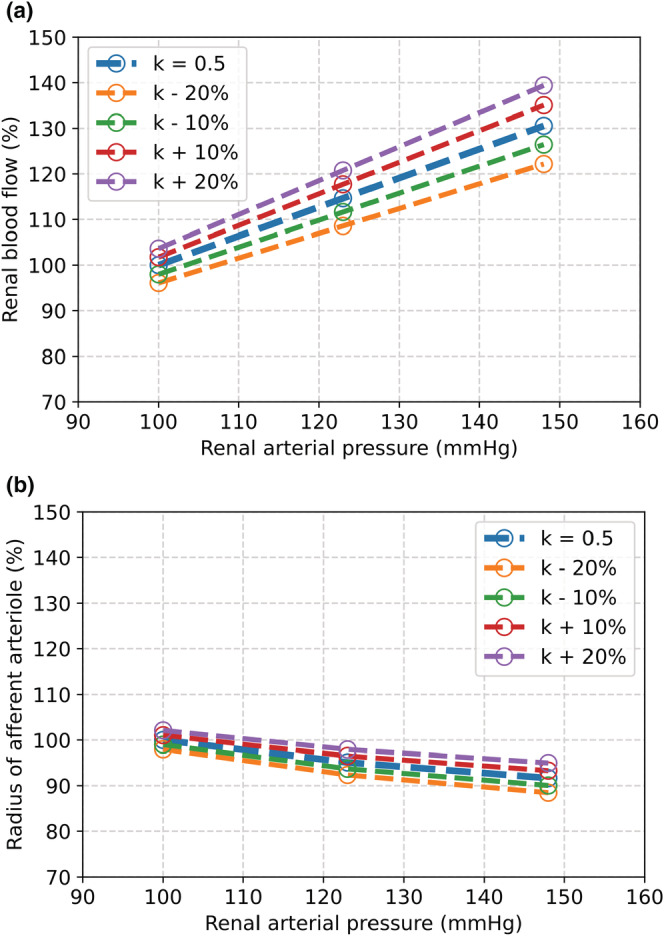
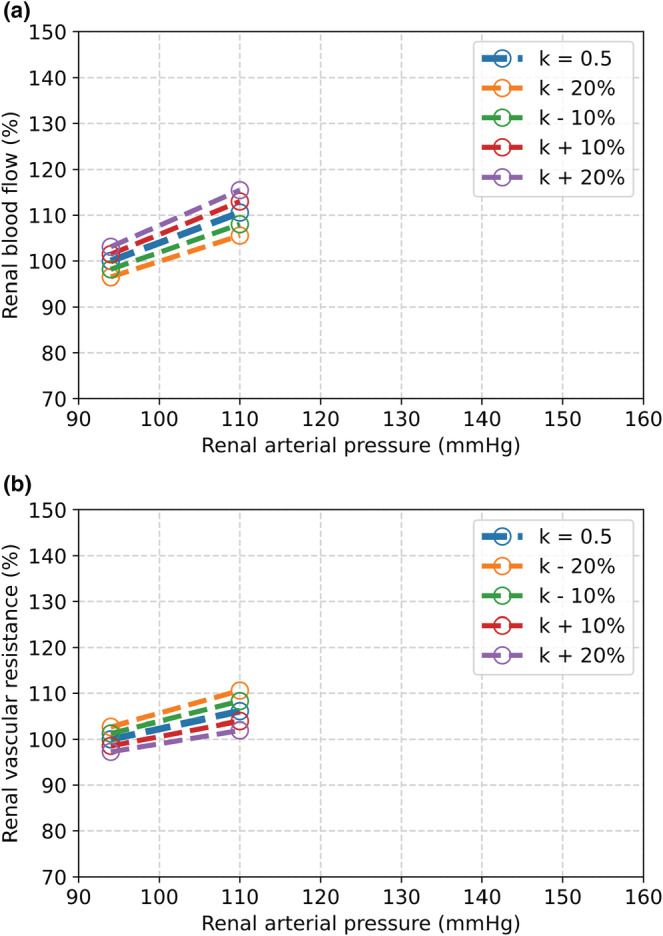
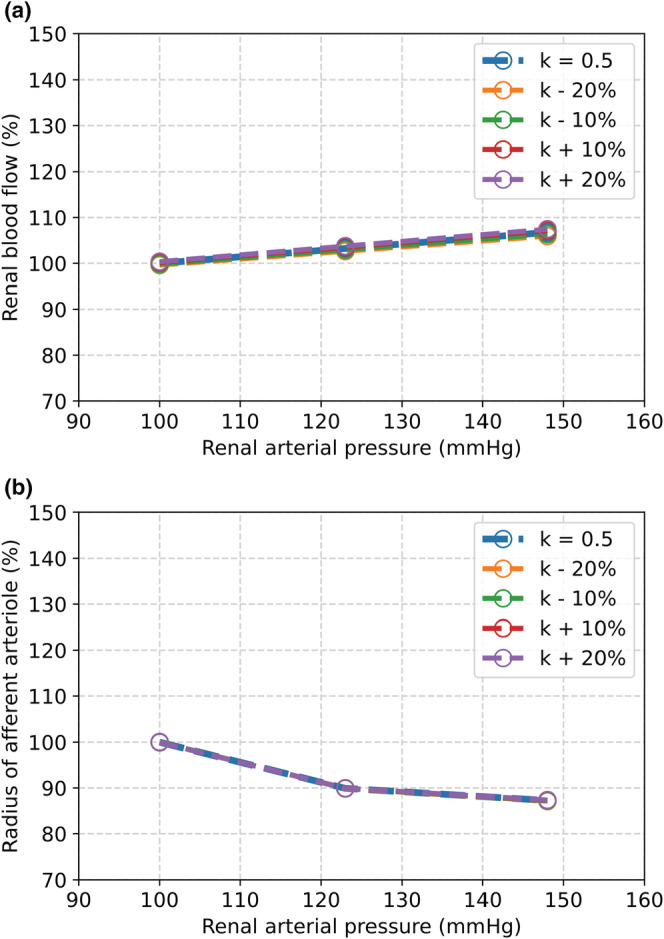
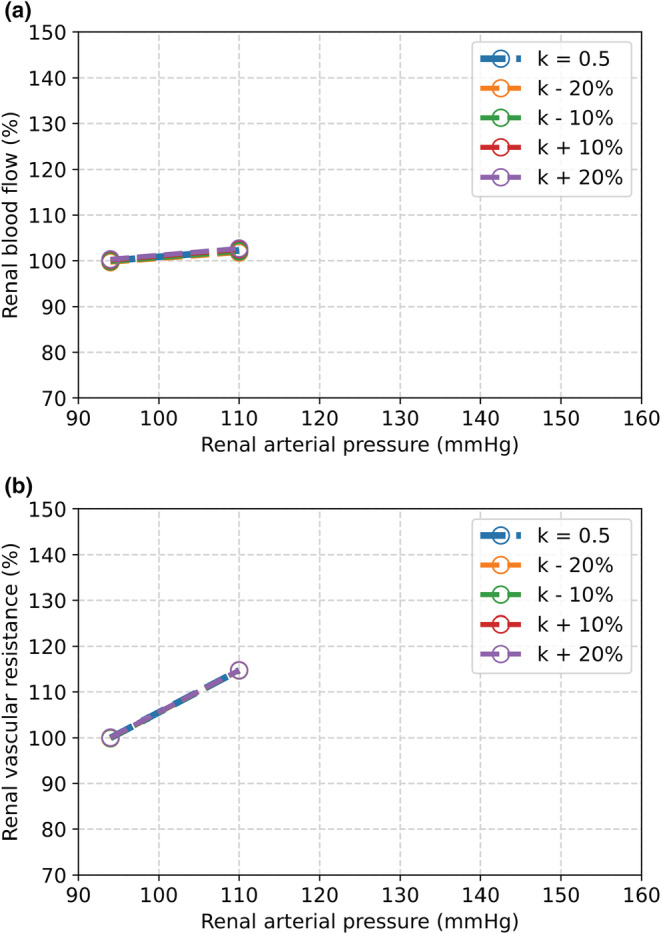
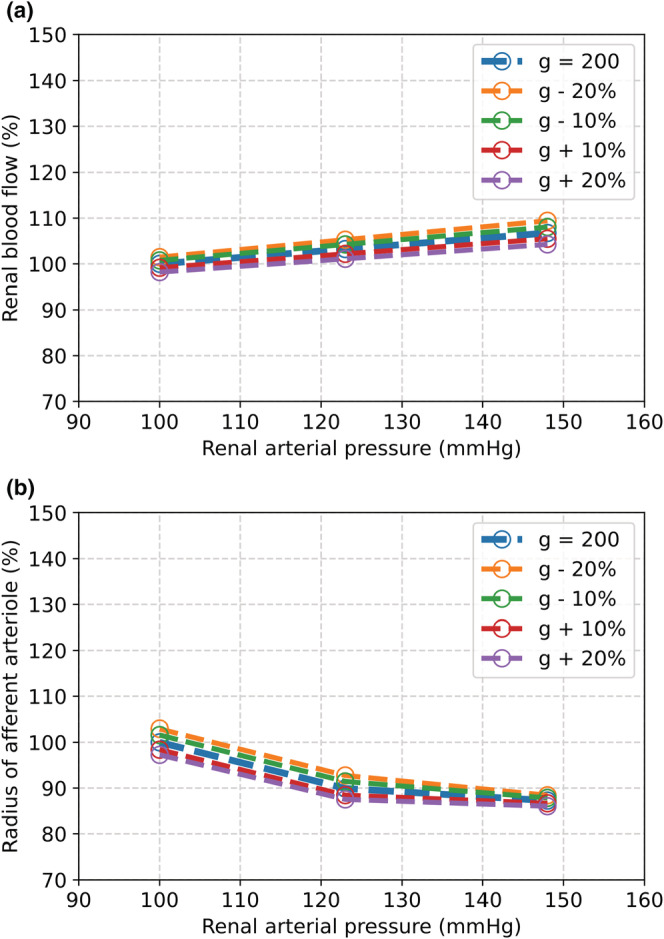
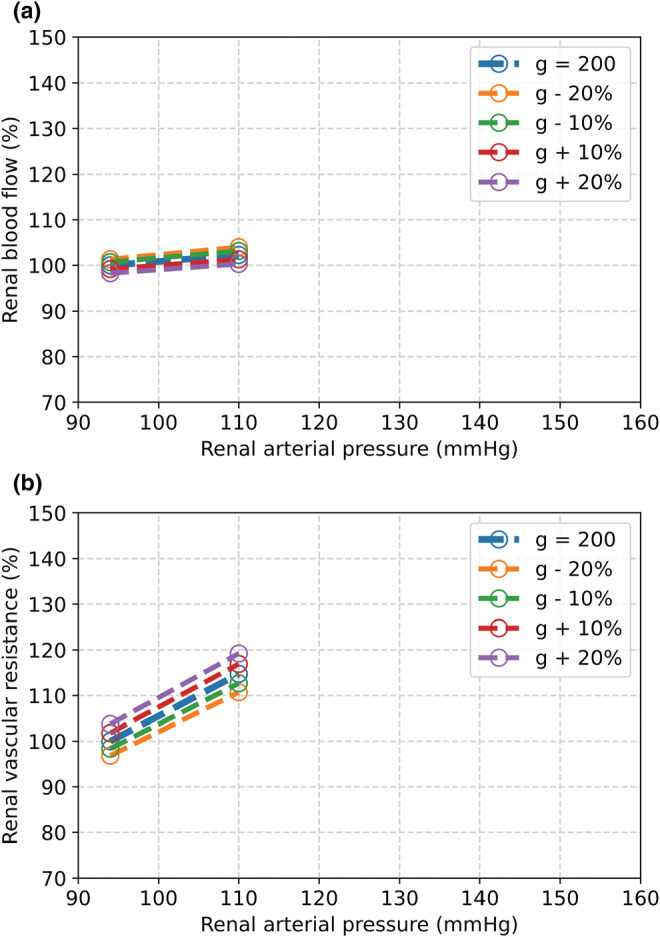
The maternal cardiovascular system, led by renal volume regulatory responses, changes during pregnancy to ensure an adequate circulation for fetal development and growth. Circulatory maladjustment predisposes to hypertensive complications during pregnancy. Mathematical models can be used to gain insight in the gestational cardiovascular physiology. In this study, we developed an accurate, robust, and transparent model for renal autoregulation implemented in an existing circulatory gestational model. This renal autoregulation model aims to maintain steady glomerular pressure by the myogenic response, and glomerular filtration rate by tubuloglomerular feedback, both by inducing a change in the radius, and thus resistance, of the afferent arteriole. The modeled response of renal blood flow and the afferent arteriole following blood pressure increase were compared to published observations in rats. With solely the myogenic response, our model had a maximum deviation of 7% in change in renal blood flow and 7% in renal vascular resistance. When both the myogenic response and tubuloglomerular feedback were concurrently activated, the maximum deviation was 7% in change in renal blood flow and 5% in renal vascular resistance. These results show that our model is able to represent renal autoregulatory behavior comparable to empirical data. Further studies should focus on extending the model with other regulatory mechanisms to understand the hemodynamic changes in healthy and complicated pregnancy.

Keywords: hemodynamic model; myogenic response; pregnancy; renal autoregulation; tubuloglomerular feedback.


Figures

FIGURE 1
FIGURE 1
The hemodynamic lumped compartment model of a pregnant woman. The model consists of the pulmonary veins (PV), left atrium (LA), left ventricle (LV), ascending aorta (AA), descending aorta (AD), upper body (UB), lower body (LB), renal arteries (AR), glomerulus (GL), renal tubule (TU), renal veins (VR), uterine arteries (UA), spiral arteries (SA), placenta (PL), uterine veins (UV), vena cava (VC), right atrium (RA), right ventricle (RV), and pulmonary arteries (PA).
FIGURE 2
FIGURE 2
Block diagrams of the complete renal autoregulation model, MR model, and TGF model. (a) Renal autoregulation model. Pressure in the renal artery (PAR) induces a change in afferent resistance through the myogenic response. Glomerular filtration rate (GFR) induces a change in afferent resistance through the tubuloglomerular feedback. (b) Myogenic response model. (c) TGF model. (PAR, pressure in renal artery compartment; Pmax, maximal pressure; RT, target resistance; ∆RMR, change in resistance by myogenic response; Rbase, baseline resistance; Raff, afferent arteriolar resistance; RBF, renal blood flow.
FIGURE 3
FIGURE 3
The autoregulatory curve for the myogenic response model.
FIGURE 4
FIGURE 4
Change in renal arterial radius over a range of blood pressure as a result of the myogenic response in different strains of rats observed by (Loutzenhiser et al., ; Ren et al., 2010) and our myogenic response model. WKY, Wistar–Kyoto; SD, Sprague–Dawley.
FIGURE 5
FIGURE 5
The effect of an increase in renal arterial blood pressure from 100 to 148 mmHg as a result from the MR model compared to observations by Walker et al. and Takenaka et al. (Walker et al., ; Takenaka et al., 1994). (a) Change in renal blood flow. (b) Change in radius of the afferent arteriole.
FIGURE 6
FIGURE 6
The effect of an increase in renal arterial blood pressure from 100 to 110 mmHg as a result from the MR model compared to observations by Just et al. (Just & Arendshorst, 2003). (a) Change in renal blood flow. (b) Change in renal vascular resistance.
FIGURE 7
FIGURE 7
The effect of an increase in renal arterial blood pressure from 100 to 148 mmHg as a result from the complete autoregulation model compared to observations by Walker et al. and Takenaka et al. (Walker et al., ; Takenaka et al., 1994). (a) Change in renal blood flow. (b) Change in radius of the afferent arteriole.
FIGURE 8
FIGURE 8
The effect of an increase in renal arterial blood pressure from 100 to 110 mmHg as a result from the complete autoregulation model compared to observations by Just et al. (Just & Arendshorst, 2003). (a) Change in renal blood flow. (b) Change in renal vascular resistance.
FIGURE B1
FIGURE B1
The dynamic behavior of renal arterial pressure, glomerular pressure, renal blood flow, glomerular filtration, and renal afferent resistance without renal autoregulation. At time t = 0 s (dashed line), mean renal arterial pressure is elevated from 100 to 148 mmHg. The subplots for the flows and pressures show small oscillations in these variables which are caused by heart rate.
FIGURE B2
FIGURE B2
The dynamic behavior of renal arterial pressure, glomerular pressure, renal blood flow, glomerular filtration, and renal afferent resistance with renal autoregulation by solely the MR. at time t = 0 s (dashed line), mean renal arterial pressure is elevated from 100 to 148 mmHg. The subplots for the flows and pressures show small oscillations in these variables which are caused by heart rate.
FIGURE B3
FIGURE B3
The dynamic behavior of renal arterial pressure, glomerular pressure, renal blood flow, glomerular filtration, and renal afferent resistance with renal autoregulation by the MR and TGF. At time t = 0 s (first dashed line), mean renal arterial pressure is elevated from 100 to 148 mmHg. Renal afferent resistance is increased by the myogenic response and tubuloglomerular feedback. TGF becomes active at t = 18 s (second dashed line). The subplots for the flows and pressures show small oscillations in these variables which are caused by heart rate.
FIGURE C1
FIGURE C1
The effect of decreasing and increasing parameter k by 10% and 20% on the results of the MR model evaluated over an increase in blood pressure from 100 to 123 and 148 mmHg. (a) Change in renal blood flow. (b) Change in radius of the afferent arteriole.
FIGURE C2
FIGURE C2
The effect of decreasing and increasing parameter k by 10% and 20% on the results of the MR model evaluated over an increase in blood pressure from 94 to 110 mmHg. (a) Change in renal blood flow. (b) Change in renal vascular resistance.
FIGURE C3
FIGURE C3
The effect of decreasing and increasing parameter k by 10% and 20% on the results of the complete renal autoregulation evaluated over an increase in blood pressure from 100 to 123 and 148 mmHg. (a) Change in renal blood flow. (b) Change in radius of the afferent arteriole.
FIGURE C4
FIGURE C4
The effect of decreasing and increasing parameter k by 10% and 20% on the results of the complete renal autoregulation evaluated over an increase in blood pressure from 94 to 110 mmHg. (a) Change in renal blood flow. (b) Change in renal vascular resistance.
FIGURE C5
FIGURE C5
The effect of decreasing and increasing parameter g TGF by 10% and 20% on the results of the complete renal autoregulation evaluated over an increase in blood pressure from 100 to 123 and 148 mmHg. (a) Change in renal blood flow. (b) Change in radius of the afferent arteriole.
FIGURE C6
FIGURE C6
The effect of decreasing and increasing parameter g TGF by 10% and 20% on the results of the complete renal autoregulation evaluated over an increase in blood pressure from 94 to 110 mmHg. (a) Change in renal blood flow. (b) Change in renal vascular resistance.

Similar articles

References

    1. Antwi, E. , Amoakoh‐Coleman, M. , Vieira, D. , Madhavaram, S. , Koram, K. , Grobbee, D. , Agyepong, I. , & Klipstein‐Grobusch, K. (2020). Systematic review of prediction models for gestational hypertension and preeclampsia. PLoS One, 15, e0230955. - PMC - PubMed
    1. Arnott, C. , Nelson, M. , Alfaro Ramirez, M. , Hyett, J. , Gale, M. , Henry, A. , Celermajer, D. S. , Taylor, L. , & Woodward, M. (2020). Maternal cardiovascular risk after hypertensive disorder of pregnancy. Heart, 106, 1927–1933. - PubMed
    1. Aukland, K. , & Oien, A. H. (1987). Renal autoregulation: Models combining tubuloglomerular feedback and myogenic response. The American Journal of Physiology, 252, F768–F783. - PubMed
    1. Avni, B. , Frenkel, G. , Shahar, L. , Golik, A. , Sherman, D. , & Dishy, V. (2010). Aortic stiffness in normal and hypertensive pregnancy. Blood Pressure, 19, 11–15. - PubMed
    1. Baylis, C. (1994). Glomerular filtration and volume regulation in gravid animal models. Bailliere's Clinical Obstetrics and Gynaecology, 8, 235–264. - PubMed

LinkOut - more resources