

Joint impact on attention, alertness and inhibition of lesions at a frontal white matter crossroad
- PMID: 36200399
- PMCID: PMC10115237
- DOI: 10.1093/brain/awac359
Joint impact on attention, alertness and inhibition of lesions at a frontal white matter crossroad
Abstract
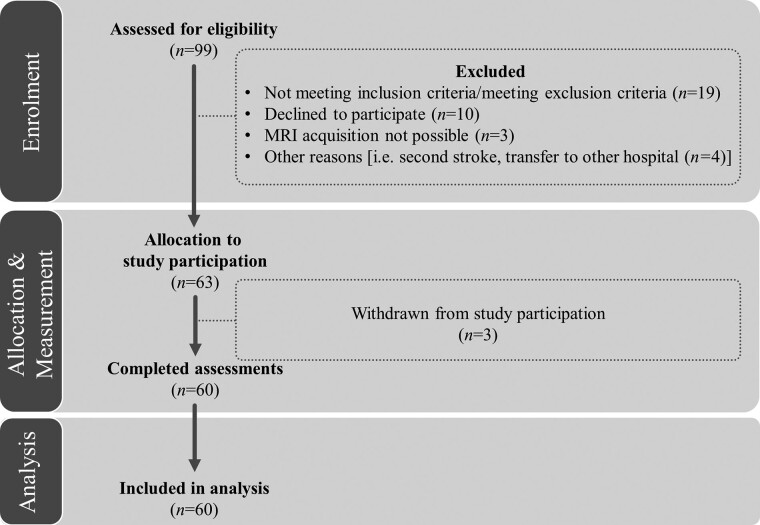
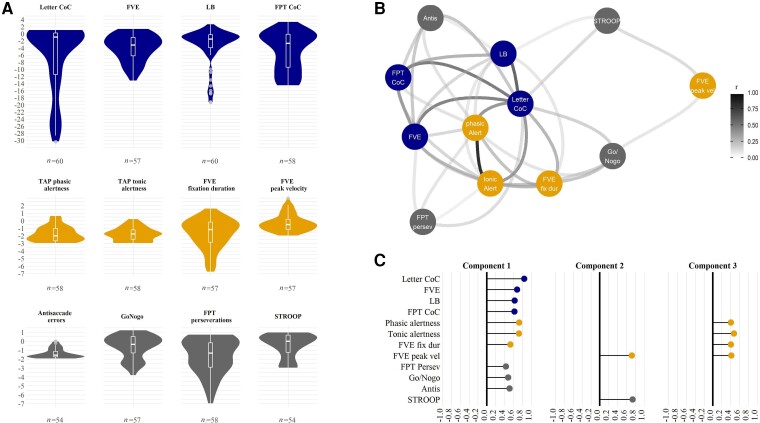
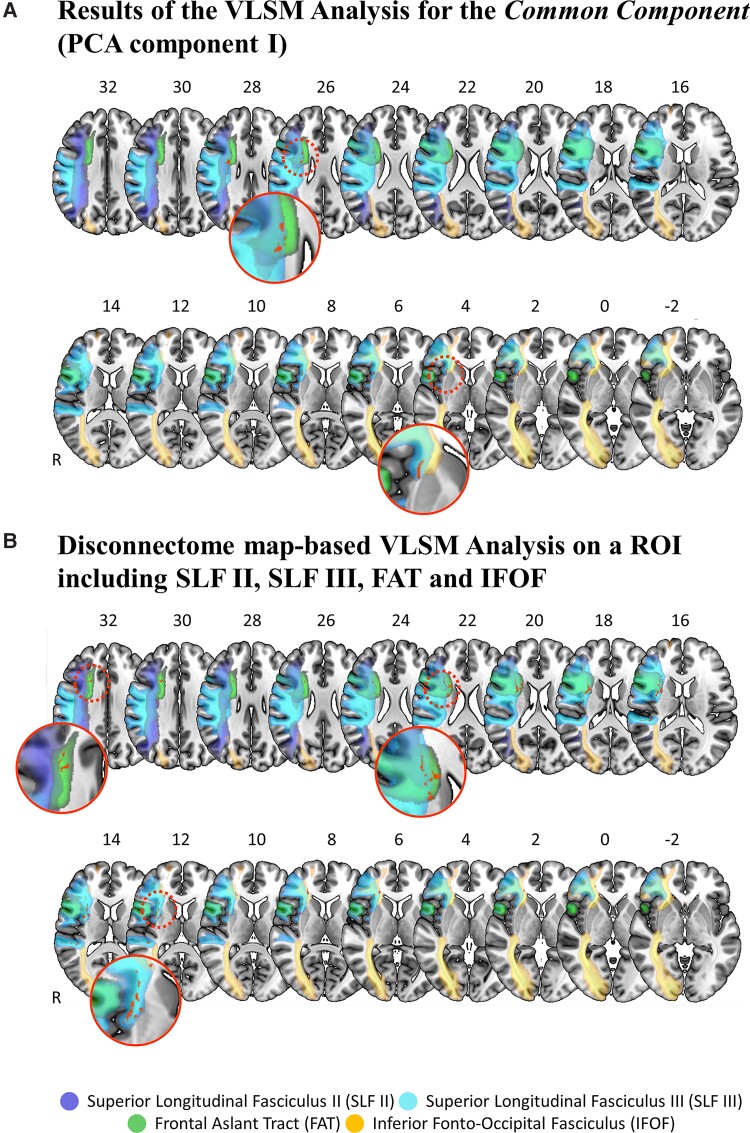
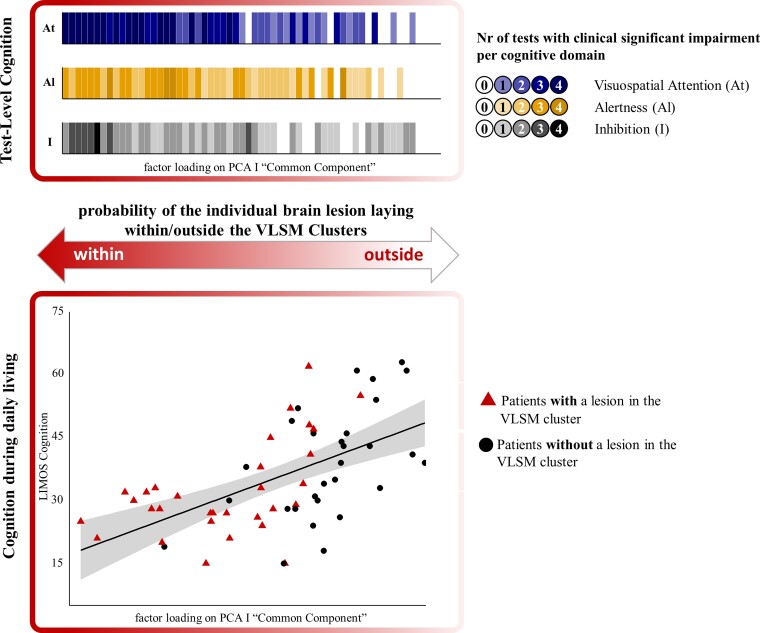
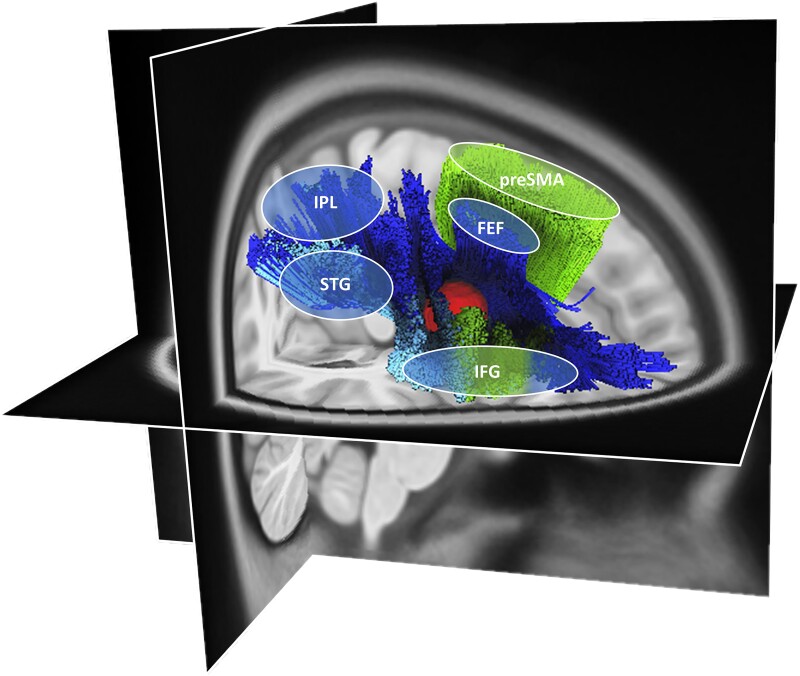
In everyday life, information from different cognitive domains-such as visuospatial attention, alertness and inhibition-needs to be integrated between different brain regions. Early models suggested that completely segregated brain networks control these three cognitive domains. However, more recent accounts, mainly based on neuroimaging data in healthy participants, indicate that different tasks lead to specific patterns of activation within the same, higher-order and 'multiple-demand' network. If so, then a lesion to critical substrates of this common network should determine a concomitant impairment in all three cognitive domains. The aim of the present study was to critically investigate this hypothesis, i.e. to identify focal stroke lesions within the network that can concomitantly affect visuospatial attention, alertness and inhibition. We studied an unselected sample of 60 first-ever right-hemispheric, subacute stroke patients using a data-driven, bottom-up approach. Patients performed 12 standardized neuropsychological and oculomotor tests, four per cognitive domain. A principal component analysis revealed a strong relationship between all three cognitive domains: 10 of 12 tests loaded on a first, common component. Analysis of the neuroanatomical lesion correlates using different approaches (i.e. voxel-based and tractwise lesion-symptom mapping, disconnectome maps) provided convergent evidence on the association between severe impairment of this common component and lesions at the intersection of superior longitudinal fasciculus II and III, frontal aslant tract and, to a lesser extent, the putamen and inferior fronto-occipital fasciculus. Moreover, patients with a lesion involving this region were significantly more impaired in daily living cognition, which provides an ecological validation of our results. A probabilistic functional atlas of the multiple-demand network was performed to confirm the potential relationship between patients' lesion substrates and observed cognitive impairments as a function of the multiple-demand network connectivity disruption. These findings show, for the first time, that a lesion to a specific white matter crossroad can determine a concurrent breakdown in all three considered cognitive domains. Our results support the multiple-demand network model, proposing that different cognitive operations depend on specific collaborators and their interaction, within the same underlying neural network. Our findings also extend this hypothesis by showing (i) the contribution of superior longitudinal fasciculus and frontal aslant tract to the multiple-demand network; and (ii) a critical neuroanatomical intersection, crossed by a vast amount of long-range white matter tracts, many of which interconnect cortical areas of the multiple-demand network. The vulnerability of this crossroad to stroke has specific cognitive and clinical consequences; this has the potential to influence future rehabilitative approaches.
Keywords: alertness; inhibition; multiple-demand network; right-hemispheric stroke; visuospatial attention.
© The Author(s) 2022. Published by Oxford University Press on behalf of the Guarantors of Brain.
Conflict of interest statement
The authors report no competing interests.
Figures
Comment in
-
Should concepts of brain functions be based on psychology or anatomy? An echo from Kurt Goldstein.Brain. 2023 Apr 19;146(4):1234-1235. doi: 10.1093/brain/awad081. Brain. 2023. PMID: 36897131 Free PMC article.
Similar articles
-
Spatial neglect after subcortical stroke may reflect cortico-cortical disconnection.Sci Rep. 2025 May 27;15(1):18544. doi: 10.1038/s41598-025-01703-x. Sci Rep. 2025. PMID: 40425643 Free PMC article.
-
Differential white matter involvement associated with distinct visuospatial deficits after right hemisphere stroke.Cortex. 2017 Mar;88:81-97. doi: 10.1016/j.cortex.2016.12.009. Epub 2016 Dec 20. Cortex. 2017. PMID: 28081452 Free PMC article.
-
White matter microstructure and verbal fluency.Brain Struct Funct. 2022 Dec;227(9):3017-3025. doi: 10.1007/s00429-022-02579-7. Epub 2022 Oct 17. Brain Struct Funct. 2022. PMID: 36251043 Free PMC article.
-
White matter tracts and executive functions: a review of causal and correlation evidence.Brain. 2024 Feb 1;147(2):352-371. doi: 10.1093/brain/awad308. Brain. 2024. PMID: 37703295 Review.
-
Integrated Intelligence from Distributed Brain Activity.Trends Cogn Sci. 2020 Oct;24(10):838-852. doi: 10.1016/j.tics.2020.06.012. Epub 2020 Aug 5. Trends Cogn Sci. 2020. PMID: 32771330 Free PMC article. Review.
Cited by
-
Severity-Dependent Interhemispheric White Matter Connectivity Predicts Poststroke Neglect Recovery.J Neurosci. 2024 May 22;44(21):e1311232024. doi: 10.1523/JNEUROSCI.1311-23.2024. J Neurosci. 2024. PMID: 38565290 Free PMC article.
-
Targeting HDAC3 Suppresses Ferroptosis and Demyelination in White Matter Injury by Restoring PDK4-Mediated Iron Homeostasis.CNS Neurosci Ther. 2025 Jun;31(6):e70471. doi: 10.1111/cns.70471. CNS Neurosci Ther. 2025. PMID: 40485011 Free PMC article.
-
Frontal and Parietal Activities Associated With Different Inhibitory Processes in a Stroop-Matching/Stop-Signal Task: A Channel-Wise fNIRS Study.Psychophysiology. 2025 Jul;62(7):e70098. doi: 10.1111/psyp.70098. Psychophysiology. 2025. PMID: 40621683 Free PMC article.
-
Meso-cortical pathway damage in cognition, apathy and gait in cerebral small vessel disease.Brain. 2024 Nov 4;147(11):3804-3816. doi: 10.1093/brain/awae145. Brain. 2024. PMID: 38709856 Free PMC article.
-
Alertness assessment by optical stimulation-induced brainwave entrainment through machine learning classification.Biomed Eng Online. 2025 Aug 12;24(1):100. doi: 10.1186/s12938-025-01422-4. Biomed Eng Online. 2025. PMID: 40797265 Free PMC article.
References
-
- Sturm W, Willmes K. On the functional neuroanatomy of intrinsic and phasic alertness. NeuroImage. 2001;14:76–84. - PubMed
-
- Thiebaut de Schotten M, Dell’Acqua F, Forkel S, et al. . A lateralized brain network for visuospatial attention. Nat Preced. 2011;14:1245–1246. - PubMed
-
- Miyake A, Friedman NP, Emerson MJ, Witzki AH, Howerter A, Wager TD. The unity and diversity of executive functions and their contributions to complex ‘frontal lobe’ tasks: A latent variable analysis. Cogn Psychol. 2000;41:49–100. - PubMed
-
- Corbetta M, Shulman G. Control of goal-directed and stimulus-driven attention in the brain. Nat Rev Neurosci. 2002;3:201–205. - PubMed
