

Recent Advances in the Enzyme-Activatable Organic Fluorescent Probes for Tumor Imaging and Therapy
- PMID: 36200519
- PMCID: PMC9535506
- DOI: 10.1002/open.202200137
Recent Advances in the Enzyme-Activatable Organic Fluorescent Probes for Tumor Imaging and Therapy
Abstract
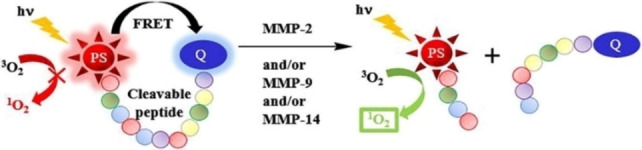
The exploration of advanced probes for cancer diagnosis and treatment is of high importance in fundamental research and clinical practice. In comparison with the traditional "always-on" probes, the emerging activatable probes enjoy advantages in promoted accuracy for tumor theranostics by specifically releasing or activating fluorophores at the targeting sites. The main designing principle for these probes is to incorporate responsive groups that can specifically react with the biomarkers (e. g., enzymes) involved in tumorigenesis and progression, realizing the controlled activation in tumors. In this review, we summarize the latest advances in the molecular design and biomedical application of enzyme-responsive organic fluorescent probes. Particularly, the fluorophores can be endowed with ability of generating reactive oxygen species (ROS) to afford the photosensitizers, highlighting the potential of these probes in simultaneous tumor imaging and therapy with rational design. We hope that this review could inspire more research interests in the development of tumor-targeting theranostic probes for advanced biological studies.
Keywords: enzyme-activatable probes; functional groups; peptide-responsive; photodynamic therapy; tumor fluorescent imaging.
© 2022 The Authors. Published by Wiley-VCH GmbH.
Conflict of interest statement
The authors declare no conflict of interest.
Figures
Similar articles
-
Activatable Multimodal Probes for In Vivo Imaging and Theranostics.Angew Chem Int Ed Engl. 2022 Dec 12;61(50):e202209512. doi: 10.1002/anie.202209512. Epub 2022 Oct 27. Angew Chem Int Ed Engl. 2022. PMID: 36151870 Review.
-
Reactive Species-Activatable AIEgens for Biomedical Applications.Biosensors (Basel). 2022 Aug 17;12(8):646. doi: 10.3390/bios12080646. Biosensors (Basel). 2022. PMID: 36005044 Free PMC article. Review.
-
Recent Advances in Photosensitizers as Multifunctional Theranostic Agents for Imaging-Guided Photodynamic Therapy of Cancer.Theranostics. 2021 Aug 26;11(18):9054-9088. doi: 10.7150/thno.62479. eCollection 2021. Theranostics. 2021. PMID: 34522227 Free PMC article. Review.
-
Polymer-based activatable optical probes for tumor fluorescence and photoacoustic imaging.Wiley Interdiscip Rev Nanomed Nanobiotechnol. 2020 Mar;12(2):e1593. doi: 10.1002/wnan.1593. Epub 2019 Oct 3. Wiley Interdiscip Rev Nanomed Nanobiotechnol. 2020. PMID: 31580007 Review.
-
Activatable NIR-II organic fluorescent probes for bioimaging.Theranostics. 2022 Apr 11;12(7):3345-3371. doi: 10.7150/thno.71359. eCollection 2022. Theranostics. 2022. PMID: 35547762 Free PMC article. Review.
Cited by
-
Progress in the Application of Fluorescent Probes for Surgical Navigation in Breast Cancer Models.ACS Omega. 2025 Jul 25;10(30):32637-32650. doi: 10.1021/acsomega.5c04607. eCollection 2025 Aug 5. ACS Omega. 2025. PMID: 40787401 Free PMC article. Review.
-
Activatable Photosensitizers: From Fundamental Principles to Advanced Designs.Angew Chem Int Ed Engl. 2025 Apr 7;64(15):e202423348. doi: 10.1002/anie.202423348. Epub 2025 Feb 21. Angew Chem Int Ed Engl. 2025. PMID: 39899458 Free PMC article. Review.
-
Theranostic Fluorescent Probes.Chem Rev. 2024 Mar 13;124(5):2699-2804. doi: 10.1021/acs.chemrev.3c00778. Epub 2024 Feb 29. Chem Rev. 2024. PMID: 38422393 Free PMC article. Review.
-
Enhanced Near-Infrared-Excitable Organic Afterglow Nanoparticles for Deep-Tissue Multimodal Imaging via Singlet Oxygen-Mediated Energy Transfer.Research (Wash D C). 2025 Aug 14;8:0834. doi: 10.34133/research.0834. eCollection 2025. Research (Wash D C). 2025. PMID: 40822121 Free PMC article.
-
Cubosomes as Delivery System to Repositioning Nitrofurantoin in Breast Cancer Management.Drug Des Devel Ther. 2024 Dec 19;18:6173-6184. doi: 10.2147/DDDT.S499068. eCollection 2024. Drug Des Devel Ther. 2024. PMID: 39722678 Free PMC article.
References
-
- Sung H., Ferlay J., Siegel R. L., Laversanne M., Soerjomataram I., Jemal A., Bray F., Ca-Cancer J. Clin. 2021, 70, 7–30. - PubMed
-
- Cardoso F., Senkus-Konefka E., Fallowfield L., Costa A., Castiglione M., Ann. Oncol. 2010, 21, v15-v19. - PubMed
-
- Luger N. M., Mach D. B., Sevcik M. A., Mantyh P. W., J. Pain Symptom Manag. 2005, 29, 32–46. - PubMed
-
- Yang K., Yang G., Chen L., Cheng L., Wang L., Ge C., Liu Z., Biomaterials 2015, 38, 1–9. - PubMed
Publication types
MeSH terms
Substances
LinkOut - more resources
Full Text Sources
Medical
