. 2023 Jan;46(1):23-44.
doi: 10.1111/pce.14453. Epub 2022 Oct 20.

A cross-scale analysis to understand and quantify the effects of photosynthetic enhancement on crop growth and yield across environments

Affiliations

A cross-scale analysis to understand and quantify the effects of photosynthetic enhancement on crop growth and yield across environments

Alex Wu et al. Plant Cell Environ. 2023 Jan.

Abstract

Photosynthetic manipulation provides new opportunities for enhancing crop yield. However, understanding and quantifying the importance of individual and multiple manipulations on the seasonal biomass growth and yield performance of target crops across variable production environments is limited. Using a state-of-the-art cross-scale model in the APSIM platform we predicted the impact of altering photosynthesis on the enzyme-limited (Ac ) and electron transport-limited (Aj ) rates, seasonal dynamics in canopy photosynthesis, biomass growth, and yield formation via large multiyear-by-location crop growth simulations. A broad list of promising strategies to improve photosynthesis for C3 wheat and C4 sorghum were simulated. In the top decile of seasonal outcomes, yield gains were predicted to be modest, ranging between 0% and 8%, depending on the manipulation and crop type. We report how photosynthetic enhancement can affect the timing and severity of water and nitrogen stress on the growing crop, resulting in nonintuitive seasonal crop dynamics and yield outcomes. We predicted that strategies enhancing Ac alone generate more consistent but smaller yield gains across all water and nitrogen environments, Aj enhancement alone generates larger gains but is undesirable in more marginal environments. Large increases in both Ac and Aj generate the highest gains across all environments. Yield outcomes of the tested manipulation strategies were predicted and compared for realistic Australian wheat and sorghum production. This study uniquely unpacks complex cross-scale interactions between photosynthesis and seasonal crop dynamics and improves understanding and quantification of the potential impact of photosynthesis traits (or lack of it) for crop improvement research.

Keywords: APSIM; crop growth modelling; crop production; cross-scale model; electron transport-limited photosynthesis; enzyme-limited photosynthesis; yield improvement.


Figures

Figure 1
Figure 1
Overview of the leaf photosynthetic pathways and manipulation targets used in wheat and sorghum crop growth and yield simulations. The manipulation targets are numbered here and detailed in Table 1. Bioengineering strategy ‘1, 2’ encompasses ‘1.1’, ‘1.2’, ‘1.3’, ‘1.4’ and ‘2’. Strategy ‘9’ is achieved by stacking ‘2’, ‘3’ and ‘7’. Graphics for stomatal and mesophyll resistance/conductance are omitted in the single‐cell CCM and C4 photosynthesis pathways for simplicity. C i, C c, C m, Cx and C s are the intercellular, chloroplastic, mesophyll, carboxysomal and bundle sheath CO2 partial pressures; CA, carbonic anhydrase; g bs, bundle sheath conductance; g m, mesophyll conductance.
Figure 2
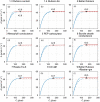
Figure 2
Simulated C3 wheat leaf photosynthetic response to intercellular CO2 (A–C i) for the baseline and manipulated scenarios. A–C i are simulated for 25°C with photosynthetic photon flux density of 1800 μmol m–2 s–1 using the C3 and single‐cell CCM photosynthesis model parameter values given in Supporting Information: Table S5. Panels are for the different leaf photosynthetic manipulations as described in Table 1. The baseline A–C i is reproduced in every panel as dashed lines; solid lines are A–C i with photosynthetic manipulation. Blue and red are Rubisco activity (A c) and electron transport (A j) limited A, respectively. Unfilled and filled circles are A at an ambient CO2 of 400 μbar (i.e., intercellular CO2 of 280 μbar) for the baseline and with manipulations, respectively. The value of the baseline A is indicated in Panel (a); the manipulated A is given in all panels. (a–c) relate to Rubisco function manipulations, (d–f) relate to CO2 delivery manipulations, and (g–h) relate to electron transport chain manipulations, (i) a combination of the three aspects. Details of the manipulations are given in Table 1.
Figure 3
Figure 3
Simulated C4 sorghum leaf A–C i for the baseline and manipulated scenarios. A–C i is simulated for 30°C with photosynthetic photon flux density of 1800 μmol m–2 s–1 using the C4 sorghum photosynthesis model parameter values given in Supporting Information: Table S5. Lines and symbols are the same as those described in Figure 2.
Figure 4
Figure 4
Predicted wheat crop attributes dynamics, and environmental variables over a sample crop cycle. Results are from a medium‐yielding year at the Dalby site with the medium sowing date and starting soil water (Supporting Information: Table S4). (a) Cumulative crop biomass and yield. (b) Canopy leaf area index, solar radiation, and interception. (c) Potential crop water demand is shown by the bars, which is made up of a fraction that is met by supply from soil water uptake by roots (i.e., actual water use) and a fraction that is not met (red bars). (d) Photosynthetic parameters for the uppermost leaves of the canopy at 25°C and the maximum air temperature during the day. (e) Soil N supply and crop N status including specific leaf nitrogen and N in grains. (f) Plant extractable soil water and a crop water stress factor; a value of 1 means all crop water demand is being met, while 0 means no water is available. (g) Daily canopy photosynthesis; each peak is made up of a histogram of total canopy photosynthesis on an hourly timestep over one diurnal period. An equivalent figure for sorghum is shown in Supporting Information: Figure S4. BIOshootDAY, daily shoot biomass growth; Radn, daily incident solar radiation, RadIntDcapst, daily intercepted radiation by the whole canopy; LAI, leaf area index; sLAI, senescenced LAI; Ecan, actual crop water use; EcanShort, fraction of the potential demand not met by supply; VPDday, indicative daytime vapour pressure deficit; Vcmax_top25, Vpmax_top25, Jmax_top25 are the values of the maximum rate of Rubisco carboxylation, maximum rate of PEP carboxylation, and maximum rate of electron transport at infinite light at 25°C; Vcmax_topT, Vpmax_topT, Jmax_topT are those photosynthetic parameter values calculated using the maximum temperature of the day (MaxT); SLNav, canopy‐average specific leaf nitrogen; esw, plant extractable soil water; swdef_photo, a crop water stress factor given by EcanFilled divided by the sum of EcanFilled and ECanShort; Ac_sun and Aj_sun, Rubisco activity and electron transport limited gross CO2 assimilation rate of the sunlit fraction of the canopy (only the lower of the two limitations is shown); Ac_sh and Aj_sh, the same limitations for the shaded fraction.
Figure 5
Figure 5
Predicted change in wheat yield (t/ha) relative to the baseline simulations for leaf photosynthetic manipulations. Panels give results for the different manipulation strategies (Table 1); results are plotted together for the six contrasting sites across the Australian wheat belt. This focused set of simulations uses representative seasonal weather data sampled from the past 120 years (1900–2020), the medium sowing date, and plant available water at sowing specific for each site (Supporting Information: Table S4). The dashed lines indicate the 10th and 90th percentile regressions for ∆yield versus baseline yield. Their slopes indicate the upper and lower percentage yield changes (n = 1440 crop cycles per panel; 720 baseline and 720 with manipulation).
Figure 6
Figure 6
Same as for Figure 5 for predicted sorghum yield changes. Results are plotted together for the four contrasting sites across sorghum production regions (n = 960 crop cycles per panel).
Figure 7
Figure 7
Predicted percentage change in Australia‐wide (a) wheat and (b) sorghum production associated with leaf photosynthetic manipulations (Table 1). This expanded set of simulations uses representative seasonal weather data sampled from the past 120 years, three representative levels of each sowing date, and starting soil water specific for each site (Supporting Information: Table S4). Median values are given by bars. Whiskers show the first and third quartile values, which are calculated using the corresponding quartile values from all production sites (wheat: n = 12,960 crop cycles per bar; sorghum: n = 8640 crop cycles per bar).

References

    1. Ababaei, B. & Chenu, K. (2020) Heat shocks increasingly impede grain filling but have little effect on grain setting across the Australian Wheatbelt. Agricultural and Forest Meteorology, 284, 107889.
    1. Ainsworth, E.A. & Long, S.P. (2021) 30 years of free‐air carbon dioxide enrichment (FACE): what have we learned about future crop productivity and its potential for adaptation? Global Change Biology, 27, 27–49. - PubMed
    1. Bernacchi, C.J. , Portis, A.R. , Nakano, H. , von Caemmerer, S. & Long, S.P. (2002) Temperature response of mesophyll conductance. Implications for the determination of Rubisco enzyme kinetics and for limitations to photosynthesis in vivo. Plant Physiology, 130, 1992–1998. - PMC - PubMed
    1. Boyd, R.A. , Gandin, A. & Cousins, A.B. (2015) Temperature responses of C4 photosynthesis: biochemical analysis of Rubisco, phosphoenolpyruvate carboxylase, and carbonic anhydrase in Setaria viridis . Plant Physiology, 169, 1850–1861. - PMC - PubMed
    1. Brown, H.E. , Huth, N.I. , Holzworth, D.P. , Teixeira, E.I. , Zyskowski, R.F. & Hargreaves, J.N.G. et al. (2014) Plant modelling framework: software for building and running crop models on the APSIM platform. Environmental Modelling & Software, 62, 385–398.

LinkOut - more resources