. 2022 Oct 26;13(5):e0237522.
doi: 10.1128/mbio.02375-22. Epub 2022 Oct 6.

Spontaneous Prophage Induction Contributes to the Production of Membrane Vesicles by the Gram-Positive Bacterium Lacticaseibacillus casei BL23

Affiliations

Spontaneous Prophage Induction Contributes to the Production of Membrane Vesicles by the Gram-Positive Bacterium Lacticaseibacillus casei BL23

David da Silva Barreira et al. mBio. .

Abstract

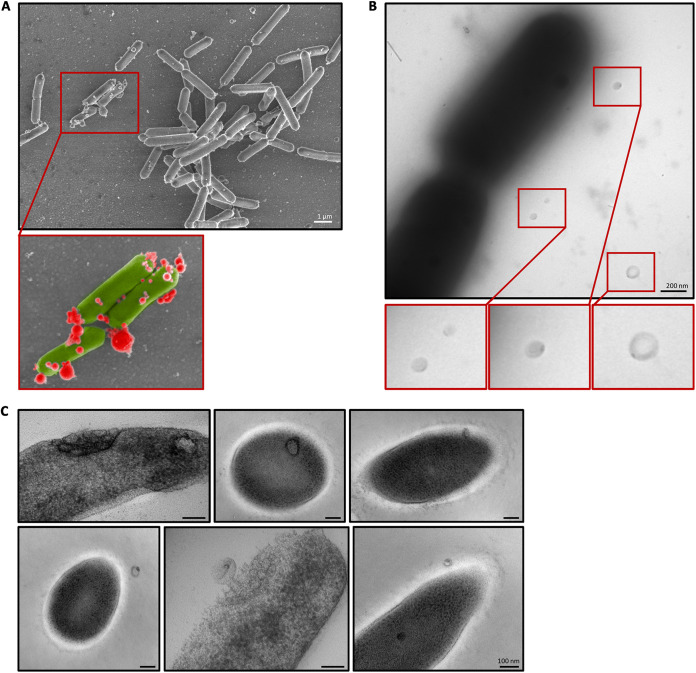
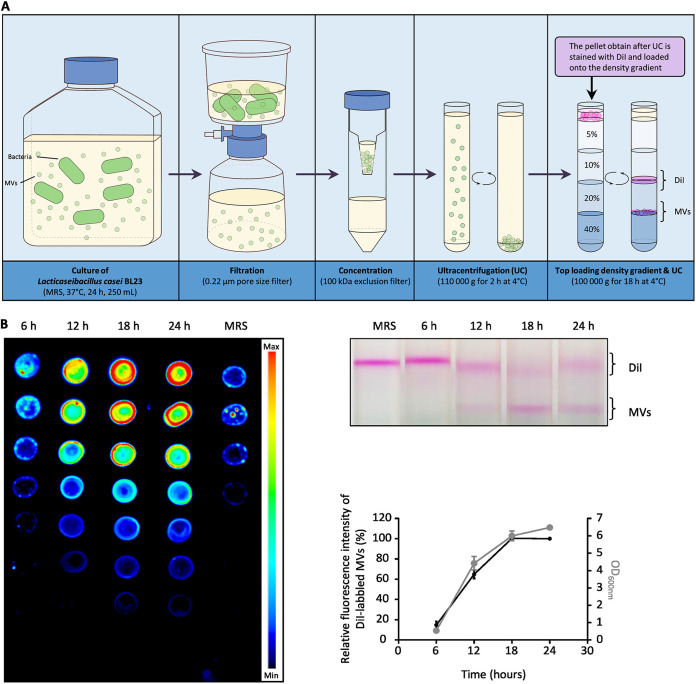
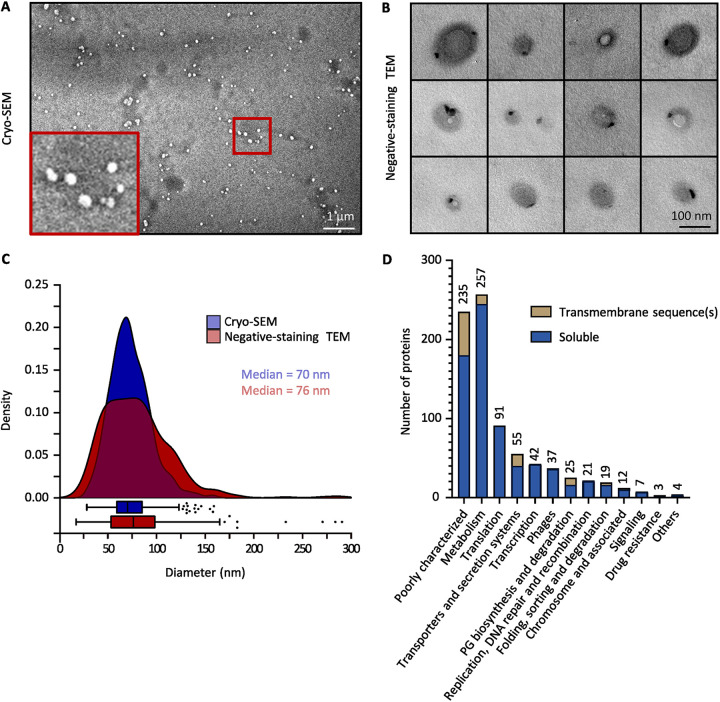
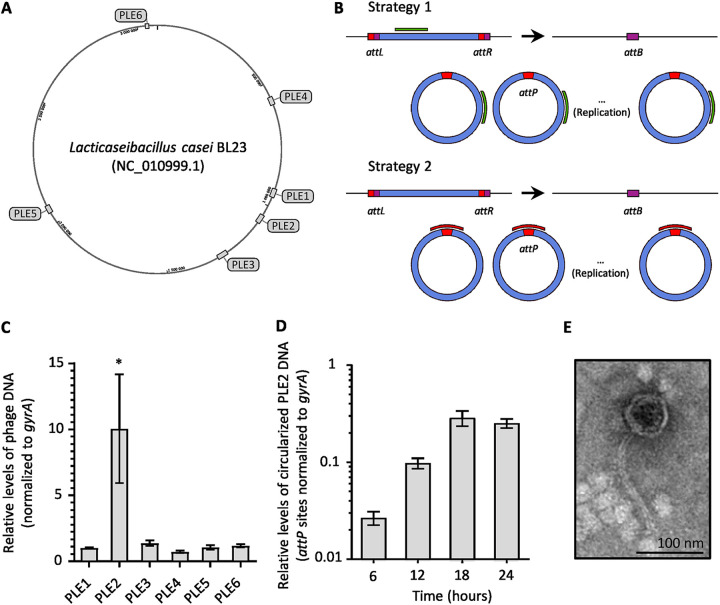
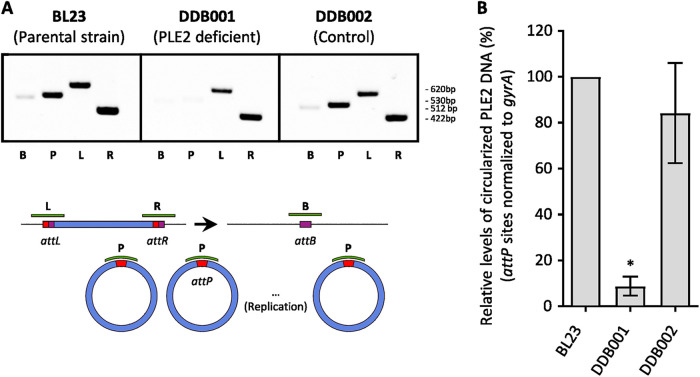
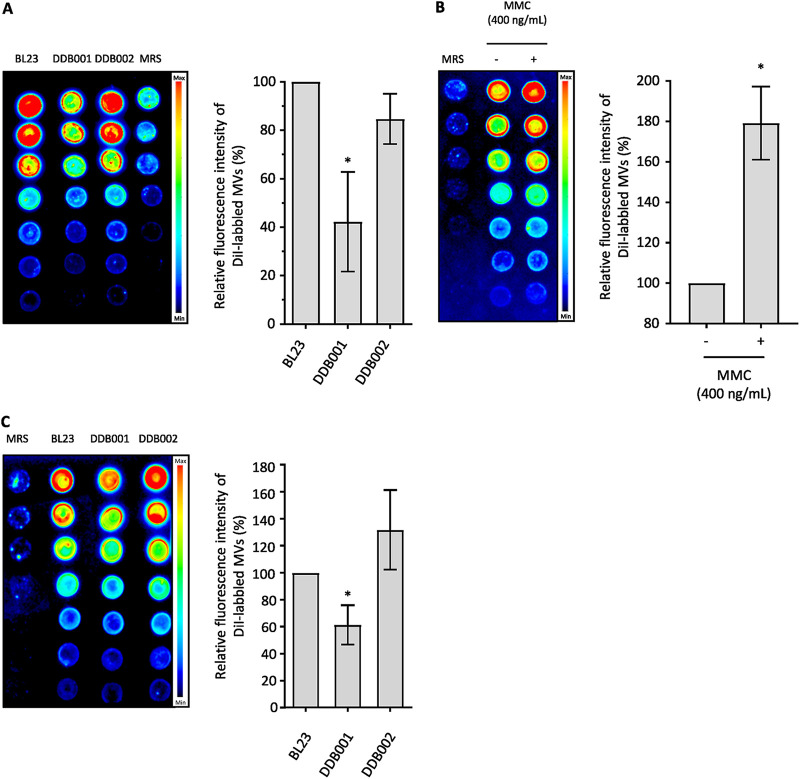
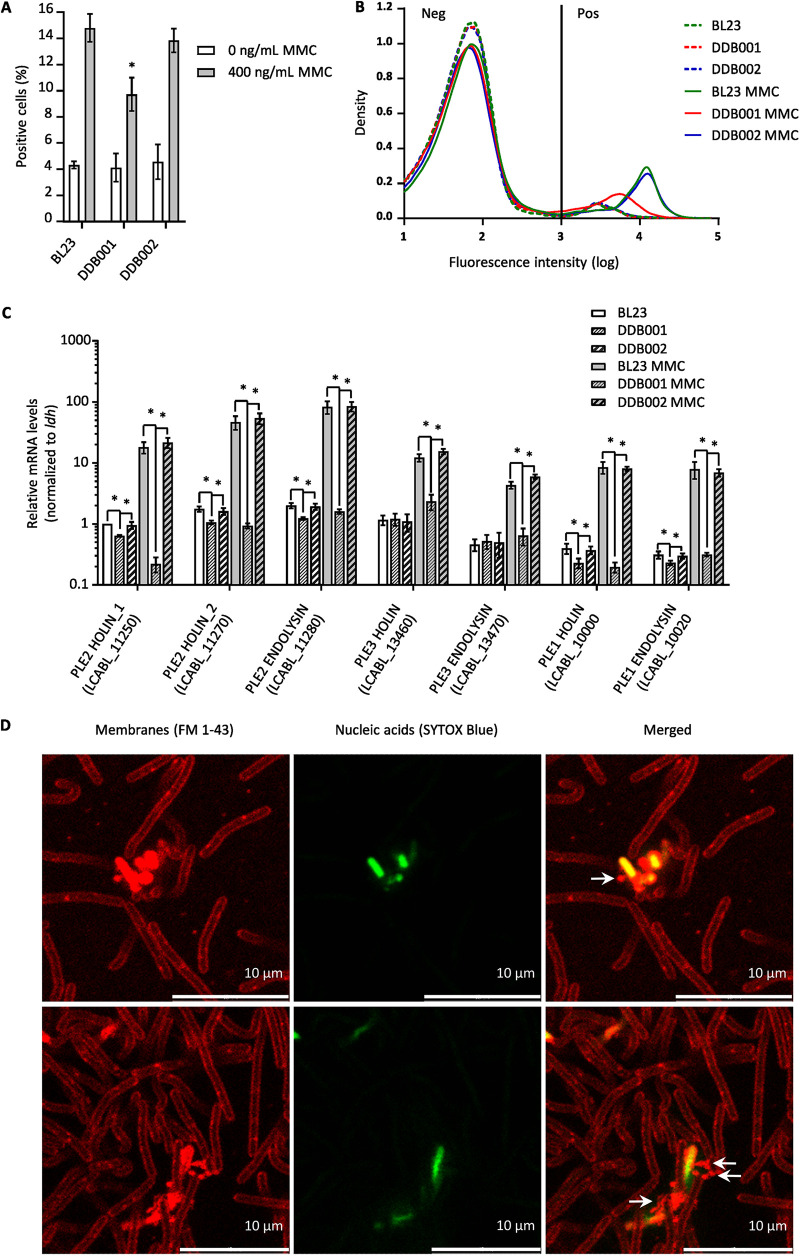
The formation of membrane vesicles (MVs) by Gram-positive bacteria has gained increasing attention over the last decade. Recently, models of vesicle formation have been proposed and involve the digestion of the cell wall by prophage-encoded or stress-induced peptidoglycan (PG) hydrolases and the inhibition of PG synthesis by β-lactam antibiotics. The impact of these mechanisms on vesicle formation is largely dependent on the strain and growth conditions. To date, no information on the production of vesicles by the lactobacilli family has been reported. Here, we aimed to characterize the MVs released by the Gram-positive bacteria Lacticaseibacillus casei BL23 and also investigated the mechanisms involved in vesicle formation. Using electron microscopy, we established that the size of the majority of L. casei BL23 vesicles ranged from 50 to 100 nm. Furthermore, we showed that the vesicles were released consistently throughout the growth of the bacteria in standard culture conditions. The protein composition of the vesicles released in the supernatant was identified and a significant number of prophage proteins was detected. Moreover, using a mutant strain harboring a defective PLE2 prophage, we were able to show that the spontaneous and mitomycin-triggered induction of the prophage PLE2 contribute to the production of MVs by L. casei BL23. Finally, we also demonstrated the influence of prophages on the membrane integrity of bacteria. Overall, our results suggest a key role of the prophage PLE2 in the production of MVs by L. casei BL23 in the absence or presence of genotoxic stress. IMPORTANCE The last few decades have demonstrated that membrane vesicles (MVs) produced by microorganisms can have a wide variety of functions. This diversity places MVs at the crossroads of major research topics in current microbiology such as antibiotic resistance, horizontal gene transfer, cell communication, biofilm development, bacteriophage resistance, and pathogenesis. In particular, vesicles produced by probiotic strains have been shown to play a significant role in their beneficial effects. Thus, the study of vesicle biogenesis is a key element for promoting and improving their release. Overall, our results suggest a key role of spontaneous and mitomycin-triggered prophage induction in MV production by the Gram-positive bacteria Lacticaseibacillus casei BL23. This phenomenon is of great interest as prophage-induced MVs could potentially influence bacterial behavior, stress resistance, and vesicle functions.

Keywords: Lacticaseibacillus casei; membrane vesicle production; membrane vesicles; prophages; spontaneous prophage induction.


Conflict of interest statement

The authors declare no conflict of interest.

Figures

FIG 1
FIG 1
MVs are observed inside, on the surface and in the vicinity of L. casei BL23. (A) SEM image of MVs associated with the surface of the bacteria. In the lower image, MVs are colorized in red and the bacteria in green. (B) Negative-staining TEM images of MVs observed in the immediate vicinity of the bacteria. MVs are shown in the bottom panel. (C) HPF-FS TEM images of MVs closely associated with the bacteria.
FIG 2
FIG 2
Most vesicles are released during the growth of the bacteria within the first 24 h of culture. (A) Schematic representation of the MV quantification protocol. After several steps of centrifugation, filtration, concentration, and ultracentrifugation, the MVs are stained with DiI before being loaded on the iodixanol density gradient. (B) After 6, 12, 18 and 24 h of growth, the amount of purified DiI-labeled MVs collected from the growth medium were compared. The left and the top right images show the fluorescence intensity of the DiI-labeled MV fractions collected at each time point and the corresponding gradients, respectively. The graph shows for each time point the relative amount of fluorescence emitted by the DiI-labeled MVs collected and the OD600nm of the bacterial culture.
FIG 3
FIG 3
Purified MVs from L. casei BL23 are characterized for size and protein composition. (A) Cryo-SEM image of purified MVs. (A, inset) Zoomed-in view of the Cryo-SEM image. (B) Negative-staining TEM images of purified MVs. (C) The size distribution of purified MVs was obtained by analysis of the Cryo-SEM (830 vesicles) and the negative-staining TEM (533 vesicles) images. Vesicle sizes were obtained using the image analysis software Fiji (37). (D) Functional classification of L. casei BL23 MV proteins.
FIG 4
FIG 4
One out of the six predicted prophages in L. casei BL23 genome was able to replicate during the first 24 h of growth. (A) The position of six prophages in L. casei BL23 genome were predicted using the Phaster software. (B) Schematic drawings of the two strategies used to quantify prophage replication. Upon entry into the lytic pathway, the phage genome is replicated and the prophage excision generates attB/attP sites. Either a sequence within the prophage genome (green; strategy 1) or the attP sequence (red; strategy 2) is amplified and compared using qPCR with a bacterial genome sequence (gyrA). The bacterial (attB), phage (attP), and prophage (attL and attR) attachment-site sequences are indicated with colored boxes. (C) Relative quantification of the six putative phage genomes after 24 h of culture, using the qPCR strategy 1. (D) Quantification of the circularized PLE2 genome during the first 24 h of culture, using the qPCR strategy 2. (E) Negative-staining TEM images of purified PLE2 particles. After induction by MMC (400 ng/mL) at exponential growth phase (OD600nm = 0.3), cells were incubated for 24 h before purification of phage particles by CsCl density gradient.
FIG 5
FIG 5
Construction of a L. casei BL23 strain harboring a PLE2 excision-deficient mutant. The replication of the phage PLE2 in the parental strain L. casei (BL23) is compared with the PLE2 deficient strain (DDB001) and with the control strain (DDB002) using PCR (A) and qPCR (B). The DDB001 strain was obtained by insertion of the pRV300 plasmid into the PLE2 prophage gene LCABL_10980 (encoding a DNA primase). The DDB002 control stain was obtained by insertion of the pRV300 plasmid into a noncoding region. (A) For each strain, all attachment-site sequences were amplified by PCR and analyzed in a 1% agarose gel. (B) Comparison of the levels of circularized PLE2 in the parental, DBB001 and DDB002 strains using strategy 2 presented in Fig. 4B.
FIG 6
FIG 6
Contribution of the PLE2 prophage in the production of MVs with or without genotoxic stress. Relative quantification of the DiI-labeled MV fractions collected (A) from BL23, DDB001 and DDB002 strains after 24 h of culture or (B) from the BL23 strain treated with or without MMC. (C) Relative quantification of the DiI-labeled MVs collected from BL23, DDB001, and DDB002 strains treated with MMC. A final concentration of 400 ng/mL of MMC was added to the medium in the exponential phase (OD600nm = 0.3 to 0.4) and the MVs were collected after 24 h of culture. The left image and the right graph show, respectively, a representative nitrocellulose membrane and the quantification of fluorescence emitted by the DiI-labeled MVs purified from each strain.
FIG 7
FIG 7
The PLE2 prophages affect the permeability of L. casei BL23 leading to the release of MVs. (A and B) BL23, DDB001, and DDB002 strains treated with or without MMC were analyzed by cytometry to quantify the proportion of permeable cells within each population. A final concentration of 400 ng/mL of MMC was added to the medium in the exponential phase (OD600nm = 0.3 to 0.4) and after 24 h of culture; permeable cells were labeled with a membrane-impermeable nucleic acid stain (SYTOX blue). The proportion of positive cells (A) and the distribution of fluorescence intensity (B) are shown for each strain. A minimum of 4.104 events per replicate were analyzed. (C) The relative expression of the putative holin-endolysin systems was measured by reverse transcription-qPCR (RT-qPCR) in the BL23, DDB001 and DDB002 strains treated with or without MMC (400 ng/mL). Holin-endolysin systems were detected only in prophages PLE1, PLE2, and PLE3. (D) Confocal microscopy images of L. casei BL23 cells. After 24 h of culture, cell membranes were labeled with the lipophilic dye FM 1–43 (red) and permeable cells were stained with SYTOX blue (green).

References

    1. Deatherage BL, Cookson BT. 2012. Membrane vesicle release in bacteria, eukaryotes, and archaea: a conserved yet underappreciated aspect of microbial life. Infect Immun 80:1948–1957. doi:10.1128/IAI.06014-11. - DOI - PMC - PubMed
    1. Gill S, Catchpole R, Forterre P. 2019. Extracellular membrane vesicles in the three domains of life and beyond. FEMS Microbiol Rev 43:273–303. doi:10.1093/femsre/fuy042. - DOI - PMC - PubMed
    1. Brown L, Wolf JM, Prados-Rosales R, Casadevall A. 2015. Through the wall: extracellular vesicles in Gram-positive bacteria, mycobacteria and fungi. Nat Rev Microbiol 13:620–630. doi:10.1038/nrmicro3480. - DOI - PMC - PubMed
    1. Toyofuku M, Nomura N, Eberl L. 2019. Types and origins of bacterial membrane vesicles. Nat Rev Microbiol 17:13–24. doi:10.1038/s41579-018-0112-2. - DOI - PubMed
    1. Knox KW, Vesk M, Work E. 1966. Relation between excreted lipopolysaccharide complexes and surface structures of a lysine-limited culture of Escherichia coli. J Bacteriol 92:1206–1217. doi:10.1128/jb.92.4.1206-1217.1966. - DOI - PMC - PubMed

Publication types

LinkOut - more resources