. 2022 Oct 28;50(19):10914-10928.
doi: 10.1093/nar/gkac827.

The chromatin remodeler RSC prevents ectopic CENP-A propagation into pericentromeric heterochromatin at the chromatin boundary

Affiliations

The chromatin remodeler RSC prevents ectopic CENP-A propagation into pericentromeric heterochromatin at the chromatin boundary

Satoru Tsunemine et al. Nucleic Acids Res. .

Abstract

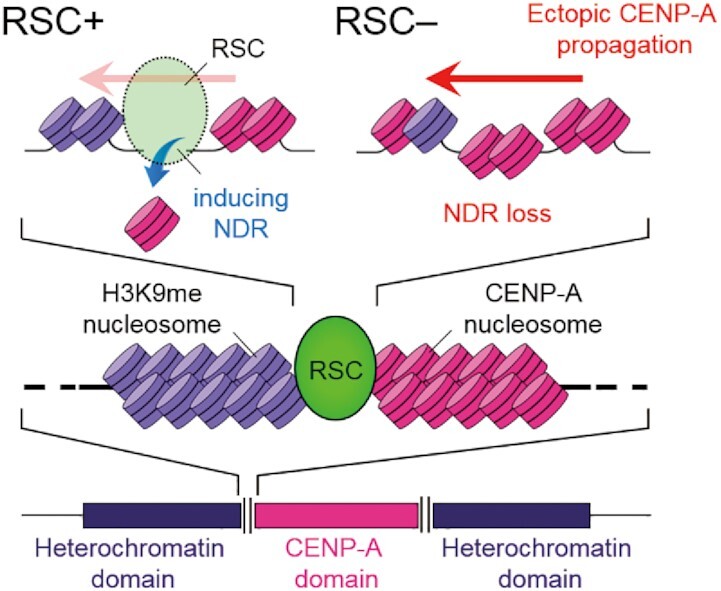
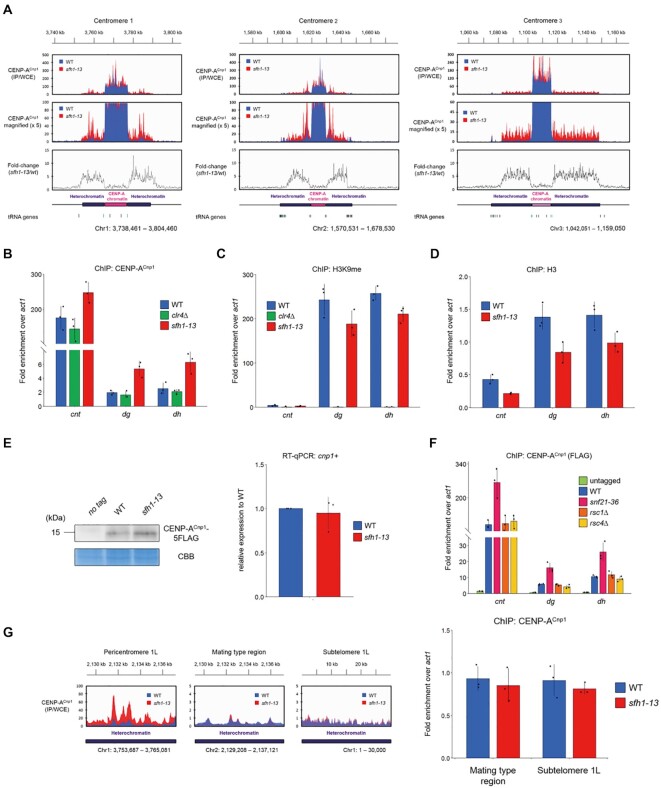
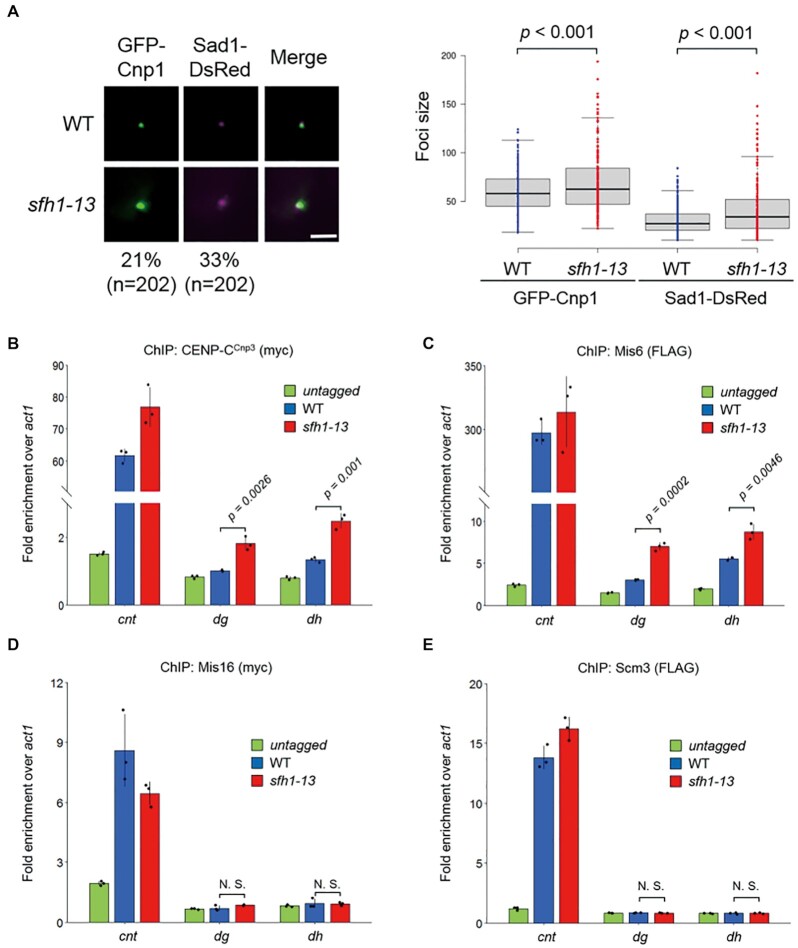
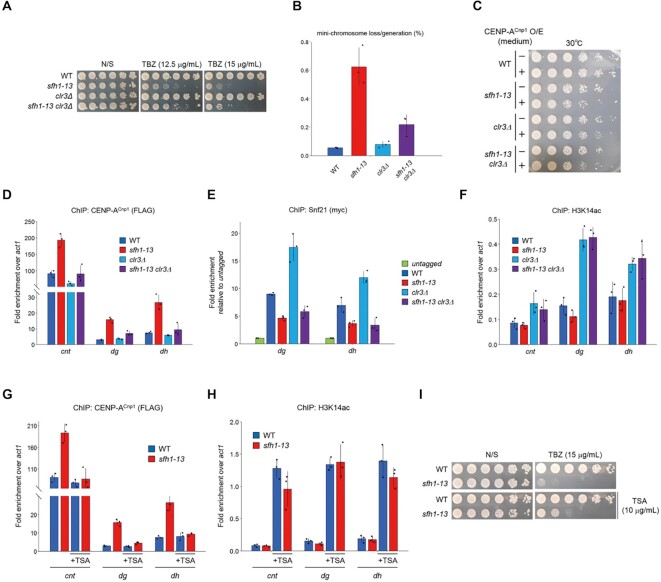
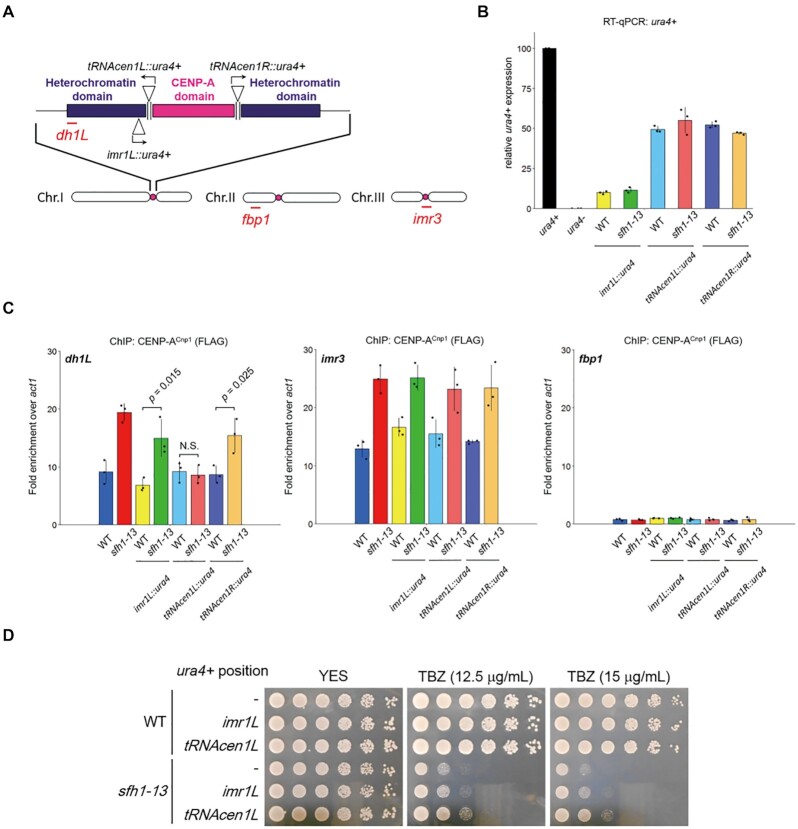
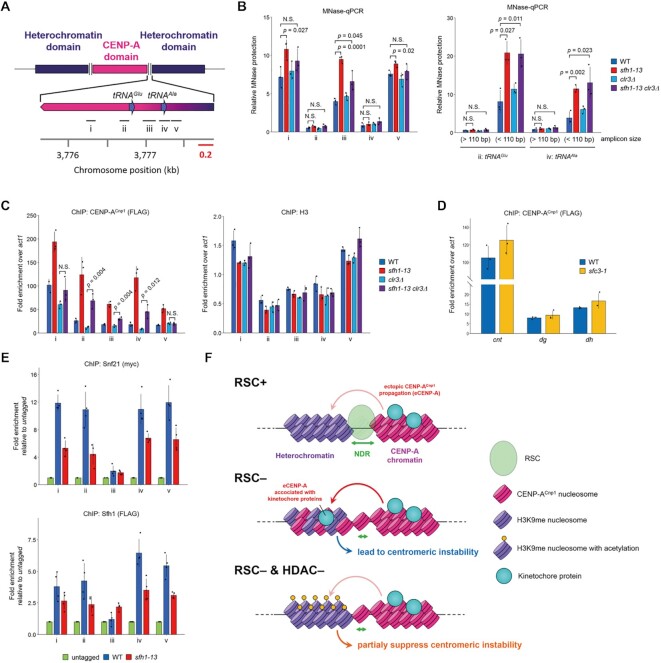
Centromeres of most eukaryotes consist of two distinct chromatin domains: a kinetochore domain, identified by the histone H3 variant, CENP-A, and a heterochromatic domain. How these two domains are separated is unclear. Here, we show that, in Schizosaccharomyces pombe, mutation of the chromatin remodeler RSC induced CENP-ACnp1 misloading at pericentromeric heterochromatin, resulting in the mis-assembly of kinetochore proteins and a defect in chromosome segregation. We find that RSC functions at the kinetochore boundary to prevent CENP-ACnp1 from spreading into neighbouring heterochromatin, where deacetylated histones provide an ideal environment for the spread of CENP-ACnp1. In addition, we show that RSC decompacts the chromatin structure at this boundary, and propose that this RSC-directed chromatin decompaction prevents mis-propagation of CENP-ACnp1 into pericentromeric heterochromatin. Our study provides an insight into how the distribution of distinct chromatin domains is established and maintained.


Figures

Graphical Abstract
Graphical Abstract
Chromatin remodeler RSC prevents mis-propagation of CENP-A into pericentromeric heterochromatin by decompacting the chromatin structure at the boundary.
Figure 1.
Figure 1.
Ectopic CENP-ACnp1 specifically deposits at pericentromeric heterochromatin in RSC-deficient cells. (A) ChIP-seq analyses of CENP-ACnp1 around centromere 1, 2 and 3. IP/WCE indicates the tag counts of the immunoprecipitated signal divided by those of whole cell extract. A schematic of the chromatin structure of centromeres is provided at the bottom. Top panels show the distributions of CENP-ACnp1 in wt and sfh1-13 strains. Middle panels are five times magnified version of the top panel. Bottom panels show the sfh1-13/wt ratio. (B–D) ChIP-qPCR analyses of CENP-ACnp1 (B), H3K9me2 (C) and H3 (D) at cnt, dg and dh in the indicated strains. Primer positions are shown in Supplementary Figure S2B. Error bars represent the SD of biologically independent experiments (n = 3). (E) Levels of CENP-ACnp1 in the indicated strains, as determined by immunoblotting (left) and RT-qPCR (right). Error bars represent SD resulting from biological triplicates. (F) ChIP-qPCR analysis of CENP-ACnp1 at cnt, dg and dh was performed in the indicated strains. Error bars represent the SD of biologically independent experiments (n = 3). (G) ChIP-seq analyses of CENP-ACnp1 on heterochromatic domains; pericentromere 1L, the mating-type region and the subtelomere region (left). ChIP-qPCR analysis of CENP-ACnp1 at the mating-type and subtelomere regions was performed in the indicated strains. Error bars represent the SD of biologically independent experiments (n = 3) (right).
Figure 2.
Figure 2.
sfh1-13 mutation induces the abnormal distribution of kinetochore proteins at pericentromere. (A) Visualization of CENP-ACnp1 and Sad1 in the nucleus. Wild-type and sfh1-13 cells expressing GFP-CENP-ACnp1 and Sad1-DsRed were cultured for 6 h at 36°C. Values at the bottom indicate the proportion of cells with CENP-ACnp1 or Sad1 foci ≧50% larger than wild type. Scale bar, 2 μm (left). Boxplot shows the size of CENP-ACnp1 and Sad1 foci in wild-type and sfh1-13 mutant cells containing a single GFP or DsRed spot (right). (BE) ChIP-qPCR analysis of CENP-CCnp3, Mis6, Mis16, and Scm3 at cnt, dg and dh in the indicated strains. Enrichment relative to the control act1 locus is shown on the Y-axis. Error bars represent the SD of biologically independent experiments (n = 3). P-value was calculated by two-sided Student's t-test. N.S., not significant (P-value > 0.05).
Figure 3.
Figure 3.
Histone acetylation improves centromeric function and eliminates misloaded CENP-ACnp1 at pericentromere in sfh1-13 mutant cells. (A) TBZ sensitivity of the indicated strains. Each strain was spotted onto the indicated plates and incubated at 30°C for 5 days. (B) Minichromosome loss assay monitoring the rate of loss of an artificial chromosome during cell division. Each strain was cultured at the non-permissive temperature for 8 h, and the rate of loss was measured. (C) Sensitivity to CENP-ACnp1-overexpression from the nmt41 promoter. Cells were grown for 3 days at 30°C. (D) ChIP-qPCR analyses of CENP-ACnp1 at cnt, dg and dh in the indicated strains, respectively. Error bars represent the SD of biologically independent experiments (n = 3). (E) ChIP-qPCR analysis of Snf21-13myc at dg and dh in the indicated strains. Enrichment relative to an untagged control is shown on the Y-axis. Error bars represent the SD of biologically independent experiments (n = 3). (F) ChIP-qPCR analyses of H3K14ac at cnt, dg and dh in the indicated strains, respectively. Error bars represent the SD of biologically independent experiments (n = 3). (G and H) ChIP-qPCR analyses of CENP-ACnp1 (G) and H3K14ac (H) at cnt, dg and dh was performed in the indicated strains. These strains were preincubated for 8 h with or without TSA (5 μg/ml). Error bars represent the SD of biologically independent experiments (n = 3). The values of WT and sfh1-13 without TSA are the same as those used in (D and F). (I) TBZ sensitivity of the indicated strains with or without TSA (10 μg/ml). Each strain was spotted onto the indicated plates and incubated at 30°C for 3 days.
Figure 4.
Figure 4.
Active transcription at the boundary between two centromeric domains prevents the propagation of ectopic CENP-ACnp1 in sfh1-13 mutant cells. (A) Schematic of all chromosomes with an inset detailed view of cen1 showing the insertion sites of an ura4+ reporter. Pink and purple rectangles indicate the CENP-ACnp1 and pericentromeric heterochromatin domain, respectively. Triangles indicate the insertion position of ura4+. Vertical black lines indicate the positions of tRNA genes. Horizontal red lines indicate the dh1L (on Chr.I), fbp1 (on Chr.II) and imr3 (on Chr.III) site for ChIP-qPCR, respectively. (B) ura4+ transcription analysed by RT-qPCR using RNA prepared from the indicated strains. Transcription of the ura4+ reporter gene in the indicated strains compared with native ura4+ expression in the wild-type strain are shown on the Y-axis. (C) ChIP-qPCR analysis of CENP-ACnp1-5FLAG at dh1L (left), imr3 (middle) and fbp1 (right) in the indicated strains. Error bars represent the SD of biologically independent experiments (n = 3). P-value was calculated by two-sided Student's t-test. N.S., not significant (P-value > 0.05). (D) TBZ sensitivity of the indicated strains. Each strain was spotted onto the indicated plates and incubated at 30°C for 3 days.
Figure 5.
Figure 5.
Sfh1/RSC promotes the decompaction of chromatin at the centromeric boundary. (A) Schematic structure of centromere 1, with an inset detailed view of the boundary region. Black bars indicate target sites of MNase and ChIP-qPCR. (B) MNase-qPCR analysis around the structural transition zone of centromeric chromatin in centromere 1 in the indicated strains. (left) The ratio of MNase-treated and untreated DNA normalized against the act1 transcriptional termination site (TTS) to determine relative MNase protection. (right) MNase-qPCR analysis at tRNAGlu and tRNAAla in centromere 1 in the indicated strains. The values of (>110 bp) at tRNAGlu and tRNAAla are the same as those used in (left). (C) ChIP-qPCR analyses of CENP-ACnp1-5FLAG (left) and H3 (right) in the indicated strains at five different sites in (sites 1 and 5) or close to (sites 2–4) the boundary is shown on the Y-axis. (D) ChIP-qPCR analysis of CENP-ACnp1 at cnt, dg and dh was performed in the indicated strains. (E) ChIP-qPCR analyses of Snf21-13myc (upper) and 3FLAG-Sfh1 (bottom) in the indicated strains at five different centromeric sites. Enrichment relative to an untagged control is shown on the Y-axis. Error bars represent the SD of biologically independent experiments (n = 4). P-value was calculated by two-sided Student's t-test. N.S., not significant (P-value > 0.05). (F) A model of centromeric boundary. (Upper) WT cell: RSC promotes the NDR formation at boundary between CENP-ACnp1 chromatin and pericentromeric heterochromatin domains. This NDR function preventing ectopic CENP-ACnp1 propagation into pericentromere. Therefore, the inappropriate deposition of CENP-ACnp1 does not occur in pericentromere in WT cells. (Middle) RSC-deficient cell: RSC defect causes the ectopic CENP-ACnp1 deposition/chromatin compaction at the boundary. The details of mechanism are unknown, however, this status attracts a inducing of CNEP-ACnp1 propagation associated with some kinetochore proteins into pericentromere resulting that causes the disturbance of centromeric function. (Bottom) RSC and HDAC-deficient cell: the lacking of HDAC or addition of TSA cause histone hyperacetylation in pericentromeric domains. Although ectopic CENP-ACnp1 deposition does not eliminate at the boundary, eliminates in pericentromere by this hyperacetylation. Consequently, pericentromeric integrity partially restore to the normal and partially supress the centromeric instability.

Similar articles

Cited by

References

    1. Black B.E., Foltz D.R., Chakravarthy S., Luger K., Woods V.L., Cleveland D.W.. Structural determinants for generating centromeric chromatin. Nature. 2004; 430:578–582. - PubMed
    1. De Rop V., Padeganeh A., Maddox P.S.. CENP-A: the key player behind centromere identity, propagation, and kinetochore assembly. Chromosoma. 2012; 121:527–538. - PMC - PubMed
    1. Cheeseman I.M., Desai A.. Molecular architecture of the kinetochore-microtubule interface. Nat. Rev. Mol. Cell Biol. 2008; 9:33–46. - PubMed
    1. Chen C.C., Mellone B.G.. Chromatin assembly: journey to the CENter of the chromosome. J. Cell Biol. 2016; 214:13–24. - PMC - PubMed
    1. Hota S.K., Bruneau B.G.. ATP-dependent chromatin remodeling during mammalian development. Development. 2016; 143:2882–2897. - PMC - PubMed

Publication types

MeSH terms