

Clonality, inbreeding, and hybridization in two extremotolerant black yeasts
- PMID: 36200832
- PMCID: PMC9535773
- DOI: 10.1093/gigascience/giac095
Clonality, inbreeding, and hybridization in two extremotolerant black yeasts
Abstract
Background: The great diversity of lifestyles and survival strategies observed in fungi is reflected in the many ways in which they reproduce and recombine. Although a complete absence of recombination is rare, it has been reported for some species, among them 2 extremotolerant black yeasts from Dothideomycetes: Hortaea werneckii and Aureobasidium melanogenum. Therefore, the presence of diploid strains in these species cannot be explained as the product of conventional sexual reproduction.
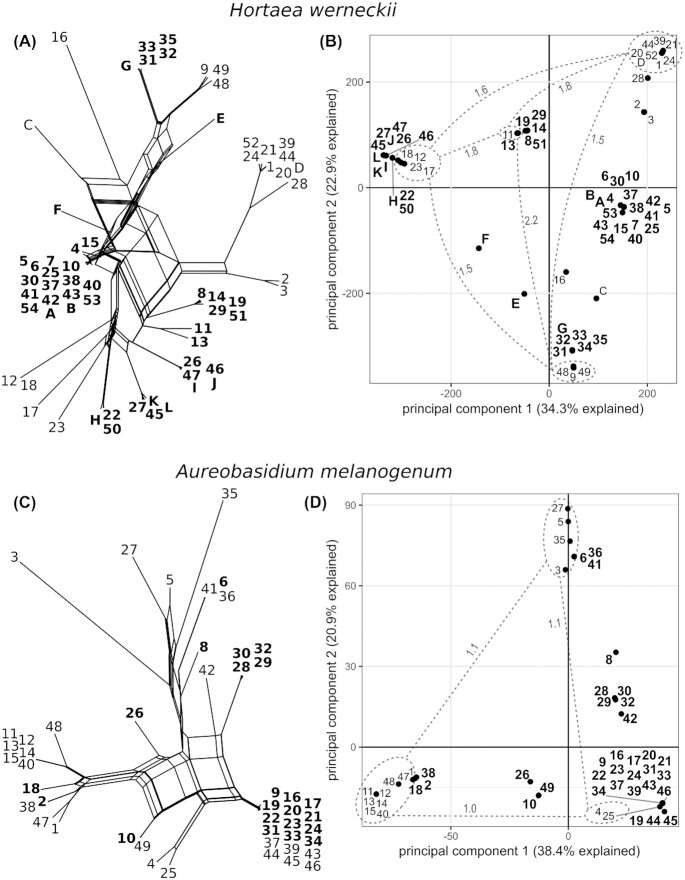
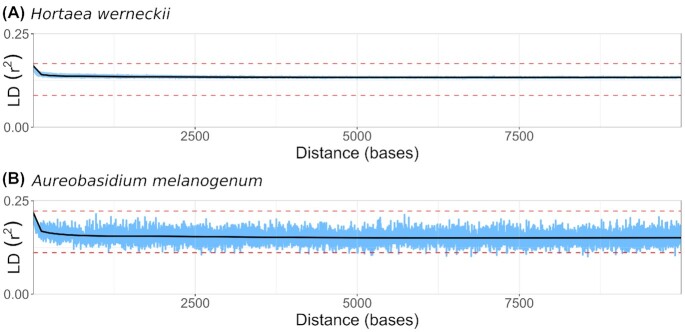
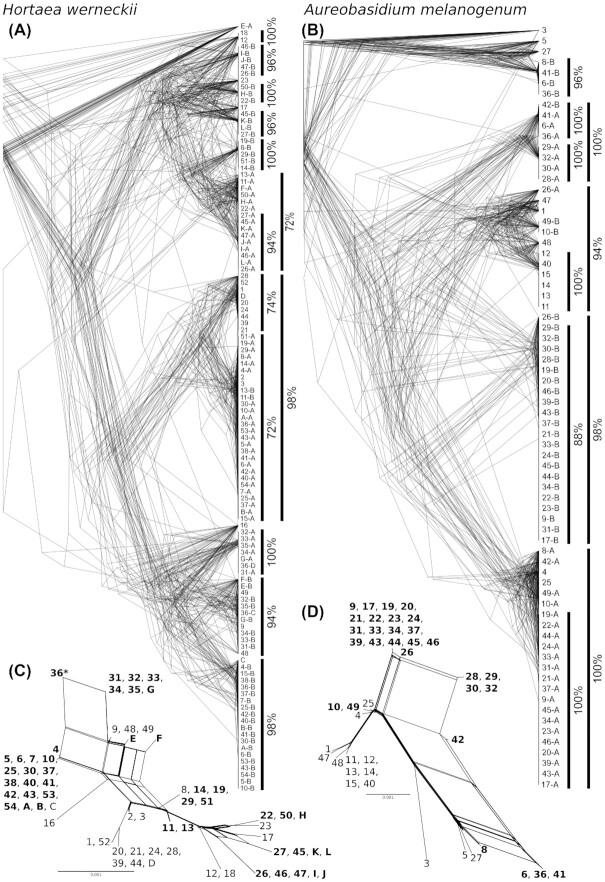
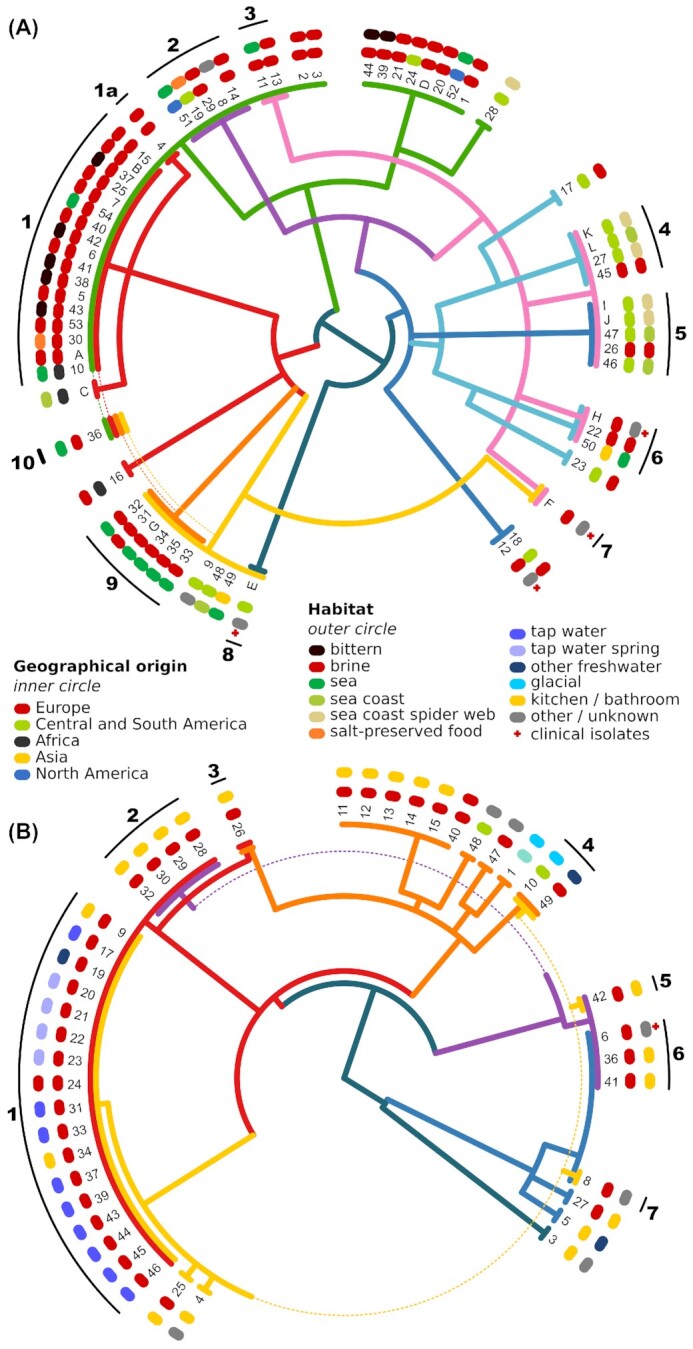
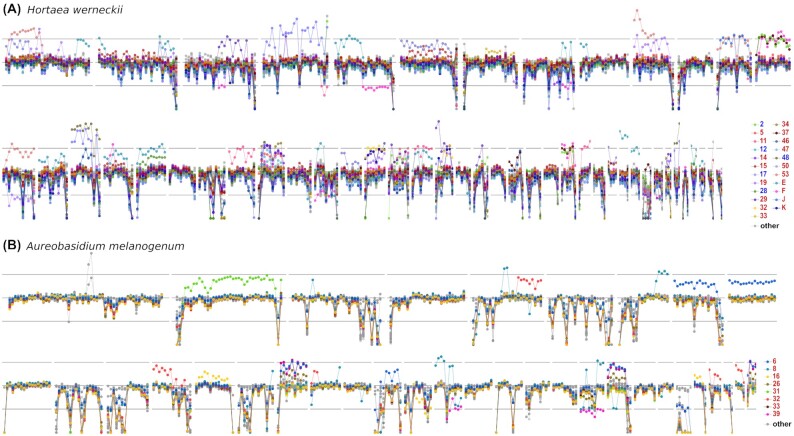
Results: Genome sequencing revealed that the ratio of diploid to haploid strains in both H. werneckii and A. melanogenum is about 2:1. Linkage disequilibrium between pairs of polymorphic loci and a high degree of concordance between the phylogenies of different genomic regions confirmed that both species are clonal. Heterozygosity of diploid strains is high, with several hybridizing genome pairs reaching the intergenomic distances typically seen between different fungal species. The origin of diploid strains collected worldwide can be traced to a handful of hybridization events that produced diploids, which were stable over long periods of time and distributed over large geographic areas.
Conclusions: Our results, based on the genomes of over 100 strains of 2 black yeasts, show that although they are clonal, they occasionally form stable and highly heterozygous diploid intraspecific hybrids. The mechanism of these apparently rare hybridization events, which are not followed by meiosis or haploidization, remains unknown. Both extremotolerant yeasts, H. werneckii and even more so A. melanogenum, a close relative of the intensely recombining and biotechnologically relevant Aureobasidium pullulans, provide an attractive model for studying the role of clonality and ploidy in extremotolerant fungi.
Keywords: Aureobasidium melanogenum; Hortaea werneckii; extremotolerance; halophilic fungus; halotolerance; hybridization; population genomics.
© The Author(s) 2022. Published by Oxford University Press GigaScience.
Conflict of interest statement
The authors declare that they have no competing interests.
Figures
Similar articles
-
Black yeasts in hypersaline conditions.Appl Microbiol Biotechnol. 2024 Mar 5;108(1):252. doi: 10.1007/s00253-024-13052-2. Appl Microbiol Biotechnol. 2024. PMID: 38441672 Free PMC article. Review.
-
Genomic evidence for intraspecific hybridization in a clonal and extremely halotolerant yeast.BMC Genomics. 2018 May 15;19(1):364. doi: 10.1186/s12864-018-4751-5. BMC Genomics. 2018. PMID: 29764372 Free PMC article.
-
The extremely halotolerant black yeast Hortaea werneckii - a model for intraspecific hybridization in clonal fungi.IMA Fungus. 2019 Jul 8;10:10. doi: 10.1186/s43008-019-0007-5. eCollection 2019. IMA Fungus. 2019. PMID: 32647617 Free PMC article.
-
Fifty Aureobasidium pullulans genomes reveal a recombining polyextremotolerant generalist.Environ Microbiol. 2019 Oct;21(10):3638-3652. doi: 10.1111/1462-2920.14693. Epub 2019 Jun 18. Environ Microbiol. 2019. PMID: 31112354 Free PMC article.
-
Superficial Phaeohyphomycosis Caused by Aureobasidium melanogenum Mimicking Tinea Nigra in an Immunocompetent Patient and Review of Published Reports.Mycopathologia. 2016 Aug;181(7-8):555-60. doi: 10.1007/s11046-016-9989-3. Epub 2016 Feb 16. Mycopathologia. 2016. PMID: 26883514 Review.
Cited by
-
Description of new micro-colonial fungi species Neophaeococcomyces mojavensis, Coniosporium tulheliwenetii, and Taxawa tesnikishii cultured from biological soil crusts.bioRxiv [Preprint]. 2024 Jun 20:2024.06.12.598762. doi: 10.1101/2024.06.12.598762. bioRxiv. 2024. PMID: 38915581 Free PMC article. Preprint.
-
Black yeasts in hypersaline conditions.Appl Microbiol Biotechnol. 2024 Mar 5;108(1):252. doi: 10.1007/s00253-024-13052-2. Appl Microbiol Biotechnol. 2024. PMID: 38441672 Free PMC article. Review.
-
Heterologous Expression and Biochemical Characterization of a New Chloroperoxidase Isolated from the Deep-Sea Hydrothermal Vent Black Yeast Hortaea werneckii UBOCC-A-208029.Mar Biotechnol (NY). 2023 Aug;25(4):519-536. doi: 10.1007/s10126-023-10222-7. Epub 2023 Jun 24. Mar Biotechnol (NY). 2023. PMID: 37354383 Free PMC article.
-
Strategies for genetic manipulation of the halotolerant black yeast Hortaea werneckii: ectopic DNA integration and marker-free CRISPR/Cas9 transformation.Microbiol Spectr. 2025 Jan 7;13(1):e0243024. doi: 10.1128/spectrum.02430-24. Epub 2024 Dec 10. Microbiol Spectr. 2025. PMID: 39656015 Free PMC article.
-
Use of Aureobasidium in a sustainable economy.Appl Microbiol Biotechnol. 2024 Feb 13;108(1):202. doi: 10.1007/s00253-024-13025-5. Appl Microbiol Biotechnol. 2024. PMID: 38349550 Free PMC article. Review.
References
-
- Brown A. Mating in mushrooms: increasing the chances but prolonging the affair. Trends Genet. 2001;17:(7):393–400. - PubMed
-
- Gladieux P, De Bellis F, Hann-Soden C, et al. Neurospora from natural populations: population genomics insights into the life history of a model microbial eukaryote. Methods Mol Biol. 2020;2090:313–36. - PubMed
-
- Hawksworth DL, Kirk PM, Sutton BC, et al. Ainsworth & Bisby's Dictionary of the Fungi. 8th ed. Oxford, UK: Oxford University Press, 1996;
Publication types
MeSH terms
LinkOut - more resources
Full Text Sources
Other Literature Sources
