. 2022 Dec 1;33(14):ar138.
doi: 10.1091/mbc.E21-11-0540. Epub 2022 Oct 6.

Agent-based modeling predicts RAC1 is critical for ovarian cancer metastasis

Affiliations

Agent-based modeling predicts RAC1 is critical for ovarian cancer metastasis

Melanie Rivera et al. Mol Biol Cell. .

Abstract

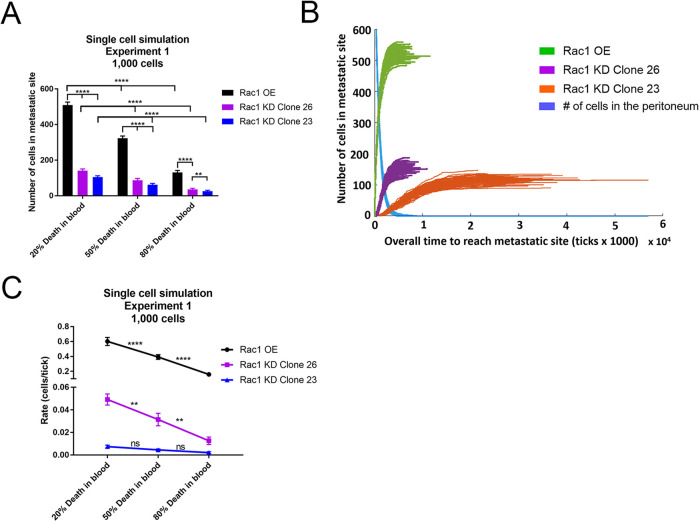
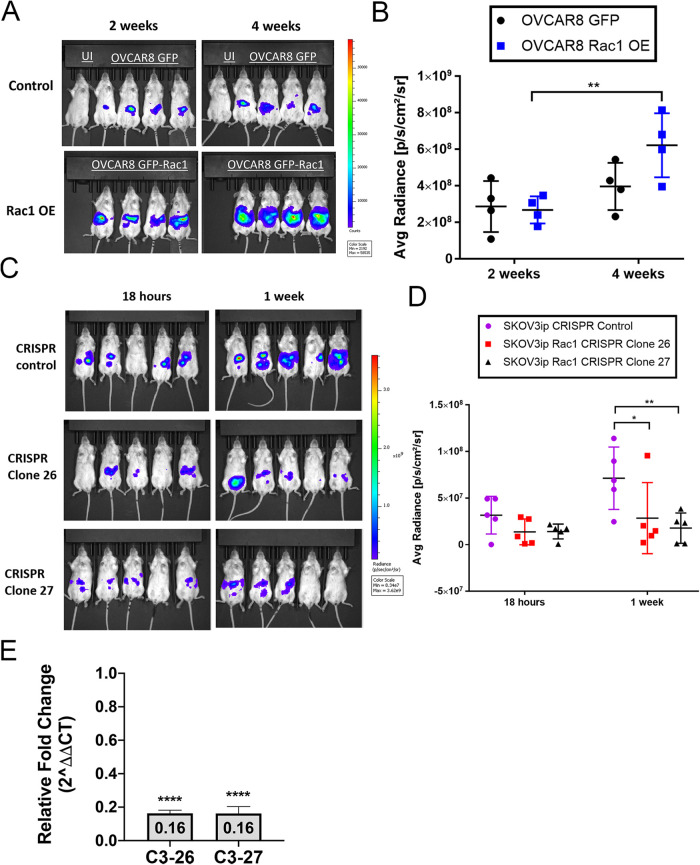
Experimental and computational studies pinpoint rate-limiting step(s) in metastasis governed by Rac1. Using ovarian cancer cell and animal models, Rac1 expression was manipulated, and quantitative measurements of cell-cell and cell-substrate adhesion, cell invasion, mesothelial clearance, and peritoneal tumor growth discriminated the tumor behaviors most highly influenced by Rac1. The experimental data were used to parameterize an agent-based computational model simulating peritoneal niche colonization, intravasation, and hematogenous metastasis to distant organs. Increased ovarian cancer cell survival afforded by the more rapid adhesion and intravasation upon Rac1 overexpression is predicted to increase the numbers of and the rates at which tumor cells are disseminated to distant sites. Surprisingly, crowding of cancer cells along the blood vessel was found to decrease the numbers of cells reaching a distant niche irrespective of Rac1 overexpression or knockdown, suggesting that sites for tumor cell intravasation are rate limiting and become accessible if cells intravasate rapidly or are displaced due to diminished viability. Modeling predictions were confirmed through animal studies of Rac1-dependent metastasis to the lung. Collectively, the experimental and modeling approaches identify cell adhesion, rapid intravasation, and survival in the blood as parameters in the ovarian metastatic cascade that are most critically dependent on Rac1.


Figures

FIGURE 1:
FIGURE 1:
Ovarian cancer cell models. Ovarian cancer cell lines with Rac1 OE or KD were generated to investigate the role of Rac1 in ovarian cancer metastasis. (A, B) Quantification of endogenous Rac1 expression in SKOV3ip, OVCAR3, and OVCAR8 cell lines. SKOV3ip cells have two- and threefold increases in endogenous Rac1 expression compared with OVCAR3 and OVCAR8 cells, respectively. (C, D) Quantification of Rac1 expression in SKOV3ip ovarian cancer cells. (E, F) Quantification of Rac1 KD by CRISPR-Cas9 in SKOV3ip ovarian cancer cell clones that were selected after CRISPR electroporation via single-cell cloning. Means ± SD (n = 2 for B, D, and F).
FIGURE 2:
FIGURE 2:
ECIS to assess cell adhesion and spreading. ECIS was used to measure cell–cell barrier formation, cell–substrate adhesion, and cell spreading. SKOV3ip cells were plated on gold-coated electrodes. (A) Resistance kinetics plot measured at 4000 Hz over 24 h to measure cell–barrier formation. (B) Resistance quantified at 10 h. SKOV3ip Rac1 High OE cells have a significantly higher resistance, indicating a tighter cell–cell barrier formation compared with control and Rac1 CRISPR-Cas9 KD cells. (C, D) Quantification of the average slope of resistance measured over the first 10 h after cells are added to the ECIS electrode arrays. SKOV3ip Rac1 High OE cells exhibited a significantly higher average slope, indicating faster cell–barrier formation. SKOV3ip Rac1 CRISPR-Cas9 KD cells have the lowest slope, suggesting a longer time to form cell–cell adhesions. (E) Capacitance kinetics plot at 64,000 Hz over 24 h to measure cell–substrate adhesion. (F) Capacitance measured at 64,000 Hz to assess cell–substrate adhesion. SKOV3ip Rac1 CRISPR-Cas9 KD cells have the highest capacitance, indicating weaker adhesion to the gold electrode. SKOV3ip Rac1 OE and control cell lines have significantly lower capacitance, suggesting a tighter adhesion to the electrode. (G) The t1/2 max, or time to cover the electrode, was quantified to assess changes in cell spreading. SKOV3ip Rac1 CRISPR-Cas9 KD cells take significantly more time to cover the electrode compared with SKOV3ip Rac1 OE or control cells. Means ± SD (n = 3). One-way ANOVA followed by Tukey’s post-hoc test for multiple comparison was used: *p < 0.05, **p < 0.01, ***p < 0.001, ****p < 0.0001.
FIGURE 3:
FIGURE 3:
Rac1 is important for ovarian cancer cell invasion. Invasion of SKOV3ip ovarian cancer cells was assessed using Matrigel Transwell inserts. SKOV3ip cells with GFP or increasing levels of GFP-Rac1 overexpression (GFP-Rac1 Low and GFP-Rac1 High) or Rac1 CRISPR-Cas9 KD were compared. (A) Representative images of SKOV3ip GFP control and GFP-Rac1 OE cellular invasion. (B) Quantification of the number of invaded ovarian cancer cells after 48 h. (C) Representative images of SKOV3ip Rac1 CRISPR-Cas9 KD cellular invasion. (D) Quantification of ovarian cancer cell invasion after 48 h. Quantification is based on three or four independent experiments with three technical Transwell insert replicates per cell line. Five random fields of view were imaged, counted, and averaged for each insert. Means ± SD (n = 3 in B, n = 4 in D). One-way ANOVA: ***p < 0.0002, ****p < 0.0001.
FIGURE 4:
FIGURE 4:
Rac1 OE decreases area of SKOV3ip spheroids. SKOV3ip cells Parental, GFP control, GFP-Rac1 OE, Rac1 CRISPR-Cas9 control, Rac1 CRISPR-Cas9 KD clone 23, and Rac1 CRISPR-Cas9 KD clone 27 were seeded in U-bottom plates to form spheroids (100 cells/well). Spheroids were imaged in bright field after 4 ds of incubation. (A) Representative images of spheroid formation for each cell line. (B) Quantification of spheroid area comparing every cell line to each other. Means ± SD (n = 19 in Rac1 CRISPR-Cas9 control, and n = 20 in the rest of the cell lines). One-way ANOVA, followed by Tukey’s test: ****p < 0.0001. Scale bar is 200 μm.
FIGURE 5:
FIGURE 5:
Rac1 OE increases mesothelial clearance area of SKOV3ip spheroids. SKOV3ip cells Parental, GFP control, High-Rac1 OE, Rac1 CRISPR-Cas9 control, and Rac1 CRISPR-Cas9 KD clone 23 were seeded in U-bottom plates to form spheroids (100 cells/well). Spheroids were transferred to CellTracker Red–labeled monolayers of LP-9 mesothelial cells. Mesothelial cell clearance was imaged at 7 h and 24 or 25 h post–spheroid addition. Clearance areas were normalized at each time point by dividing the clearance area by the spheroid area at 1 h postaddition. (A, C, and E) Representative spheroid images at 1 h postaddition in bright field and mesothelial clearance areas at 7 and 25 h post–spheroid addition visualized using a TRITC filter. (B) Quantification of normalized mesothelial clearance area (MCA) of parental and High Rac1 OE cells at 25 h post–spheroid addition. Means ± SD (n = 18 in parental, and n = 23 in Rac1 High OE). (D) Quantification of normalized 25-h MCA comparing GFP and High-Rac1 OE cells. Means ± SD (n = 29 in GFP and n = 34 in High Rac1OE). (F) Quantification of normalized MCA at 25 h comparing Parental, Rac1 CRISPR-Cas9 control, and Rac1 CRISPR-Cas9 KD clone 23. Means ± SD (n = 27 in Parental, n = 23 in Rac1 CRISPR-Cas9 control, and n = 26 in Rac1 CRISPR-Cas9 KD clone 23). One-way ANOVA, followed by a Tukey’s test was performed for all three experiments. ****p < 0.0001. Scale bars are 500 μm.
FIGURE 6:
FIGURE 6:
NetLogo world set up for OCMetSim-Single Cells and OCMetSim-Spheroids and parameter validation. (A) Representative images of the NetLogo simulation space setup for OCMetSim-Single Cells and OCMetSim-Spheroids. Ovarian cancer cells/spheroids (yellow agents) move between the peritoneum (black patches), circulation (red patches), and to a distant metastatic niche (brown patches with white agents) based on Rac1 expression. Green patches represent the space ovarian cancer cells can adhere to the blood vessel using the parameters set from the ECIS/mesothelial clearance experiments. Blue patches represent the invaded cells into the blood vessel based on parameter set from the Matrigel invasion/mesothelial clearance experiments. The cyan patches represent adhesion to a distant metastatic niche, and the magenta patches represent invasion into a distant metastatic niche tissue. Simulations were run to compare the rate and number of invaded cells into a distant metastatic niche with Rac1 OE or KD. (B) The invasion parameters were validated running simulations with a Poisson distribution for rate of invasion using the Matrigel experimental data from Figure 3 as described in the Results and Materials and Methods sections. The simulations confirm that a Poisson distribution for rate of invasion produces results similar to those for the experimental data.
FIGURE 7:
FIGURE 7:
OCMetSim-Single Cells model predicts that Rac1 OE contributes to tumor cell metastasis to distant metastatic niche sites. (A) Single-cell simulation results comparing the number of cells that reach a distant metastatic niche with Rac1 OE or KD. Using the parameters for increased invasion and adhesion with Rac1 OE, and varying probabilities of cell death in the blood, these results demonstrate that Rac1 OE results in more ovarian cancer cells reaching a distant metastatic niche in less time, compared with two Rac1 CRISPR-Cas9 KD clones (clones 23 and 26). (B) Representative image of 100 runs with 20% death in the blood and parameters for Rac1 OE or Rac1 CRISPR-Cas9 KD, displaying the rate at which the cells enter the distant niche site. The blue line represents the decrease in the number of cells in the peritoneal compartment for Rac1 OE and KD cells over time. (C) The slope of each cell type entering the distant niche site was quantified to determine the rate at which cells entered the distant niche site. Rac1 OE cells have a higher rate at which they enter the distant niche site compared with two Rac1 CRISPR-Cas9 KD clones. Thirty simulations were run for each experiment. Error bars represent means ± SD. Two-way ANOVA followed by Tukey’s post-hoc test for multiple comparison across columns and rows was used to compare differences between cell type and probability of death in the blood: **p < 0.01, ****p < 0.0001.
FIGURE 8:
FIGURE 8:
OCMetSim-Single Cells model with added cell death from crowding predicts that cell crowding and cell death from crowding affect the number and rate at which ovarian cancer cells reach a distant niche site. (A, B) Single-cell simulations run to investigate the effects of cells dying from nonattachment caused by crowding of cells lining the blood vessel. The probability of cell death from crowding was varied and tested. Eighty percent probability of cell death in the blood was used. Rac1 CRISPR-Cas9 KD resulted in a further decrease in the number of cells that reached a distant metastatic niche. (B) The rate at which the Rac1 OE cells reached the distant niche site was decreased with crowding or crowding cell death, and the Rac1 OE reached the distant site faster than the Rac1 CRISPR-Cas9 KD cells. (C,D) Single-cell simulations with 5000 cells and cell crowding were run. (C) Crowding did not affect the number of cells that reached the distant tissue site. However, with 50% probability of dying due to cell crowding, the numbers of Rac1 OE and KD cells that reached the distant site were decreased. (D) The rate at which the Rac1 OE and Rac1 CRISPR-Cas9 KD clone 26 cells entered the distant niche site was also decreased with crowding and crowding cell death. Thirty simulations were run for each experiment. Error bars represent means ± SD. Two-way ANOVA followed by Tukey’s post-hoc test for multiple comparison across columns and rows was used to compare cell types and crowding and crowding death: *p < 0.05,***p < 0.005, ****p < 0.0001.
FIGURE 9:
FIGURE 9:
OCMetSim-Spheroids model predicts that Rac1 contributes to ovarian cancer spheroid intravasation into circulation and extravasation to distant niche sites. Experiment 1a: Spheroid simulation results comparing (A) the number of spheroids and (B) the rate at which they enter the distant niche site for Rac1 OE or KD clone 23. Rac1 OE or KD spheroids were given 100% probability of adhesion, based on 100% spheroid adhesion observed in the mesothelial clearance assay. (A) Varying probabilities of cells death in the blood decreased the number of ovarian cancer spheroids in the metastatic niche. (B) The rate at which the OE and KD spheroids reached the metastatic niche decreased with increasing probability of cell death in the blood; however, the Rac1 OE spheroids reached the distant site faster than the KD spheroids. Experiment 2a: Spheroid simulation results comparing cell crowding and cell death from crowding (C, D). (C) With added cell death from crowding, the number of Rac1 OE and KD cells that reached the distant site decreased. (D) With crowding and cell death due to crowding, the rate at which the Rac1 OE spheroids reached the distant site was decreased compared with no crowding. The rate at which the Rac1 CRISPR-Cas9 KD cells reached the distant site was decreased with added cell death from crowding. Thirty simulations were run for each experiment. Error bars represent means ± SD. Two-way ANOVA followed by Tukey’s post-hoc test for multiple comparison across columns and rows was used to compare cell types and crowding and crowding death: *p < 0.05, ***p < 0.005 ****p < 0.0001.
FIGURE 10:
FIGURE 10:
Rac1 overexpression increases tumor burden. OVCAR8 GFP control, OVCAR8 GFP-Rac1 OE, and SKOV3ip CRISPR-Cas9 control, SKOV3ip Rac1 CRISPR-Cas9 KD clone ovarian cancer cells transduced with luciferase were IP injected into NSG mice. Tumor burden was measured using bioluminescent IVIS imaging. (A) Representative IVIS images of NSG mice injected with OVCAR8 GFP control (top row) and OVCAR8 GFP-Rac1 OE cells (bottom row) imaged 2 and 4 wk post–IP injection. (B) Quantification of the average radiance at 2 and 4 wk postinjection. Quantification of 2D radiance using two-way ANOVA shows significant time-dependent variance; p = 0.0043 of tumor burden. N = 4 for each group. (C) Representative IVIS images of NSG mice injected with SKOV3ip CRISPR-Cas9 control cells or Rac1 CRISPR-Cas9 KD cells imaged 18 h and 1 wk post–IP injection. (D) Quantification of the average radiance at 18 h and 1 wk post-injection. Quantification of average radiance using two-way ANOVA reveals a significant decrease in tumor burden in mice injected with CRISPR KD clones (clones 26 and 27) compared with control. N = 5 for each group. *p < 0.05, **p < 0.01. (E) Omental tissue isolated from mouse xenografts of SKOV3ip ovarian cancer cells expressing luciferase. Omental tissues were isolated from mice 1 wk after being injected with 4 × 10⁶ Rac1 CRISPR-Cas9 KD (C3-26 or C3-27) or CRISPR-Cas9 control (C4) cells, and gene expression levels of luciferase were analyzed based on targeted qPCR. Data represented are mean ± SE. These data are combined from one experiment with five biological replicates. **** indicates p value ≤ 0.0001, where values represent relative expression for Rac1 CRISPR-Cas9 KD compared with CRISPR-Cas9 control C4 (1.0) and normalized to 18s rRNA using unpaired two-tailed t test.
FIGURE 11:
FIGURE 11:
Pharmacologic inhibition of Rac1 inhibits local and distant metastases in vivo. Gene expression levels of targeted luciferase qPCR analyses of omental and lung tissues isolated from mouse xenografts of SKOV3ip ovarian cancer cells. Samples are from mice treated with 5 mg/kg/d R-ketorolac or placebo for 4 wk. Data represented are mean ± SE. (A) Omental tissue data are from one experiment with five biological replicates. ** indicates p value < 0.01, where values represent relative expression for R-ketorolac compared with placebo (1.0) and normalized to 18s rRNA using unpaired two-tailed t test. (B) Lung tissue data are combined from one experiment with five biological replicates. *** indicates p value < 0.001, where values represent relative expression for R-ketorolac compared with placebo (1.0) and normalized to 18s rRNA using unpaired two-tailed t test.

Similar articles

Cited by

References

    1. Al Habyan S, Kalos C, Szymborski J, McCaffrey L (2018). Multicellular detachment generates metastatic spheroids during intra-abdominal dissemination in epithelial ovarian cancer. Oncogene 37, 5127–5135. - PMC - PubMed
    1. Ansari AM, Ahmed AK, Matsangos AE, Lay F, Born LJ, Marti G, Harmon JW, Sun Z (2016). Cellular GFP toxicity and immunogenicity: potential confounders in in vivo cell tracking experiments. Stem Cell Rev Rep 12, 553–559. - PMC - PubMed
    1. Applied BioPhysics (2021). Electric cell-substrate impedance sensing (ECIS), https://www.biophysics.com/.
    1. Atiya HI, Orellana TJ, Wield A, Frisbie L, Coffman LG (2021). An orthotopic mouse model of ovarian cancer using human stroma to promote metastasis. J Vis Exp 2021, doi:10.3791/62382. - DOI - PubMed
    1. Bauer AL, Jackson TL, Jiang Y (2007). A cell-based model exhibiting branching and anastomosis during tumor-induced angiogenesis. Biophys J 92, 3105–3121. - PMC - PubMed

Publication types

Substances