. 2022 Oct 26;10(5):e0307522.
doi: 10.1128/spectrum.03075-22. Epub 2022 Oct 6.

Superinfection with SARS-CoV-2 Has Deleterious Effects on Mycobacterium bovis BCG Immunity and Promotes Dissemination of Mycobacterium tuberculosis

Affiliations

Superinfection with SARS-CoV-2 Has Deleterious Effects on Mycobacterium bovis BCG Immunity and Promotes Dissemination of Mycobacterium tuberculosis

Rachel E Hildebrand et al. Microbiol Spectr. .

Abstract

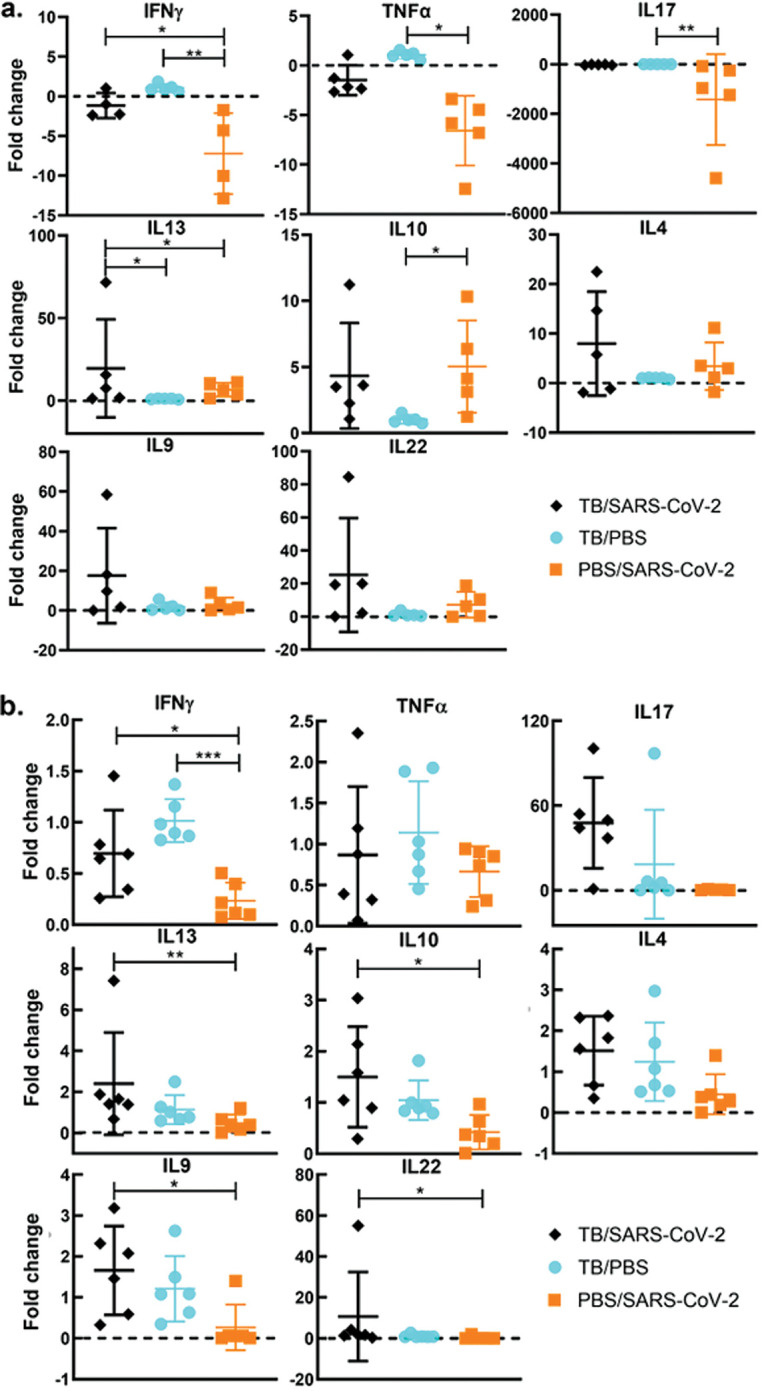
An estimated one-third of the world's population is infected with Mycobacterium tuberculosis, with the majority being vaccinated with Mycobacterium bovis BCG. Severe acute respiratory syndrome coronavirus 2 (SARS-CoV-2) remains a threat, and we must understand how SARS-CoV-2 can modulate both BCG immunity and tuberculosis pathogenesis. Interestingly, neither BCG vaccination nor tuberculosis infection resulted in differences in clinical outcomes associated with SARS-CoV-2 in transgenic mice. Surprisingly, earlier M. tuberculosis infection resulted in lower SARS-CoV-2 viral loads, mediated by the heightened immune microenvironment of the murine lungs, unlike vaccination with BCG, which had no impact. In contrast, M. tuberculosis-infected tissues had increased bacterial loads and decreased histiocytic inflammation in the lungs following SARS-CoV-2 superinfection. SARS-CoV-2 modulated BCG-induced type 17 responses while decreasing type 1 and increasing type 2 cytokines in M. tuberculosis-infected mice. These findings challenge initial findings of BCG's positive impact on SARS-CoV-2 infection and suggest potential ramifications for M. tuberculosis reactivation upon SARS-CoV-2 superinfection. IMPORTANCE Prior to SARS-CoV-2, M. tuberculosis was the leading infectious disease killer, with an estimated one-third of the world's population infected and 1.7 million deaths a year. Here, we show that SARS-CoV-2 superinfection caused increased bacterial dissemination in M. tuberculosis-infected mice along with immune and pathological changes. SARS-CoV-2 also impacted the immunity of BCG-vaccinated mice, resulting in decreased interleukin-17 (IL-17) levels, while offering no protective effect against SARS-CoV-2. These results demonstrate that SARS-CoV-2 may have a deleterious effect on the ongoing M. tuberculosis pandemic and potentially limit BCG's efficacy.

Keywords: BCG; Mycobacterium tuberculosis; SARS-CoV-2; pathogenesis; superinfection; virulence.


Conflict of interest statement

The authors declare a conflict of interest. A.M.T. has financial interests in Pan Genome Systems, Inc., a startup company developing animal and human vaccines.

Figures

FIG 1
FIG 1
Experimental design of superinfection studies. Mice were infected with 100 CFU/lung via aerosol with M. tuberculosis Erdman (M. tb) or vaccinated with 106 CFU BCG via subcutaneous injection. Four and eight weeks after infection (weeks postinfection [wpi]) with M. tuberculosis or vaccination with BCG, mouse groups were challenged with 103 PFU of SARS-CoV-2. Half of the mice were sacrificed at 4 days postinfection (dpi) for sampling, and the remaining mice were sacrificed when they became moribund or at 8 dpi as an endpoint. There were at least 5 mice per group for both the 4-dpi and mortality curves. For the 4-wpi experiment, only the mortality curve was done, and surviving mice were sacrificed at 8 dpi. I/N, intranasally. (Image created with Biorender.com.)
FIG 2
FIG 2
BCG vaccination has a limited impact on SARS-CoV-2 infection. (a) Percent survival at the experimental endpoint (left) and percent change of initial weights (right) for mice challenged with SARS-CoV-2 after 4 weeks postvaccination (wpv). Day 0 refers to the day of SARS-CoV-2 challenge. (b) Similar to panel A but for mice challenged with SARS-CoV-2 8 weeks after vaccination with BCG. All 4-wpi groups contain 5 mice, and 8-wpi groups contain 6 mice, with the exception of the BCG/PBS group, which has 3. The survival curve statistics were calculated using the Kaplan-Meier method, and the weight changes were compared on each day using ANOVA, with standard deviations reported for each time point.
FIG 3
FIG 3
BCG vaccination does not impact SARS-CoV-2 viral loads. (a) Viral loads in murine lungs (PFU per lung) and spleen (genome copy numbers per spleen) from mice sacrificed at the time of death between 5 and 7 days after infection with SARS-CoV-2 and 4 weeks after vaccination with BCG. (b) Viral loads in murine lungs and spleens from mice sacrificed at 4 dpi and at the time of death between 5 and 7 dpi 8 weeks after vaccination with BCG. A log scale was used for all viral loads. P values for normally distributed data were determined by ANOVA, while P values for nonnormally distributed data were determined by a Kruskal-Wallis test. P values of <0.05 (*), <0.01 (**), and <0.0001 (****) were considered significant. See Materials and Methods for further details. Lung viral loads were measured by a plaque assay, while spleen loads were measured by real-time PCR.
FIG 4
FIG 4
BCG vaccination causes no significant change in SARS-CoV-2 cytokine profiles. Cytokine expression levels at 8 wpv normalized to naive age-matched mice were determined by quantitative real-time PCR (qRT-PCR) for key cytokines involved in the pathogenesis of SARS-CoV-2 and BCG protection. Each panel indicates one cytokine for the BCG-only, BCG/SARS-CoV-2 superinfection, or SARS-CoV-2-alone groups. P values for normally distributed data were determined using ANOVA, while P values for nonnormally distributed data were determined using a Kruskal-Wallis test. P values of <0.05 (*), <0.01 (**), and <0.0001 (****) were considered significant. See Materials and Methods for further details.
FIG 5
FIG 5
Previous M. tuberculosis infection has a limited impact on SARS-CoV-2 infection outcomes. (a) Percent survival at the experimental endpoint (left) and percent change from initial body weights (right) for mice challenged with SARS-CoV-2 4 weeks after infection with M. tuberculosis. Day 0 refers to the day of SARS-CoV-2 challenge. (b) Percent survival and percent of body weight change, similar to panel A, for mice challenged with SARS-CoV-2 8 weeks after infection with M. tuberculosis. All 4-wpi groups contain 5 mice, and 8-wpi groups contain 6 mice, with the exception of the BCG/PBS group, which has 3. The survival curve statistics were calculated using the Kaplan-Meier method, and weight changes were compared on each day using ANOVA, with standard deviations reported for each time point.
FIG 6
FIG 6
Previous M. tuberculosis infection lowers the SARS-CoV-2 burden. (a) Viral loads in murine lungs (PFU per lung) and spleen (genome copy numbers per spleen) from mice sacrificed at the time of death between 5 and 7 days after infection with SARS-CoV-2 and 4 weeks after infection with M. tuberculosis. (b) Viral loads in murine lungs and spleen from mice sacrificed at 4 dpi and at the time of death between 5 and 7 dpi 8 weeks after infection with M. tuberculosis. A log scale was used for all viral loads. P values for normally distributed data were determined using ANOVA, while P values for nonnormally distributed data were determined using a Kruskal-Wallis test. P values of <0.05 (*), <0.01 (**), and <0.0001 (****) were considered significant. See Materials and Methods for further details. Lung viral loads were measured by a plaque assay, while spleen loads were measured by real-time PCR.
FIG 7
FIG 7
SARS-CoV-2 superinfection results in increased dissemination of M. tuberculosis. (a) Bacterial loads in murine lung and spleen (CFU per organ) from mice sacrificed at the time of death between 5 and 7 days after infection with SARS-CoV-2 4 weeks following M. tuberculosis infection. (b) Bacterial loads in the lung, spleen, and liver from mice sacrificed at the time of death between 5 and 7 days after infection with SARS-CoV-2 8 weeks following M. tuberculosis infection. Statistics were calculated using a Mann-Whitney test, and P values of <0.05 (*) were considered significant.
FIG 8
FIG 8
Superinfection results in lesions representative of M. tuberculosis infection but with decreased histiocytic inflammation. Shown are hematoxylin and eosin (H&E)-stained lung sections from M. tuberculosis (TB)- and M. tuberculosis- and SARS-CoV-2 (TB/SARS)-infected mice sacrificed at the time of death between 5 and 7 days after SARS-CoV-2 infection. (a) TB lung at 4 wpi. (b) TB/SARS-CoV-2 lung at 4 wpi. (c) TB lung at 8 wpi. (d) TB/SARS-CoV-2 lung at 8 wpi. (e) Immunohistochemistry (IHC) targeting M. tuberculosis in representative tissue sections of the TB group at 4 wpi. (f) IHC targeting M. tuberculosis in representative TB/SARS-CoV-2 tissue sections at 4 wpi. wpc, weeks postchallenge.
FIG 9
FIG 9
Tuberculosis-superinfected lungs had reduced type 1 responses and increased type 2 responses. (a) Cytokine expression levels 4 weeks after infection with M. tuberculosis following superinfection with SARS-CoV-2 normalized to the levels in the TB-alone group determined by quantitative real-time PCR (qRT-PCR) for key cytokines involved in the pathogenesis of M. tuberculosis- and SARS-CoV-2-infected mice. Each panel indicates one cytokine for the TB-only, TB/SARS-CoV-2, or SARS-CoV-2-alone groups. (b) Cytokine expression levels 8 weeks after infection with M. tuberculosis following superinfection with SARS-CoV-2 normalized to the levels for a naive age-matched mouse determined by qRT-PCR. P values for normally distributed data were determined using ANOVA, while P values for nonnormally distributed data were determined using a Kruskal-Wallis test. P values of <0.05 (*), <0.01 (**), and <0.0001 (****) were considered significant. See Materials and Methods for further details.
FIG 10
FIG 10
Proposed mechanism of M. tuberculosis dissemination. When infected with M. tuberculosis alone, mice develop granulomas that contain bacilli. These granulomas are maintained by a balance that includes higher type 1 and type 17 levels and lower type 2 and type 9 levels. When mice are infected with SARS-CoV-2, this balance is disturbed, resulting in the downregulation of the type 1 cytokines and the upregulation of type 2 and type 9 cells. This results in granuloma dysregulation and bacterial escape and dissemination. (Image created with Biorender.com.)

Similar articles

Cited by

References

    1. World Health Organization. 2011. Global tuberculosis control. WHO Press, Geneva, Switzerland.
    1. World Health Organization. 2021. WHO coronavirus (COVID-19) dashboard. WHO health emergency dashboard. World Health Organization, Geneva, Switzerland.
    1. Musuuza JS, Watson L, Parmasad V, Putman-Buehler N, Christensen L, Safdar N. 2021. Prevalence and outcomes of co-infection and superinfection with SARS-CoV-2 and other pathogens: a systematic review and meta-analysis. PLoS One 16:e0251170. doi:10.1371/journal.pone.0251170. - DOI - PMC - PubMed
    1. Oei W, Nishiura H. 2012. The relationship between tuberculosis and influenza death during the influenza (H1N1) pandemic from 1918-19. Comput Math Methods Med 2012:124861. doi:10.1155/2012/124861. - DOI - PMC - PubMed
    1. Tadolini M, García-García J-M, Blanc F-X, Borisov S, Goletti D, Motta I, Codecasa LR, Tiberi S, Sotgiu G, Migliori GB. 2020. Active tuberculosis, sequelae and COVID-19 co-infection: first cohort of 49 cases. Eur Respir J 56:2002328. doi:10.1183/13993003.02328-2020. - DOI - PMC - PubMed

Publication types

LinkOut - more resources