. 2022 Dec 5;221(12):e202112001.
doi: 10.1083/jcb.202112001. Epub 2022 Oct 6.

Aberrant phosphorylation inactivates Numb in breast cancer causing expansion of the stem cell pool

Affiliations

Aberrant phosphorylation inactivates Numb in breast cancer causing expansion of the stem cell pool

Maria Grazia Filippone et al. J Cell Biol. .

Abstract

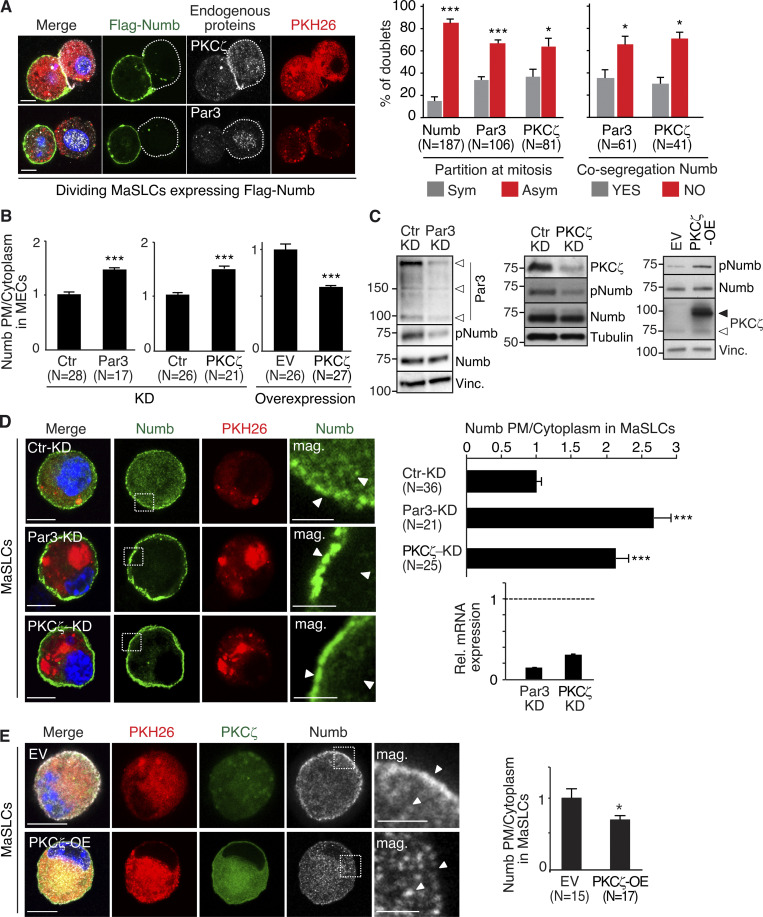
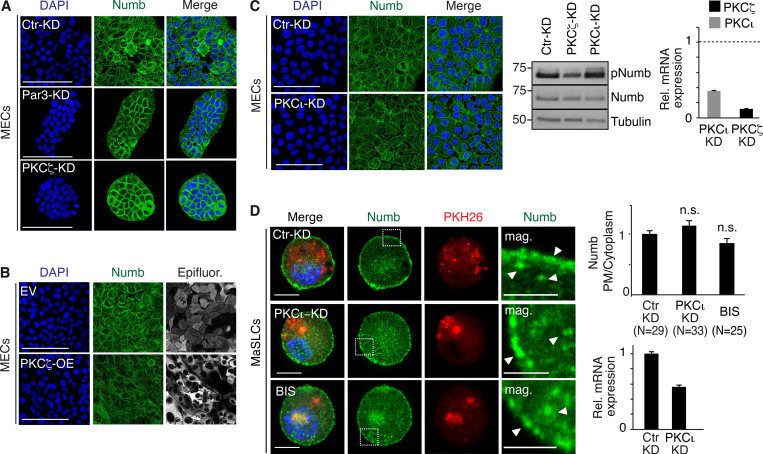
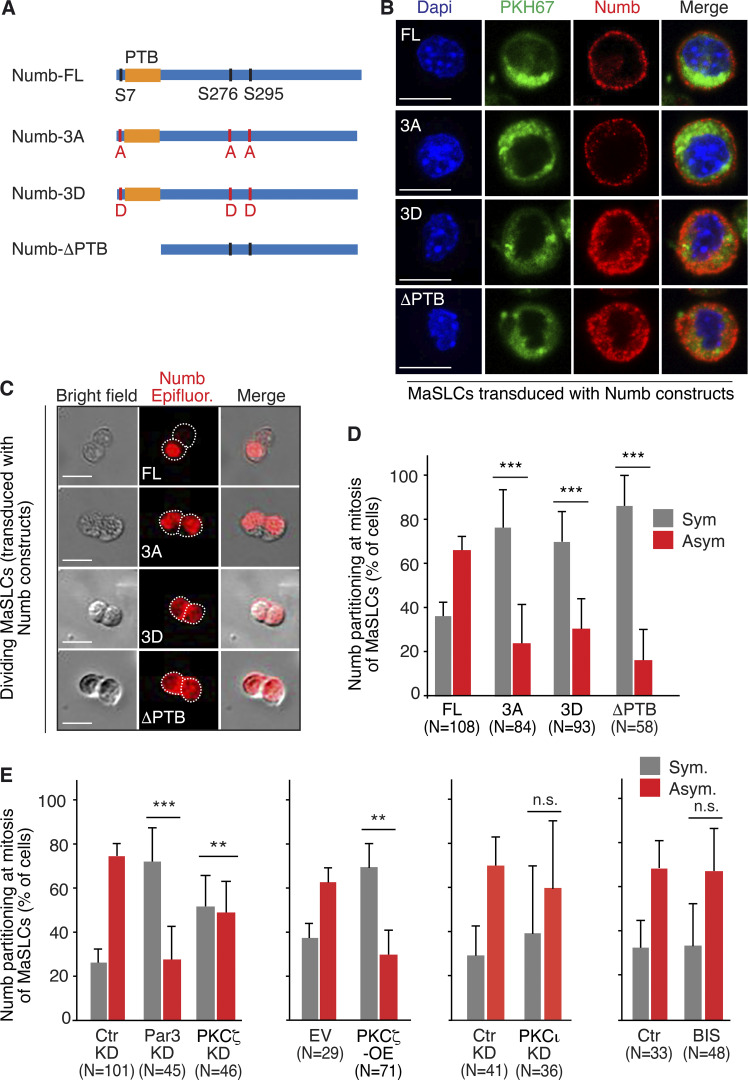
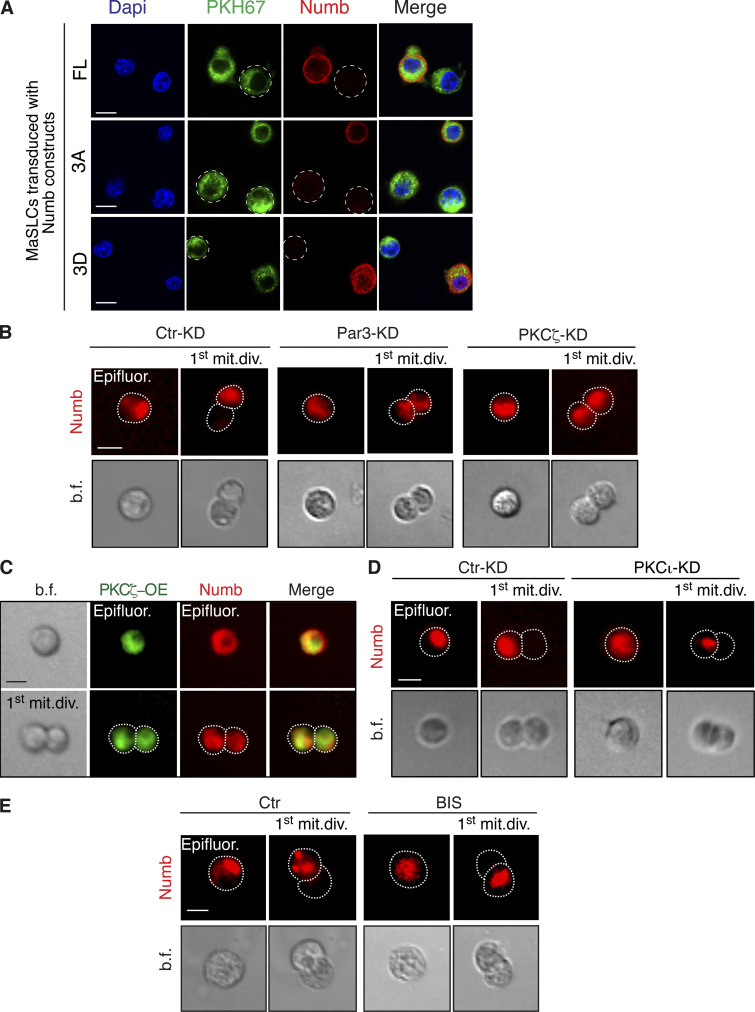
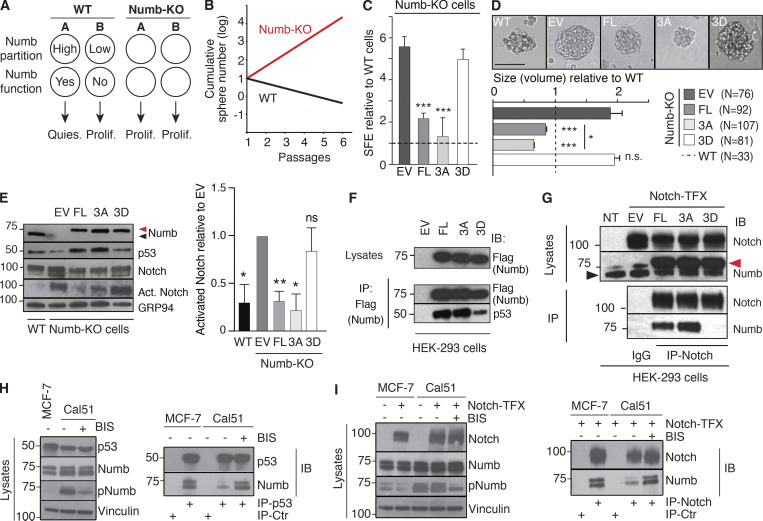
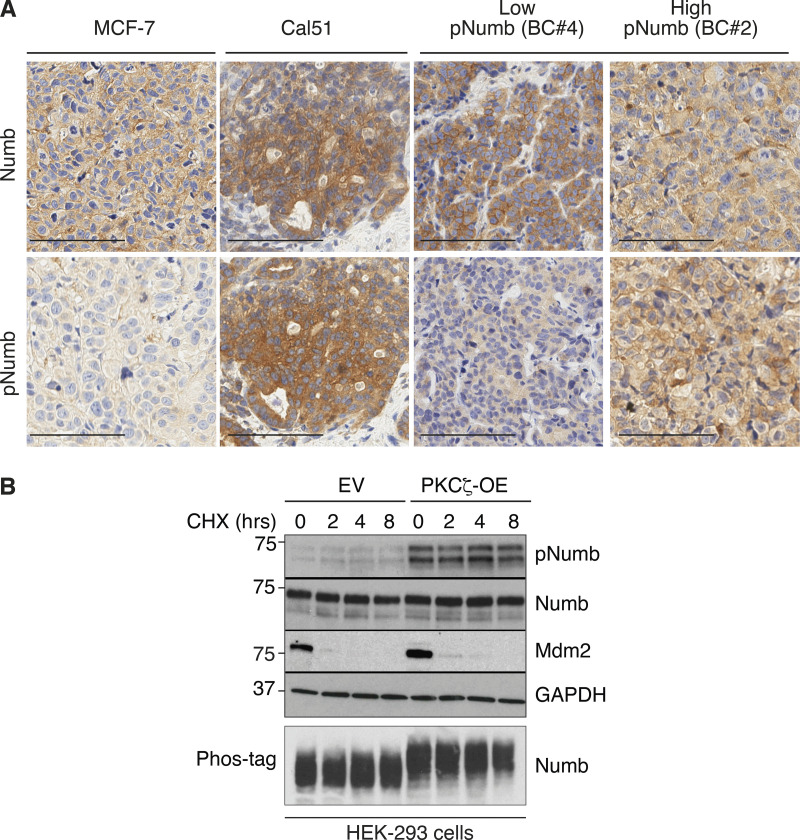
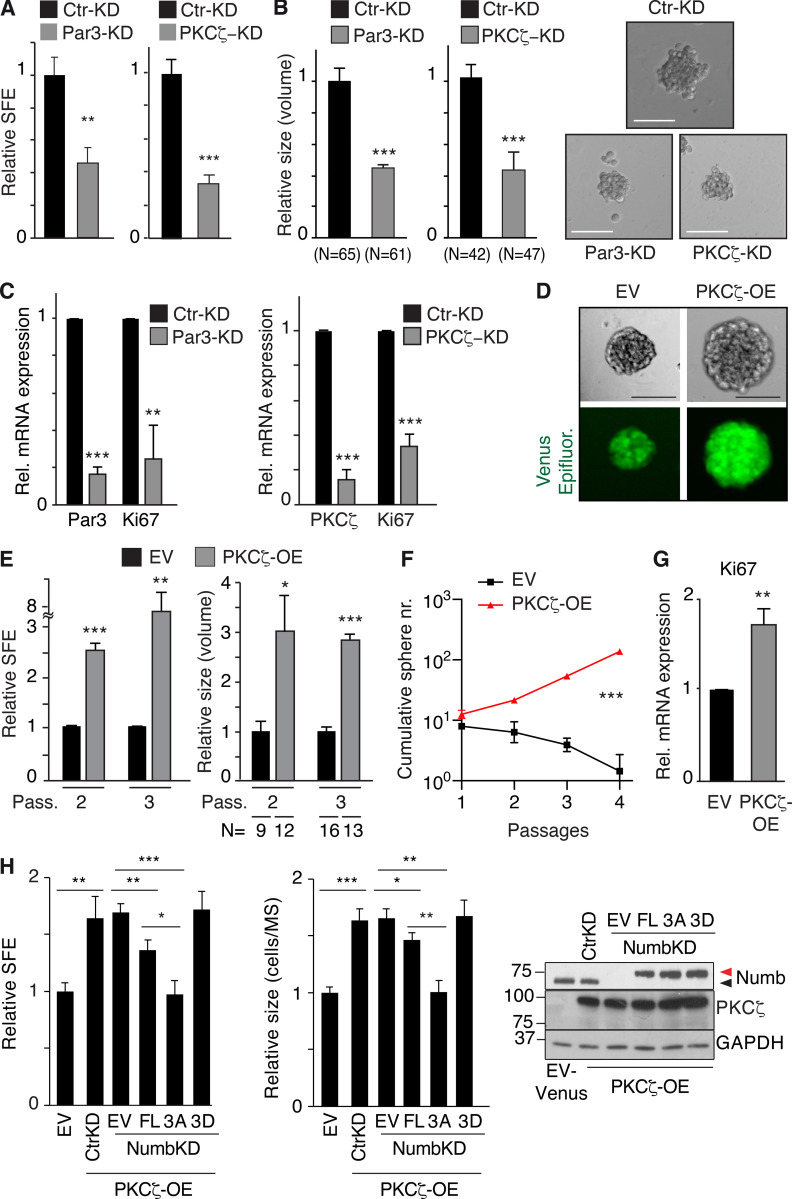
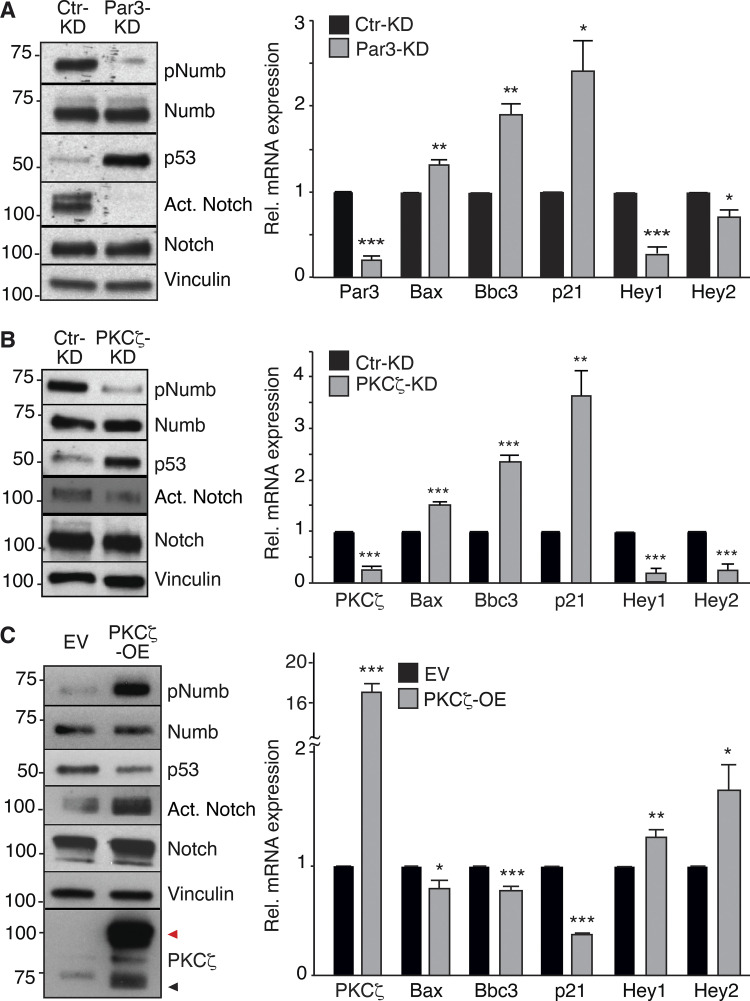
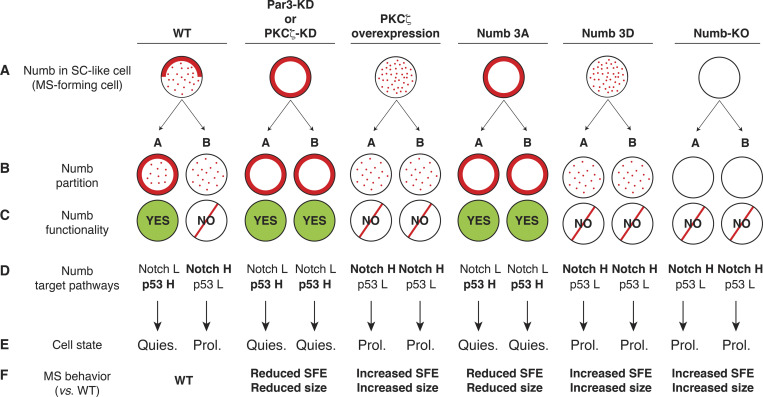
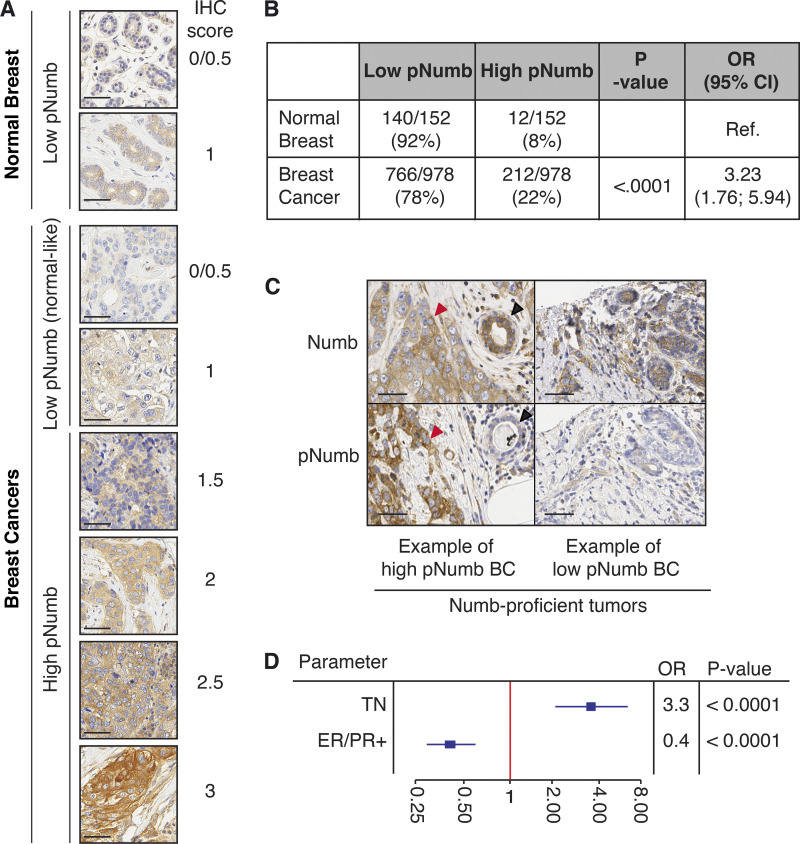
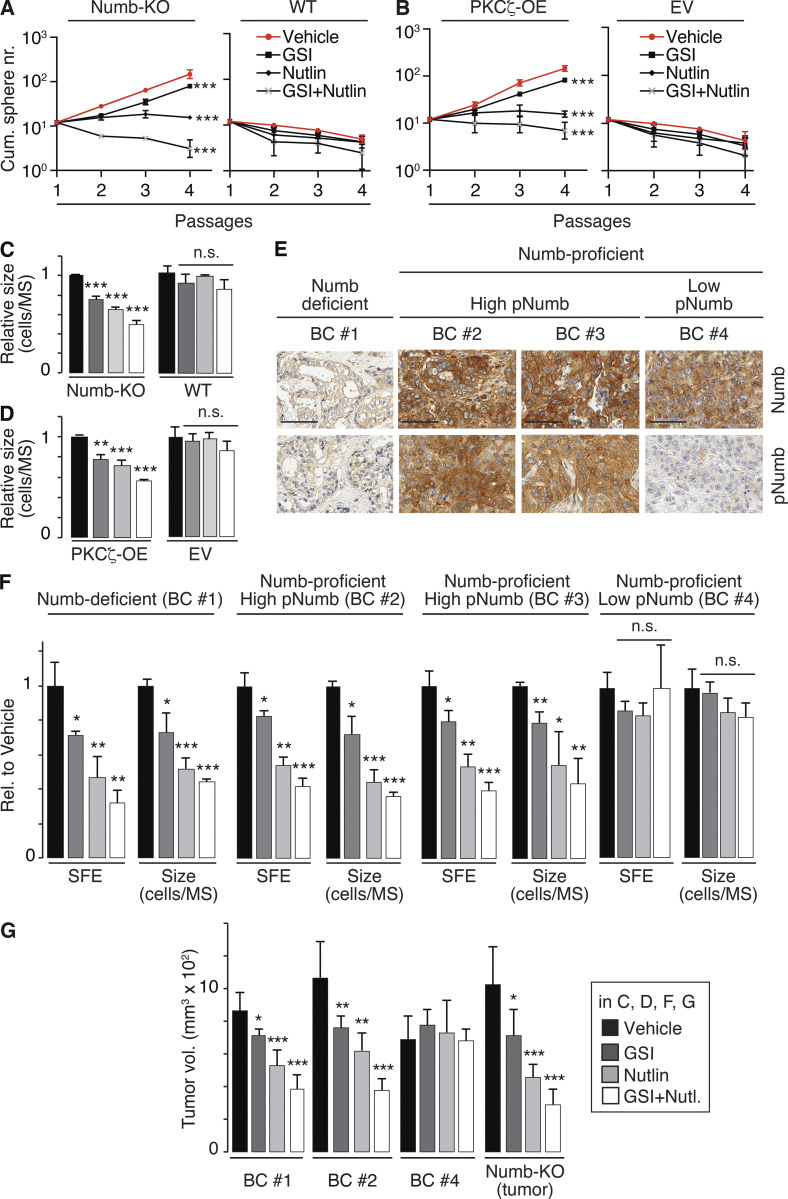
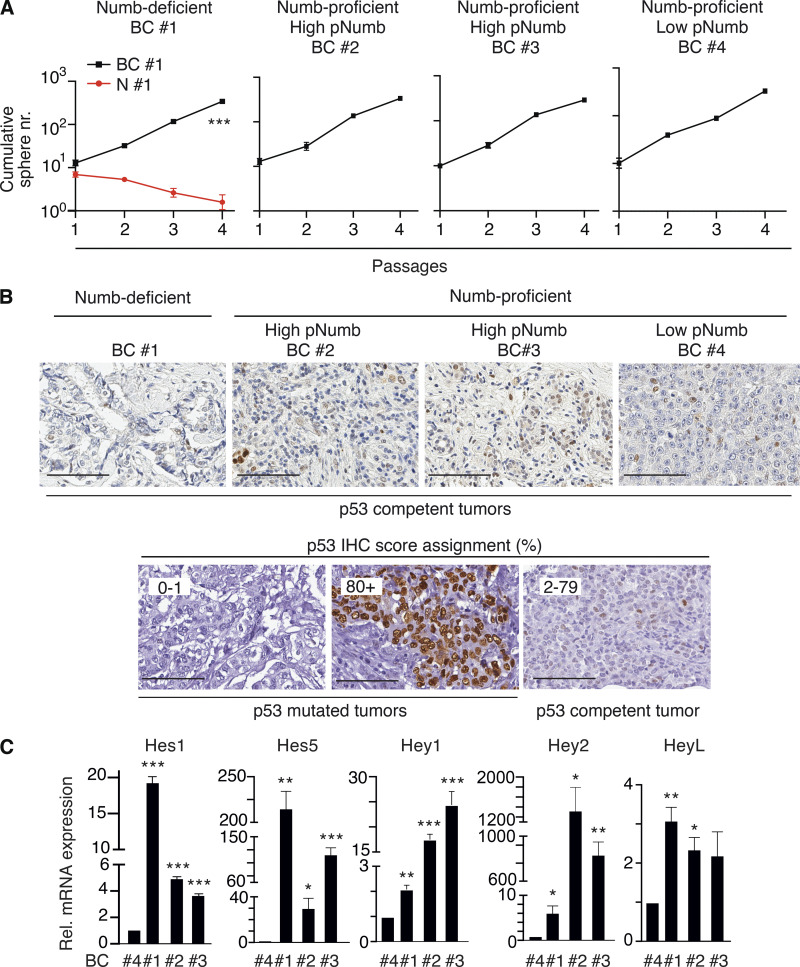
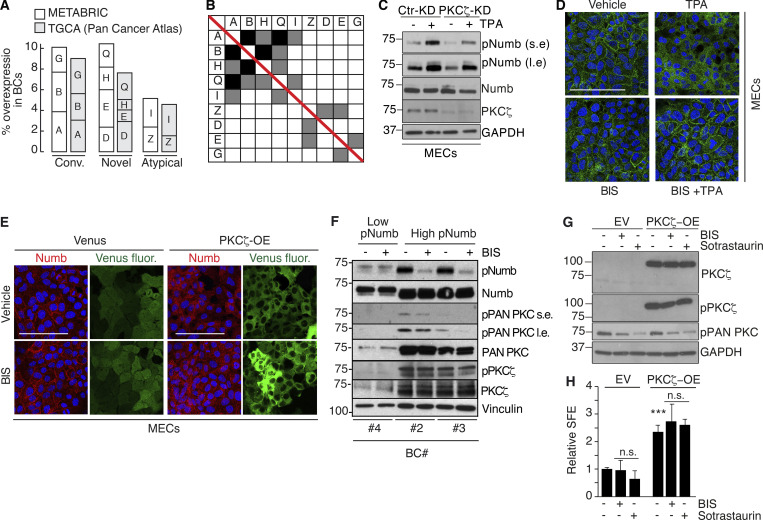
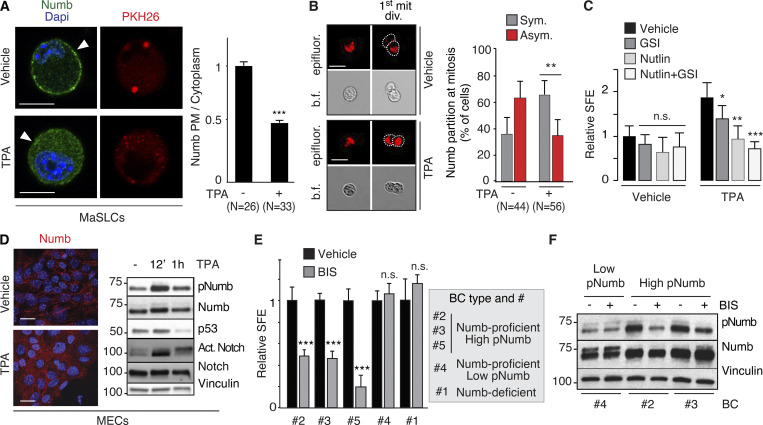
Asymmetric cell division is a key tumor suppressor mechanism that prevents the uncontrolled expansion of the stem cell (SC) compartment by generating daughter cells with alternative fates: one retains SC identity and enters quiescence and the other becomes a rapidly proliferating and differentiating progenitor. A critical player in this process is Numb, which partitions asymmetrically at SC mitosis and inflicts different proliferative and differentiative fates in the two daughters. Here, we show that asymmetric Numb partitioning per se is insufficient for the proper control of mammary SC dynamics, with differential phosphorylation and functional inactivation of Numb in the two progeny also required. The asymmetric phosphorylation/inactivation of Numb in the progenitor is mediated by the atypical PKCζ isoform. This mechanism is subverted in breast cancer via aberrant activation of PKCs that phosphorylate Numb in both progenies, leading to symmetric division and expansion of the cancer SC compartment, associated with aggressive disease. Thus, Numb phosphorylation represents a target for breast cancer therapy.


Figures

Figure 1.
Figure 1.
Par3- and PKCζ-KD affect Numb phosphorylation and localization. (A) Left: MaSLCs (PKHpos cells) expressing Flag-Numb were plated in suspension to allow for their division, fixed, and stained with anti-Flag (green, Flag-Numb), anti-PKCζ or anti-Par3 Ab (white), and DAPI (blue). Bar, 10 µm. Middle: Quantitative analysis of symmetric vs. asymmetric partitioning of the proteins. Right: Quantitative analysis of segregation of Par3 or PKCζ with Numb. Only doublets in which the proteins were segregated asymmetrically were counted. Data are expressed as % of doublets showing Numb/Par3 or Numb/PKCζ co-segregation (YES) or not (NO). (B) Numb (endogenous) subcellular localization in MECs stably silenced (KD) for Par3 (left) or PKCζ (middle) or overexpressing PKCζ-Venus (right; EV, empty vector). Images are in Fig. S1, A and B. Data are expressed as the ratio between plasma membrane (PM) Numb/cytoplasmic Numb, relative to controls (Ctr or EV). (C) Immunoblots (IB) of the indicated cells. pNumb, phosphorylated Numb (anti-NumbSer276 Ab in this and all subsequent figures). Left: Arrows point to three different Par3 isoforms (Dziengelewski et al., 2020; Ishiuchi and Takeichi, 2011). Right: Empty and filled arrows point to endogenous and overexpressed PKCζ-Venus, respectively. (D) Left: MaSLCs (PKHpos cells) stably silenced for Par3 (Par3-KD) and PKCζ (PKCζ-KD) were stained with anti-Numb (endogenous Numb) and DAPI. Bar, 10 μm. The boxed areas are magnified on the right (mag., arrows point to PM and cytoplasmic areas; bar, 3 μm). Right top: Quantitation of the experiment as in B. Right bottom: qPCR of Par3 and PKCζ silencing in MaSLCs, relative to control cells (=1, dashed line). (E) Left: MaSLCs (PKHpos cells) stably overexpressing PKCζ (PKCζ-OE) were stained as shown (Numb, endogenous Numb). Bar, 10 μm. The boxed areas are magnified (mag., arrows point to PM and cytoplasmic areas; bar, 3 μm). Right: Quantitation of the experiment as in B. When shown: N, number of cells analyzed. Data are reported ± SE. Statistical analysis was with the binomial test (A), or with the Student’s t test two-tailed (B, D, and E). P was calculated vs. Ctr or EV, as appropriate: *, <0.05; **, <0.01; *** <0.001, in this and all other figures. Source data are available for this figure: SourceData F1.
Figure S1.
Figure S1.
Additional data to Fig. 1. (A and B) Numb confocal immunofluorescence in mouse MECs stably silenced for Par3 (Par3-KD) and PKCζ (PKCζ -KD) or mock silenced (Ctr-KD; A) or overexpressing Venus (EV) and PKCζ-Venus (PKCζ -OE; B). Numb (green, pseudocolored from Cy3 staining), epifluorescence (gray, pseudocolored from Venus, in EV, and PKCζ-Venus, in PKCζ -OE), DAPI (blue). Bars, 100 µm. (C) Left: Numb confocal immunofluorescence in mouse MECs stably silenced for PKCι (PKCι-KD). Numb (green), DAPI (blue). Bar, 100 µm. Middle: Immunoblots of Numb and pNumb in the cell lysates indicated on top. Tubulin, loading control. Right: qPCR analysis showing the efficacy of PKCι and PKCζ silencing in MaSLCs. Data are expressed relative to control cells (dashed line). (D) Numb confocal immunofluorescence. Left: MaSLCs (PKH26POS cells) from WT mammospheres (MS) stably silenced for PKCι (PKCι-KD), were stained with anti-Numb and DAPI. Control cells were also treated with 3 μm Bisindolylmaleimide I (BIS) o/n and subjected to the same IF. The boxed areas are magnified on the right. PHK26 (red), Numb (green), DAPI (blue). Bar, 10 μm. Mag, magnification (bar, 3 μm). White arrows in magnifications point to PM or cytoplasmic areas. Right (top), quantitation of the experiment. Data are expressed as ratio between plasma membrane (PM) and cytoplasmic Numb, relative to control (N, number of cells analyzed). Right (bottom), qPCR analysis showing the efficacy of PKCι silencing in MaSLCs. Data are expressed relative to control cells ± SE; statistical analysis was with the Student’s t test two-tailed. In this and all subsequent supplementary figures: P is: *, <0.05; **, <0.01; ***, <0.001. Source data are available for this figure: SourceData FS1.
Figure 2.
Figure 2.
Symmetric partitioning of Numb phosphomutants. (A) Numb mutants. The relevant Ser residues (S7, S276, and S295) and the mutations (red) are indicated. (B) MaSLCs (PKHpos cells, green) were transduced (all constructs fused to Flag-tag), stained with an anti-Numb Ab (red), and analyzed. Blue, DAPI. Bar, 10 μm. (C) Mammospheres (MS) transduced with the indicated constructs (DsRed fusion proteins) were dissociated and single cells were analyzed by time-lapse video microscopy. Epifluorescence (red). Bar, 10 μm. (D) Quantitation of the experiment in C, showing the frequency of symmetric (Sym) vs. asymmetric (Asym) partitioning. Significance was calculated vs. Numb-FL. (E) MS were transduced with Numb-DsRed (all panels) and then silenced as indicated (KD), or transduced with PKCζ (PKCζ-OE), or treated with BIS (3 μM). Cells were then analyzed as in C and D. P was calculated vs. matching control condition (Ctr-KD, EV or Ctr). When shown: N, number of doublets analyzed. Data are reported ± SD. Statistical analysis was with the nonparametric Fisher’s exact test.
Figure S2.
Figure S2.
Additional data to Fig. 2. (A) Data in Fig. 2 A were obtained by anti-Numb staining on cells transduced with various Numb mutants, in the presence of endogenous Numb. This control figure (taken from the same experiment presented in Fig. 2 B) shows that, under the conditions of image acquisition employed, only the transduced Numb is visible, while in the non-transduced cells (dashed circles) there is little endogenous Numb detected. Bar, 10 μm. (B–E) MS stably (transduced with Numb-FL-DsRed) silenced for Par3 (Par3-KD) or PKCζ (PKCζ-KD; B), or overexpressing PKCζ (PKCζ-OE; C), or silenced for PKCι (PKCι-KD; D), were dissociated and partitioning of Numb at first MaSLC mitosis was analyzed by time-lapse video microscopy. Control cells were also treated with 3 μm Bisindolylmaleimide I (BIS) (at cell plating) and subjected to the same analysis (E). Representative images at the 1st MaSLC mitotic division (1st mit.div.) are shown. Epifluor., Epifluorescence, Numb (red), PKCζ (green); b.f., bright-field. Bar, 10 μm.
Figure 3.
Figure 3.
Characterization of Numb phosphomutants. (A) Scheme showing the behavior of a SC (A) and daughter progenitor cell (B) in WT vs. Numb-KO (Tosoni et al., 2015). (B) Scheme of the growth of MS from WT and Numb-KO MECs (Tosoni et al., 2015). (C and D) WT and Numb-KO cells, transduced with the indicated constructs (DsRed fusion proteins; EV, empty vector), were assessed for SFE (C, by counting only red cells or MS) and size (D, N = number of epifluorescent MS analyzed). Results are expressed relative to WT cells (see also Table S2). Significance was calculated vs. EV cells. Representative images of the MS are in D, top panel. Bar, 100 µm. (E) WT and Numb-KO MS, transduced with the indicated constructs (Flag-tagged), were analyzed by IB. Arrows, endogenous (black) or overexpressed (red) Numb (also in G). Activated Notch (Act. Notch) was detected with the anti Val1744 Ab (in this and all subsequent figures). Right: Quantitation of three independent experiments. (F) HEK-293 cells, transfected as indicated (all Numb constructs were Flag-tagged and also codify for an sh-RNA sequence against endogenous Numb; EV, empty vector), were IP and IB as shown. (G) HEK-293 cells were stably transduced with Notch-NΔE (Notch-TFX; NT, not transfected) and transfected with the indicated Numb-Flag constructs (as in F). IP and IB were as shown. (H and I) MCF-7 or Cal51 cells were either transduced with Notch-NΔE (Notch-TFX; I) or not (H). Cells were treated with BIS (or mock-treated) and IP and IB as shown. In H, IP-Ctr is anti-Flag; in I, IP-Ctr is goat IgG. Data are reported ± SD (C and E) or ± SE (D). Statistical analysis was with the Student’s t test two-tailed (C and D) or with the one-sample t test (E). Source data are available for this figure: SourceData F3.
Figure S3.
Figure S3.
Additional data to Fig. 3. (A) The two breast cancer cell lines, MCF-7 and Cal51 used in Fig. 3, H and I, were grown as xenografts and stained for Numb and pNumb in IHC, in comparison to two PDXs from Numb-competent tumors displaying low pNumb (BC #4) and high pNumb (BC #2; the BCs in object are described in details in Fig. 8) to provide additional proof that they are representative of the situation occurring in real breast cancers. Bar, 100 μm. (B) The phosphorylation of Numb executed by PKCζ does not appreciably affect the half-life of Numb. HEK-293 cells were transduced with Venus (EV) or PKCζ-Venus (PKCζ -OE), as shown on the top, and then treated with cycloheximide (CHX, 50 μg/ml) for the indicated lengths of time. Lysates were immunoblotted as shown (top four panels). Mdm2 was used as control for a short half-lived protein. GAPDH is a loading control. In the lower panel (Phos-tag), the lysates were fractionated on an 8% Phos-tag gel (see Materials and methods) and then IB with anti-Numb. The nearly complete shift on Numb in the PKCζ-OE cells indicates that the phosphorylation of Numb executed by PKCζ is nearly stoichiometric. Source data are available for this figure: SourceData FS3.
Figure 4.
Figure 4.
Effects of Par3/PKCζ perturbation on MaSLC. (A–C) MECs silenced for Par3 (Par3-KD) or PKCζ (PKCζ-KD) were assessed for: (A) SFE; (B) MS size (the rightmost panels show representative images; Bar, 100 µm); and (C) Par3, PKCζ KD and Ki67 expression by qPCR analysis. Data are relative to control cells (see also Table S2). (D) Cells from WT MS were transduced with control Venus (EV) or PKCζ-Venus (PKCζ-OE); Epifluorescence (green). Bar, 100 µm. (E–G) Cells, as in D, were assessed for SFE, at the indicated passages (Pass; E left, data are relative to EV) or MS size (E right, data are relative to EV, see also Table S2), or cumulative sphere number (nr) in serial replating experiments (F), or Ki67 expression by qPCR (data are relative to EV; G). (H) Cells from WT MS were stably transduced with Venus- (EV) or PKCζ-Venus (PKCζ-OE). PKCζ-OE cells were then transduced with the indicated Numb-mutants (Flag-tagged) or control vector (EV) and cells were further silenced or not for Numb expression, as shown. Cells were assessed for SFE (left, data are relative to EV, see also Table S2), MS size (middle, data are relative to EV, see also Table S2) or protein expression (right; arrows, endogenous [black] or overexpressed [red] Numb proteins). When shown: N, number of MS analyzed. Data are reported ± SE (A, B, C, E, and G) or ± SD (F and H). Statistical analysis was with the ANOVA test (F), or with the Student’s t test two-tailed (A, B, C, E, G, and H). Significance was calculated vs. Ctr-KD or EV. Source data are available for this figure: SourceData F4.
Figure 5.
Figure 5.
Effects of Par3/PKCζ perturbation on Notch and p53 signaling. (A–C) Left: IB in Par3-KD, PKCζ-KD, and PKCζ-OE MECs. Black and red arrows point to endogenous and overexpressed PKCζ (Venus-tagged), respectively. Right: qPCR analysis of the indicated genes (p53 targets: Bax, Bbc3, p21; Notch targets: Hey1, Hey2). Data are relative to mRNA levels in control cells (=1) and are reported ± SE. Statistical analysis was with with the Student’s t test two-tailed. In all panels, significance was calculated vs. Ctr-KD or EV. Source data are available for this figure: SourceData F5.
Figure 6.
Figure 6.
A model for the effects of Numb perturbations. The cartoon shows various conditions of Numb perturbations. (A) The localization of Numb immediately before the mitosis of the MaSLC is shown (solid line, Numb associated with the PM; dots, Numb released in the cytoplasm). After mitosis, the two daughters are indicated as A and B. (B) The partition of Numb in the two daughters is shown. (C) The functionality of Numb (as the result of its phosphorylation status) is shown. (D) The effects of on the p53 and Notch pathways is shown. H, high activity; L, low activity. (E) The predicted state (Quies., quiescent; Prol., proliferating) of the two daughters is shown. Note that only in the WT condition, an asymmetric fate is obtained. (F) Prediction of the effects on MS growth.
Figure 7.
Figure 7.
Clinical relevance of pNumb in human BCs. (A) IHC of pNumb in normal and tumor breast tissues, with IHC scores. Bars, 50 µm. (B) Analysis of pNumb (low pNumb, IHC ≤ 1; high pNumb, IHC > 1). OR, odd ratio, CI, confidence interval. (C) Representative IHC images of Numb and pNumb status in a high pNumb and a low pNumb BC. Both tumors are Numb-proficient (Numb IHC ≥ 2, top panels). In the high pNumb BC, the tumor (red arrow) is pNumb high, while a normal gland (black arrow) is pNumb low. Bar. 50 µm. (D) Forest Plot of association between high pNumb and some clinical and pathological parameters. TN, triple-negative BCs, ER/PR+, estrogen and progesterone receptor positive BCs. OR, odds ratio. The complete set of data is in Table S4. In B and D, statistical analysis was with the nonparametric Fisher’s exact test.
Figure 8.
Figure 8.
Numb phosphorylation in the SC compartment in BCs. (A and B) MS serial propagation assay under the shown drug treatments in: (A) Numb-KO MS vs. WT MS; (B) PKCζ-OE MS vs. EV MS (empty vector). (C and D) Cells, as in A and B, were evaluated for SFE and MS size (expressed relative to vehicle, see also Table S2). (E) IHC images of Numb and pNumb in the primary BCs used to generate the PDX-derived primary cultures for the experiments in F and G. Bar, 70 µm. (F) SFE and MS size of the indicated primary cultures, under various pharmacological treatments, expressed relative (Rel.) to vehicle. (G) Tumor cells from the indicated BC primary cultures or from a tumor that formed in a Numb-KO mouse, were treated ex vivo with the indicated drugs and orthotopically transplanted (50,000 cells per injection) in immunocompromised NOD/SCID mice (6/group). In all panels: GSI-IX (GSI), 10 μM; Nutlin-3 (Nutlin) 10 μM; GSI + Nutlin (10 μM each) for the duration of the experiments, except for G, in which cells were treated for 72 h before being injected. In all panels data are reported ± SD. Statistical analysis was with the ANOVA test (A and B) or with the Student’s t test two-tailed (C, D, F, and G).
Figure S4.
Figure S4.
Additional data to Fig. 8. (A) Serial MS assay of the cells from the BC PDXs employed in the experiments shown in Fig. 8, F and G. Results are reported ± SD. A normal counterpart of BC #1 (N#1) is also reported (red line). P, *** = < 0.001 by ANOVA test. (B) Top panels: Representative images of p53 status in FFPE samples of the BCs analyzed in Fig. 8 E. Bottom panels: The scale of p53 IHC staining used in representative BC tumors. BCs were classified into three groups according to the p53 nuclear staining (see also Materials and methods and Alsner et al., 2008; Colaluca et al., 2018; Yemelyanova et al., 2011): 0–1, 0–1% positive nuclei (indicative of complete loss of p53 protein/nonsense mutations); 2–79, 2–79% positive nuclei (indicative of WT levels of p53); 80+, positive p53 nuclei ≥80% (indicative of missense mutations of p53). Bar, 100 μm. (C) The indicated BCs (see Fig. 8 for detailed descriptions) were analyzed by qPCR for the indicated Notch pathway targets. Data are expressed (±SE) relative to mRNA levels in BC #4 (=1; BC #4 is a Numb-proficient, low-pNumb BC). In C, significance was calculated with the Student’s t test two-tailed, vs. BC #4.
Figure S5.
Figure S5.
Additional data to Fig. 9. (A and B) Overexpression of PKC isoforms in human breast cancers. (A) The overexpression of PKC isoforms was evaluated in the METABRIC and TGCA (Pan Cancer Atlas) BC datasets, as described in Materials and methods. Parameters used were: mRNA expression z-scores relative to all samples (log microarray); z-score threshold + 2.0. The percentage of alterations in the two datasets (METABRIC, N = 1904; TGCA, N = 994) is reported for the three classes of PKCs and further subdivided for each gene (A, PRKCA or α; B, PRKCB or β; G, PRKCG or γ; D, PRKCD or δ; E, PRKCE or ε; H, PRKCH or η; Q, PRKCQ or θ; Z, PRKCZ or ζ; I, PRKCI or ι). (B) Matrix showing the co-occurrence of overexpression of PKC isoforms. The matrix shows the co-occurrence (P < 0.05 by one-tailed Fisher’s exact test). Color code: black, co-occurrence in both datasets (METABRIC and TGCA); gray, co-occurrence in only one dataset. (C–H) Various controls for the specificity of the effects of TPA and of PKC inhibitors. (C) The indicated MEC transfectants were stimulated with TPA (1 μM for 12′) followed by IB with the indicated Ab. GAPDH is a loading control. S.e, short exposure; l.e, long exposure. The blot shows that also in the absence of PKCζ, TPA can efficiently phosphorylate Numb. (D) Numb confocal immunofluorescence in mouse MECs treated with TPA (1 μM TPA, 12 min), BIS (3 μM, 6 h) or a combination of TPA + BIS. In the combination treatment, cells were pretreated with BIS for 6 hr and then induced with TPA for 1 μM TPA for 12 min. Numb (green), DAPI (blue). Bar, 100 µm. (E) Numb confocal immunofluorescence in mouse MECs stably overexpressing Venus (Venus) or PKCζ-Venus (PKCζ -OE) treated with BIS (3 μM, 6 h). Numb (red), epifluorescence (Venus), DAPI (blue). Bars, 100 µm. (F) The indicated BC cultures were treated or not with BIS (3 μM o/n) and immunoblotted as shown on the right. Vinculin, loading control; l.e., long exposure. The figure shows that in BC displaying high pNumb, BIS significantly reduces the level of pNumb. (G) MS from WT mice were dispersed and infected with Venus (EV) or PKCζ-Venus (PKCζ -OE), and treated with BIS (3 μM o/n) or Sotrastaurin (0.5 μM o/n), another PKC inhibitor (Albert et al., 2022) and subjected to IB as indicated. (H) Cells as in G were treated with BIS (3 μM for the duration of the experiment) or Sotrastaurin (0.5 μM for the duration of the experiment), and subjected to a MS assay, as indicated. Data are expressed relative to control (EV untreated) cells ± SD (see also Table S2). Statistical analysis was with the Student’s t test two-tailed. The combined results of G and H show that treatment with two different PKC inhibitors cannot revert the biochemical and biological effects of PKCζ -OE. Source data are available for this figure: SourceData FS5.
Figure 9.
Figure 9.
PKCs and Numb phosphorylation in human BCs. (A) Left: MaSLCs (PKHpos cells) were treated with 1 μM TPA (12 min) and stained with anti-Numb and DAPI. PHK26 (red), Numb (green), DAPI (blue). Arrowheads point to PM. Bar, 10 μm. Right: Quantitation of experiment, data are expressed as the ratio between plasma membrane (PM) Numb and cytoplasmic Numb, relative to vehicle. (B) Left: Numb partitioning at mitosis of MaSLCs (1st mit. div.), treated as indicated (TPA, 1 μM for the duration of the experiment). Bar, 10 μm. b.f., bright-field.; epifluorescence (red). Right: Quantitation of the experiment, showing the frequency of symmetric (Sym) vs. asymmetric (Asym) partitioning of Numb. (C) SFE of mouse WT MECs treated as indicated (TPA treatment as in B, other drugs as in Fig. 8); data are relative to Vehicle control (see also Table S2). (D) Left: Numb confocal immunofluorescence in MECs treated with TPA as in A. Numb (red), DAPI (blue); Bar, 20 μm. Right: IB of MECs treated with TPA (1 μM) for the indicated time. (E) SFE, in the presence of BIS of the indicated BC primary cultures. (F) The indicated BC primary cultures were treated with BIS (3 μM o/n) and IB as shown. When shown: N, number of cells or doublets analyzed, as appropriate. Data are reported ± SD (B, C, and E) or ± SE (A). Statistical analysis was with the nonparametric Fisher’s exact test (B) or with the Student’s t test two-tailed (A, C, and E). Source data are available for this figure: SourceData F9.

References

    1. Albert, V., Piendl G., Yousseff D., Lammert H., Hummel M., Ortmann O., Jagla W., Gaumann A., Wege A.K., and Brockhoff G.. 2022. Protein kinase C targeting of luminal (T-47D), luminal/HER2-positive (BT474), and triple negative (HCC1806) breast cancer cells in-vitro with AEB071 (Sotrastaurin) is efficient but mediated by subtype specific molecular effects. Arch. Gynecol. Obstet. 306:1197–1210. 10.1007/s00404-022-06434-2 - DOI - PMC - PubMed
    1. Alsner, J., Jensen V., Kyndi M., Offersen B.V., Vu P., Borresen-Dale A.L., and Overgaard J.. 2008. A comparison between p53 accumulation determined by immunohistochemistry and TP53 mutations as prognostic variables in tumours from breast cancer patients. Acta Oncol. 47:600–607. 10.1080/02841860802047411 - DOI - PubMed
    1. Assender, J.W., Gee J.M.W., Lewis I., Ellis I.O., Robertson J.F.R., and Nicholson R.I.. 2007. Protein kinase C isoform expression as a predictor of disease outcome on endocrine therapy in breast cancer. J. Clin. Pathol. 60:1216–1221. 10.1136/jcp.2006.041616 - DOI - PMC - PubMed
    1. Babaoglan, A.B., O’Connor-Giles K.M., Mistry H., Schickedanz A., Wilson B.A., and Skeath J.B.. 2009. Sanpodo: A context-dependent activator and inhibitor of notch signaling during asymmetric divisions. Development. 136:4089–4098. 10.1242/dev.040386 - DOI - PMC - PubMed
    1. Bellaiche, Y., Radovic A., Woods D.F., Hough C.D., Parmentier M.L., O’Kane C.J., Bryant P.J., and Schweisguth F.. 2001. The partner of inscuteable/Discs-large complex is required to establish planar polarity during asymmetric cell division in Drosophila. Cell. 106:355–366. 10.1016/s0092-8674(01)00444-5 - DOI - PubMed

Publication types