. 2022 Oct 6:11:e79915.
doi: 10.7554/eLife.79915.

Dynamic allostery in substrate binding by human thymidylate synthase

Affiliations

Dynamic allostery in substrate binding by human thymidylate synthase

Jeffrey P Bonin et al. Elife. .

Abstract

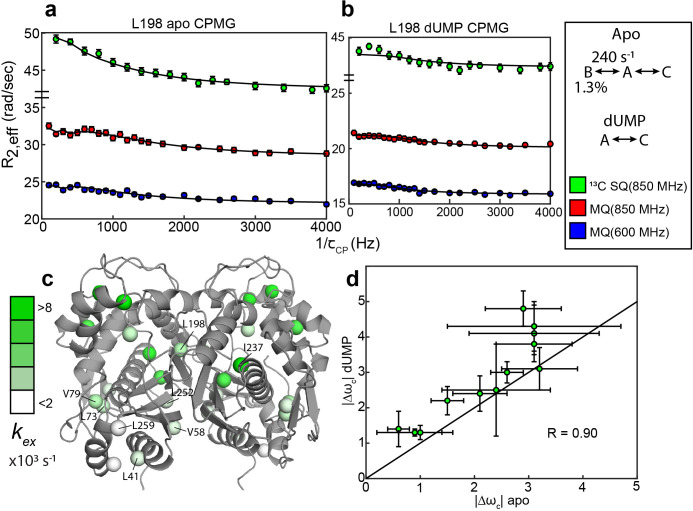
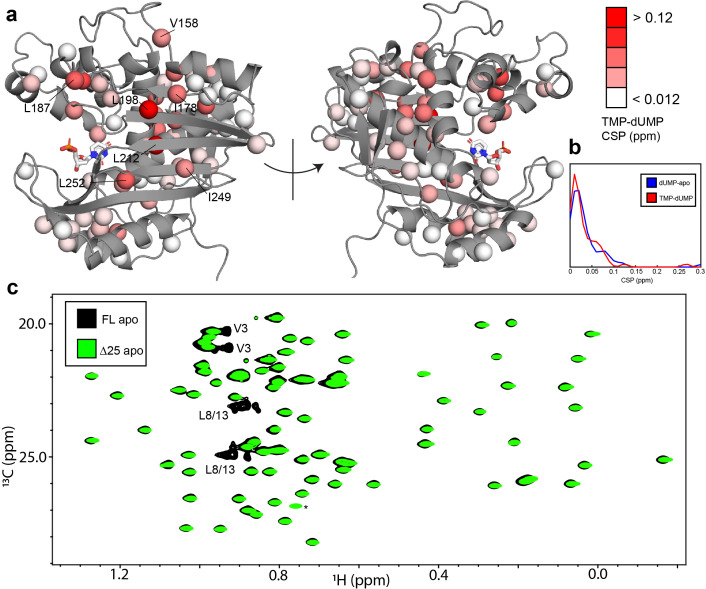
Human thymidylate synthase (hTS) is essential for DNA replication and therefore a therapeutic target for cancer. Effective targeting requires knowledge of the mechanism(s) of regulation of this 72 kDa homodimeric enzyme. Here, we investigate the mechanism of binding cooperativity of the nucleotide substrate. We have employed exquisitely sensitive methyl-based CPMG and CEST NMR experiments enabling us to identify residues undergoing bifurcated linear 3-state exchange, including concerted switching between active and inactive conformations in the apo enzyme. The inactive state is populated to only ~1.3%, indicating that conformational selection contributes negligibly to the cooperativity. Instead, methyl rotation axis order parameters, determined by 2H transverse relaxation rates, suggest that rigidification of the enzyme upon substrate binding is responsible for the entropically-driven cooperativity. Lack of the rigidification in product binding and substrate binding to an N-terminally truncated enzyme, both non-cooperative, support this idea. In addition, the lack of this rigidification in the N-terminal truncation indicates that interactions between the flexible N-terminus and the rest of the protein, which are perturbed by substrate binding, play a significant role in the cooperativity-a novel mechanism of dynamic allostery. Together, these findings yield a rare depth of insight into the substrate binding cooperativity of an essential enzyme.

Keywords: NMR; allostery; conformational entropy; cooperativity; human; molecular biophysics; protein dynamics; structural biology; thymidylate synthase.


Conflict of interest statement

JB, PS, AL No competing interests declared

Figures

Figure 1.
Figure 1.. Apo hTS undergoes a slow, concerted motion which is likely exchange between active and inactive conformations.
(a) 13C CEST profile of L198 in apo hTS at 25 Hz spin lock power (Figure 1—source data 2) with curve from the global fit. The CEST experiment is essentially only sensitive to the slower, concerted process. (b) Structure of apo hTS (active conformation, PDB ID 5X5A) showing the 10 probes involved in the slow, concerted motion. Many of these probes, including L101, L121, L131, L187, L192, and L198 are within or adjacent to the regions highlighted in (c) which show large changes between the active and inactive conformations. (c) Overlay of active (PDB ID 5X5A) and inactive (PDB ID 1YPV, residues 108–129 modelled in) structures of hTS. Substrates dUMP and mTHF are included in sticks. Red and blue colors highlight the areas that are most different between the two conformations, including the active site loop (residues 181–196) which undergoes a 180° flip (box on right) and the ‘extended loop’ (residues 100–135, most of which lack electron density in the inactive structure).
Figure 1—figure supplement 1.
Figure 1—figure supplement 1.. CPMG and CEST profiles from concerted process probes.
Profiles and overlaid fit curves (kinetic model given next to residue name) are shown for CPMG (left, all 3 datasets) and CEST (right, 25 Hz spin lock only) for several probes involved in the slow, concerted process.
Figure 2.
Figure 2.. Apo and dUMP-bound hTS undergo faster motion with heterogeneous rates and populations.
(a) CPMG profiles in the global fit, including 13C SQ at 850 MHz (green), MQ at 850 MHz (red), and MQ at 600 MHz (blue), for L198 in apo hTS using a bifurcated 3-state model (Figure 2—source data 1–4). This fit also includes CEST datasets at two spin lock powers (Figure 1—source data 1 and 2). Error bars are based on duplicate point RMSD (see Materials & Methods). (b) Global fit of three CPMG datasets for L198 in dUMP-bound hTS to a 2-state model (Figure 2—source data 5–8). The color scheme is the same as in (a). (c) Probes with reasonably well-defined exchange rates are displayed on the apo active structure of hTS (PDB ID 5X5A) with the color gradient indicating the kex value (for 3-state probes, the exchange rate of the faster process is used). (d) 13C |Δω| values for apo (faster process) and dUMP-bound states are shown. A strong correlation between these values is observed, suggesting that the excited state being accessed is similar in both cases. Error bars are based on fits of 200 Monte Carlo simulated datasets (see Materials & Methods).
Figure 3.
Figure 3.. Solvent PREs show that many buried faster-motion probes have enhanced solvent exposure.
(a) Plot of 1 – [Intensity (2 mM Gd)/Intensity (0 mM Gd)] (Figure 3—source data 1) as a function of the depth of the probe in the active structure as measured in Δ25 hTS (which possesses faster motion only). Much of the data, to a reasonable approximation, follow a r-6 dependence (black curve) analogous to what is seen when the relaxation rates themselves are measured (Clore and Iwahara, 2009). However, there are also a number of probes that appear to have a 1 – Intensity Ratio value that is significantly elevated relative to their depth (dashed box, blue). Interestingly, many probes also possess the faster µs-ms motion (purple). Of the rest of the probes possessing the faster motion (red), only four have low 1-Intensity Ratio values (*). (b) All the probes from (a) are displayed on the active structure, following the same color scheme. Notably, the blue probes (enhanced solvent exposure, but no dispersion seen in our CPMG) tend to be near red/purple probes, suggesting that they may also be involved in the faster processes, or that those processes simply enable solvent to get closer to these probes. In addition, the gray probes (neither fast motion nor enhanced exposure) cluster together. Together, these results suggest that the faster motion generally involves accessing configurations in which these probes are closer to the surface of hTS, which we call ‘exposed states’.
Figure 3—figure supplement 1.
Figure 3—figure supplement 1.. sPRE analysis using SADIC 3D atom depth index yields similar result as 1D depth.
(a) Intensity (2 mM Gd)/Intensity (0 mM Gd) is plotted as a function of 3D atom depth index, where a low value of the index indicates that the residue is buried. Dashed lines (arbitrarily drawn) separate ‘normal’ intensity ratios values at a given depth index from those which are noticeably lower in intensity ratio at the same depth index. Color coding is the same as in Figure 3. Probes showing the faster motion that lacked enhanced solvent exposure based on the 1D depth analysis are again marked with asterisks here. (b) Probes are shown on the active structure of hTS using the same color scheme as in (a). As in the 1D depth analysis, we find that probes which have both the faster motion and enhanced solvent exposure (purple) are located around the substrate binding site and the extended loop. Additionally, probes which have enhanced solvent exposure but do not show the faster motion (blue) are generally close to the purple probes. Probes which have neither the faster motion nor enhanced solvent exposure generally cluster together as well. This anaylsis, like the 1D depth analysis, highlights the active site and extended loop as regions of the protein where the faster motion may involve accessing configurations in which these probes are more exposed to the solvent, which we call ‘exposed states’.
Figure 4.
Figure 4.. RDCs demonstrate that the ground state of apo hTS is the active conformation.
Plots show agreement between experimentally observed RDCs (Figure 4—source data 1–3) and RDCs calculated from a given structure using a fit alignment tensor. From left to right: Observed apo RDCs with RDCs calculated with the apo active structure (PDB ID 5X5A), observed apo RDCs with RDCs calculated with the apo inactive structure (PDB ID 1YPV), and observed dUMP-bound RDCs with RDCs calculated with the dUMP-bound structure (PDB ID 5X5D). Black lines showing y=x are included to guide the eye. The agreement between the experimental data and the active structure is significantly better than the agreement between the data and the inactive structure; this is supported by the large difference in correlation coefficient between the two cases. In addition, the agreement between the apo RDCs and the active structure is comparable to the agreement between the dUMP-bound RDCs and the dUMP-bound structure. Error bars are based on propagation of 1.5x base plane noise in signal intensities through calculation of the coupling.
Figure 4—figure supplement 1.
Figure 4—figure supplement 1.. 1313C Δω’s for the concerted process do not agree with 13C chemical shift perturbations upon dUMP binding.
13C chemical shift perturbations (CSPs) upon dUMP binding, ωC,dUMP-ωC,apo , and 13C Δω in the apo enzyme are shown for the 10 probes involved in the concerted process. The solid black line is drawn at y=x to guide the eye. For these probes, as is the case for the protein as a whole, the 13C CSPs upon dUMP binding are generally small. 8 of the 10 probes involved in the concerted process have –0.1 ppm < 13C CSP <0.2 ppm, as indicated by the dashed black lines, while their 13C Δω’s are as large as 1.4 ppm. This is consistent with the idea that the apo enzyme is already in the dUMP bound-like active conformation, and that the minor state being accessed in this concerted process is the inactive conformation (structurally distinct from the dUMP bound form). The two probes with larger 13C CSPs are L192 and L221, which are the two closest residues to the dUMP binding site of the 10 shown here. Interestingly, the 13C CSP for L192 alone actually agrees very well with its 13C Δω. In addition, the 1H CSP for L192 (0.3407 ppm) agrees reasonably well with the magnitude of its 1H Δω (0.224±0.006) given its proximity to the substrate. This suggests that perhaps there is some localized change in the environment of L192 in the substrate bound form that is similar to that seen in the inactive conformation, though this is not supported by the crystal structures 5X5A (apo active) and 5X5D (dUMP bound), which show very little change in L192 and the surrounding residues between these two forms.
Figure 5.
Figure 5.. hTS is significantly rigidified on the ps-ns timescale upon binding both molecules of dUMP, but not upon binding product TMP nor Δ25 binding dUMP.
(a) Overlay of kernel distribution fits to Saxis2 values for dUMP-bound – apo hTS (blue, Figure 5—source data 1–2) and TMP-bound – apo hTS (red, Figure 5—source data 1 and 3). A pronounced shift in the distribution toward higher Saxis2 values (i.e. more rigid) is observed in the case of dUMP binding to hTS. (b) Residues included in the analysis are shown on the active structure of hTS (PDB ID 5X5 A), with the Saxis2 values indicated by red-white-blue gradient. Substrates dUMP and mTHF have been added to the structure in sticks. Overall, more blue (increase in Saxis2 , more rigid) is seen in the case of dUMP binding and more red (decrease in Saxis2 , more flexible) in the case of TMP binding, consistent with the overlay of distributions in (a). (c) Overlay of kernel distribution fits to Saxis2 values for dUMP-bound – apo full length hTS (blue) and dUMP-bound – apo Δ25 hTS (green, Figure 5—source data 4–5). Again, the distribution is shifted towards higher Saxis2 values in the case of dUMP binding to full length hTS, though the difference is less pronounced in this case. (d) There is a correlation between the difference in binding entropies, -T(Sbind,2-Sbind,1), and the change in conformational entropy upon binding both nucleotide molecules. The X% lig1 lines indicate what the -TSconf would have to be to produce a given -TSbind if all of the change in binding entropy stems from changes in conformational entropy and X% of the -TSconf occurs upon the first binding event. Error bars are based on fits of Monte Carlo simulated datasets (see Materials & Methods).
Figure 6.
Figure 6.. Colocalization of probes showing suppression of slow process and large order parameter change upon dUMP binding.
Residues having large changes in order parameter are shown in red and residues involved in the slow process on the µs-ms timescale are shown in blue. Probes which meet both of these criteria are shown in purple, while the rest are shown in gray. Of the six probes shown here that are involved in the slow process, four also have large order parameter changes. The two that do not are nearby probes which do have large order parameter changes (purple ovals). While the three remaining red probes, L85, L88, and L89 (purple *), are not near probes identified as being involved in the slow process in our dispersion analysis, the nearby residue V84 clearly shows dynamics on the µs-ms timescale in a 1H CPMG 2-plane experiment (Figure 6—figure supplement 1).
Figure 6—figure supplement 1.
Figure 6—figure supplement 1.. apo hTS 1 H CPMG 2-plane shows µs-ms motion in folate binding helix.
The two-plane CPMG experiment provides R2=R250 Hz υcpmg-R2(2000 Hz υcpmg), in other words the magnitude of Rex seen on the CPMG timescale. Notably, we see clear Rex in V84, and to a lesser extent L85, in the folate binding helix. This suggests that this helix may be involved in the slow, concerted process as well.
Figure 6—figure supplement 2.
Figure 6—figure supplement 2.. ps-ns motions may be necessary, but are not sufficient, to enable concerted µs-ms motion.
In full length apo hTS, residues involved in the slow, concerted process almost exclusively have relatively low order parameters (Saxis2<0.6), indicating that they are dynamic on the ps-ns timescale (top). The one exception to this is L101. This suggests that these faster timescale dynamics may enable the slow motion occurring at these sites, as has been proposed previously. However, there is very little change in the order parameters for these probes in Δ25 hTS (bottom), which lacks the concerted µs-ms motion. This indicates that while ps-ns motion may play a significant role in enabling concerted µs-ms motion, these faster dynamics are not sufficient to produce the slower motion.
Figure 7.
Figure 7.. hTS-TMP and Δ25 hTS are structurally similar to hTS-dUMP and full length hTS, respectively.
CSPs between hTS-TMP and hTS-dUMP, ωH,TMP-ωH,dUMP2+0.25*ωC,TMP-ωC,dUMP2 , are shown on the apo active structure (5X5A) with the substrate dUMP added in sticks (a).The largest CSPs are often seen at the dimer interface, consistent with the idea that there is a difference in the intersubunit communication in the binding of these two nucleotides. Notably, almost all of the ILV probes on the beta sheet at the interface are in this group, including I178, L198, L212, I249, and L252. Overall, and strikingly, the magnitudes of the CSPs are very similar to that of dUMP binding to the apo enzyme, as can be seen in the distributions of these values (b). Since there is little structural change in hTS upon dUMP binding, this suggests that there is also little structural difference overall between hTS-TMP and hTS-dUMP. An overlay of HMQC spectra can be found in Figure 7—figure supplement 1. Even more strikingly, there are essentially no perturbations of the chemical shifts between apo full length and Δ25 hTS, as seen in an overlay of HMQC spectra of the Leu and Val methyls (c), suggesting that these two structures are virtually identical. The only major difference between these two spectra is the loss of resonances from N-terminal probes V3, L8, and L13 in the Δ25 spectrum, as expected. The signal marked with an asterisk is aliased in the Δ25 spectrum.
Figure 7—figure supplement 1.
Figure 7—figure supplement 1.. Overlay of hTS-dUMP and hTS-TMP ILV HMQC spectra.
The ILV HMQC spectrum of hTS-dUMP is shown in black, while that of hTS-TMP is shown in red. Several of the probes on the interface of hTS showing noticeable CSPs, which were highlighted in Figure 7, are annotated.
Figure 8.
Figure 8.. Thermodynamic cycle shows that the N-terminus contributes significantly to the rigidification on the ps-ns timescale of hTS upon dUMP binding.
(a) Thermodynamic cycle involving addition/removal of the N-terminus (full length vs. Δ25 hTS) and dUMP binding. Values are shown next to each step of paths A and B (note that nonidentical sets of probes were used to calculate the changes at each step, leading to the apparent difference between paths A and B). The sum of these values between steps 1 and 3 of path B (or equivalently, the difference between path A and step 2 of path B) represents the coupling between the N-terminus and dUMP binding, and this coupling is larger than the change in step 2 of path B; this identifies the N-terminus as being a key contributor to the overall change in conformational entropy upon dUMP binding. (b) Changes in methyl order parameter values between steps 1 and 3 of path B are shown on the active structure, with their values indicated by the red-white-blue gradient. Probes in blue are those which contribute to the rigidification upon dUMP binding that is coupled to the N-terminus (i.e. these probes are more rigidified upon dUMP binding in full length hTS than in Δ25 hTS). Probes showing the greatest rigidification are L121 and V158.
Figure 8—figure supplement 1.
Figure 8—figure supplement 1.. Backbone probes from N-terminus have small perturbations in chemical shift and transverse relaxation rate upon dUMP binding.
(a) CSPs between apo and dUMP bound states for backbone amides are shown by the blue bars (left). N-terminal residues are indicated by the black box. Green bars indicate unassigned residues. CSPs are calculated as (ωH,dUMPωH,apo)2+0.15(ωN,dUMPωN,apo)2  where is the chemical shift of nucleus X in state y. Changes in Cα chemical shifts upon dUMP binding are shown by the black bars (right). The amide CSPs and changes in Cα shifts for the N-terminal residues are very small relative to the rest of the protein. (b) Transverse relaxation rates of backbones amides are shown for apo (black, Source data 5 and 6) and dUMP bound (blue, Source data 10 and 11) states. N-terminal residues are highlighted by the black box, where only subtle changes in the rates are seen.
Appendix 1—figure 1.
Appendix 1—figure 1.. B↔A↔C model is most appropriate for many probes involved in the slow, concerted process.
8 of 10 probes involved in the concerted process show 3-state exchange. For some probes, such as L192, L198, and I237, this can be clearly seen by comparison the goodness of fit of the 3-state and 2-state models (Supplementary file 1). In other cases, the difference in goodness of fit is much smaller, and additional justification for applying a 3-state model can be gained in other ways. In the case of L101 (methyl 2), while the slow process is clearly seen in the CEST data, the presence of the faster process is supported by the fact that this process is clearly seen in the other methyl group (methyl 1) of the same residue (a). In the case of V79, visual inspection of the MQ CPMG profile at 850 MHz shows a clear elevation of the first two points that is captured only by the 3-state fit (b). This difference is most likely not reproduced clearly in the χred2 because there are many more data points in the CEST data compared to the CPMG, giving the CEST data a larger weight than the CPMG in the norm of the residuals (i.e. the CEST data makes a larger contribution to χred2 than the CPMG). Error bars are based on duplicate point RMSD (see Materials & Methods).
Appendix 1—figure 2.
Appendix 1—figure 2.. Δ25 hTS lacks the slow, concerted process, but retains faster µs-ms motion.
Global fits of 3 CPMG datasets (2 fields of MQ, 1 field of 13C SQ, Appendix 1—figure 2—source data 1–3) for individual probes show that the probes undergoing 3-state exchange in full length apo hTS are well described by a 2-state model in apo Δ25 hTS (a). Error bars are based on duplicated point RMSD (see Materials & Methods). 13C Δω’s for Δ25 hTS agree reasonably well with those from the fast process for full length apo hTS (b), suggesting that similar configurations are being accessed in both cases. Error bars are based on fits to 200 Monte Carlo simulated datasets (see Materials & Methods). 1D selective CEST on L198 confirms the loss of the slow process in Δ25 hTS (c). Error bars are based on 1x base plane noise.
Appendix 1—figure 3.
Appendix 1—figure 3.. Lack of cooperativity in full length hTS binding TMP and Δ25 hTS binding dUMP.
(a) Global fit of ITC data for TMP binding to hTS with three enzyme concentrations (Appendix 1—figure 3—source data 1–3). (b) ΔGi , ΔHi , and -TΔSi for binding event i from ITC fits are shown for full length hTS binding dUMP (blue), Δ25 hTS binding dUMP (green, Appendix 1—figure 3—source data 4–6), and full length hTS binding TMP (red, Appendix 1—figure 3—source data 1–3). ΔG2 is ~1.3 kcal/mol more negative than ΔG1 for full length hTS binding dUMP, indicating ~9 fold positive cooperativity (Bonin et al., 2019). For both Δ25 hTS binding dUMP and full length hTS binding TMP, ΔG1G2 , indicating that the binding is non-cooperative. Error bars are based on fits to Monte Carlo simulated datasets (see Materials & Methods).

References

    1. Alocci D, Bernini A, Niccolai N. Atom depth analysis delineates mechanisms of protein intermolecular interactions. Biochemical and Biophysical Research Communications. 2013;436:725–729. doi: 10.1016/j.bbrc.2013.06.024. - DOI - PubMed
    1. Anderson AC, O’Neil RH, DeLano WL, Stroud RM. The structural mechanism for half-the-sites reactivity in an enzyme, thymidylate synthase, involves a relay of changes between subunits. Biochemistry. 1999;38:13829–13836. doi: 10.1021/bi991610i. - DOI - PubMed
    1. Baker WN. A new comparison of the viscosity of D2O with that of H2O. Journal of Chemical Physics. 1936;4:294. doi: 10.1063/1.1749842. - DOI
    1. Berlin K, Longhini A, Dayie TK, Fushman D. Deriving quantitative dynamics information for proteins and rnas using ROTDIF with a graphical user interface. Journal of Biomolecular NMR. 2013;57:333–352. doi: 10.1007/s10858-013-9791-1. - DOI - PMC - PubMed
    1. Bernini A, Venditti V, Spiga O, Niccolai N. Probing protein surface accessibility with solvent and paramagnetic molecules. Progress in Nuclear Magnetic Resonance Spectroscopy. 2009;54:278–289. doi: 10.1016/j.pnmrs.2008.10.003. - DOI

Publication types