. 2022 Nov 7;154(11):e202213136.
doi: 10.1085/jgp.202213136. Epub 2022 Oct 6.

Mice with R2509C-RYR1 mutation exhibit dysfunctional Ca2+ dynamics in primary skeletal myocytes

Affiliations

Mice with R2509C-RYR1 mutation exhibit dysfunctional Ca2+ dynamics in primary skeletal myocytes

Yoshitaka Tsuboi et al. J Gen Physiol. .

Abstract

Type 1 ryanodine receptor (RYR1) is a Ca2+ release channel in the sarcoplasmic reticulum (SR) of the skeletal muscle and plays a critical role in excitation-contraction coupling. Mutations in RYR1 cause severe muscle diseases, such as malignant hyperthermia, a disorder of Ca2+-induced Ca2+ release (CICR) through RYR1 from the SR. We recently reported that volatile anesthetics induce malignant hyperthermia (MH)-like episodes through enhanced CICR in heterozygous R2509C-RYR1 mice. However, the characterization of Ca2+ dynamics has yet to be investigated in skeletal muscle cells from homozygous mice because these animals die in utero. In the present study, we generated primary cultured skeletal myocytes from R2509C-RYR1 mice. No differences in cellular morphology were detected between wild type (WT) and mutant myocytes. Spontaneous Ca2+ transients and cellular contractions occurred in WT and heterozygous myocytes, but not in homozygous myocytes. Electron microscopic observation revealed that the sarcomere length was shortened to ∼1.7 µm in homozygous myocytes, as compared to ∼2.2 and ∼2.3 µm in WT and heterozygous myocytes, respectively. Consistently, the resting intracellular Ca2+ concentration was higher in homozygous myocytes than in WT or heterozygous myocytes, which may be coupled with a reduced Ca2+ concentration in the SR. Finally, using infrared laser-based microheating, we found that heterozygous myocytes showed larger heat-induced Ca2+ transients than WT myocytes. Our findings suggest that the R2509C mutation in RYR1 causes dysfunctional Ca2+ dynamics in a mutant-gene dose-dependent manner in the skeletal muscles, in turn provoking MH-like episodes and embryonic lethality in heterozygous and homozygous mice, respectively.


Figures

Figure S1.
Figure S1.
Morphology of R2509C RYR1 homozygous embryos. Three R2509C-Hom fetuses (E19−E20) were obtained from different heterozygous mothers. The fetuses showed abnormal death accompanied by subcutaneous hemorrhage (yellow arrows; mice 1–3), subcutaneous effusion (white arrows; mice 1 and 2), and translucent skeletal muscles (black line circle; mouse 3).
Figure 1.
Figure 1.
Morphological characteristics of primary myocytes from WT and R2509C-RYR1 mice. (A) Bright-field images of primary myocytes derived from WT (left) and R2509C-RYR1 mice (R2509C-Het [middle] and R2509C-Hom [right]) at 3 d after differentiation. Myocytes highlighted by red lines (also indicated by yellow arrows) are shown in the kymographs at the bottom (i.e., time-dependent changes in contrast). (B) Confocal images showing immunostained MHC (MF20) in red and nuclei stained with 4′,6-diamidino-2-phenylindole (DAPI) in cyan in primary myocytes. Left, middle, and right indicate WT, R2509C-Het, and R2509C-Hom myocytes, respectively. (C) Expression levels of MHC in myocytes. Left: Western blotting showing MHC and the loading control glyceraldehyde-3-phosphate dehydrogenase (GAPDH) in myocytes expressing WT, R2509C-Het (Het), and R2509C-Hom (Hom) myocytes. Molecular mass standards are shown on the right (kD). Right: Graph showing MHC/GAPDH analyzed from band intensities in Western blotting in WT, Het, and Hom. Data normalized by that of WT at day 3. Data are means ± SD (n = 4–6) and analyzed by two-way ANOVA with Tukey’s test. Primary myocytes were cultured from three mice (N = 3) in each group.
Figure 2.
Figure 2.
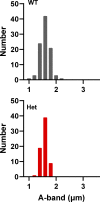
Analysis of sarcomeres in WT and R2509C-RYR1 primary myocytes. (A) TEM images of thin epoxy resin sections of primary cultured myocytes at 3 d after differentiation. Right panels show higher magnification of the area depicted by white-outlined squares in left panels. Sarcomere structure was preserved in WT (top), R2509C-Het (middle), and R2509C-Hom (bottom) myocytes. SL was measured as the distance between Z-lines (shown by yellow bidirectional arrows). A, I, and Z indicate the A-band, I-band, and Z-line, respectively. (B) TEM images of thin epoxy resin sections of primary cultured myocytes at 3 d after differentiation in the presence of Cpd1. Cpd1 was added at 2 µM from the onset of differentiation. Sarcomere structure was preserved in R2509C-Hom myocytes. SL was measured as the distance between Z-lines (shown by yellow bidirectional arrows). A, I, and Z indicate the A-band, I-band, and Z-line, respectively. (C) Graph showing SL in WT, R2509C-Het, R2509C-Hom, and R2509C-Hom (Cpd1) myocytes and the A-band length in WT and R2509C-Het myocytes. SL was significantly shorter in R2509C-Hom (1.7 ± 0.3 µm, n = 106 from 18 cells) myocytes than in WT (2.2 ± 0.3 µm, n = 95 from 15 cells) or R2509C-Het (2.3 ± 0.4 µm, n = 68 from 11 cells) myocytes. No significant difference was observed in the A-band length between groups (WT, 1.6 ± 0.1 µm, n = 95 from 15 cells; Het, 1.6 ± 0.1 µm, n = 68 from 11 cells; see Fig. S2). As indistinct I-bands were coupled with marked myofibrillar shortening in R2509C-Hom myocytes (see A), the A-band length was not measured to avoid errors. Treatment with Cpd1 significantly increased SL of R2509C-Hom (2.0 ± 0.3 µm, n = 60 from 14 cells) myocytes. Values are shown as mean ± SD. Statistical significance was determined using a one-way ANOVA with Tukey’s test. Primary myocytes were cultured from three mice (N = 3) in each group. (D) Frequency histograms of SL in C. Gaussian fittings showed peaks at 2.2 and 2.3 µm for WT and R2509C-Het, respectively. Histograms for R2509C-Hom and R2509C-Hom+Cpd1 were analyzed by two Gaussians, with one of the peaks fixed at 2.2 µm. Shorter peaks for R2509C-Hom and R2509C-Hom+Cpd1 were 1.6 and 1.8 µm, respectively.
Figure S2.
Figure S2.
Distribution of the lengths of A-band in WT and R2509C-Het primary myocytes. The frequency histogram for A-band length in Fig. 2 C.
Figure S3.
Figure S3.
Spontaneous Ca2+ transients in WT and R2509C mutant primary myocytes. (A–C) Ca2+ transients in Cal-520–loaded primary myocytes at 3 d after differentiation from WT (A), R2509C-Het (B), and R2509C-Hom (C) mice were measured for 200 s with no stimulation. Different color lines indicate individual signals. Spontaneous Ca2+ transients were observed in primary myocytes from WT (Video 4) and R2509C-Het (Video 5) mice, but not in those from R2509C-Hom (Video 6) mice. (D) Number of myocytes demonstrating spontaneous Ca2+ transients out of total number of myocytes in the field of view during each observation, in which Ca2+ transients were measured for 200 s with no stimulation. The number at the top of bar indicates total number of positive myocytes out of total number of myocytes. Primary myocytes were cultured from three mice (N = 3) in each group (WT, R2509C-Het, and R2509C-Hom). Data are means ± SD (n = 4−5 observations) and analyzed by one-way ANOVA with Tukey’s test.
Figure 3.
Figure 3.
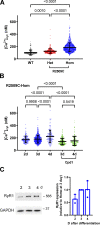
Properties of resting [Ca2+]cyt in WT and R2509C-RYR1 primary myocytes. (A) Comparison of resting [Ca2+]cyt in primary myocytes from WT (n = 205, N = 3), R2509C-Het (Het; n = 257, N = 3), and R2509C-Hom (Hom; n = 776, N = 4) mice. [Ca2+]cyt was determined using fura-2. (B) Resting [Ca2+]cyt in R2509C-Hom myocytes at 2 (176.6 ± 54.3 nM: n = 148, N = 3), 3 (179.5 ± 63.2 nM: n = 494, N = 4), and 4 (222.5 ± 100.3 nM: n = 134, N = 3) days after differentiation, and at 3 (140.6 ± 52.7 nM: n = 230, N = 3) and 4 (151.4 ± 73.5 nM: n = 151, N = 3) days after differentiation in the presence of Cpd1. Cpd1 was added at 2 µM at the onset of differentiation. Values are mean ± SD. Statistical significance was determined using one-way ANOVA with Tukey’s test. (C) Expression levels of RYR1 in R2509C-Hom myocytes. Western blotting showing RYR1 and loading control GAPDH. Molecular mass standards are shown on the right (kD). In the graph on the right, data were normalized based on the values at day 3. Data are means ± SD (N = 3) and analyzed by one-way ANOVA with Tukey’s test. “n” is the number of myocytes and “N” is the number of animals.
Figure 4.
Figure 4.
Ca2+ transients by electrical stimulation or caffeine and KCl application in WT and R2509C-RYR1 primary myocytes. (A) Left: Typical time course of Ca2+ transients induced by platinum field electrode stimulation (electrical stimulation; ES) in WT, R2509C-Het (Het), and R2509C-Hom (Hom) myocytes measured using Cal-520. The fluorescence intensity F was normalized to the initial value of F (F0). Right: Graph showing peak amplitudes (Fmax/F0) of ES in WT (n = 176, N = 3), R2509C-Het (Het, n = 384, N = 4), and R2509C-Hom (Hom, n = 194, N = 3) primary myocytes. The horizontal dotted line indicates F0. Values are mean ± SD. (B) K+-induced depolarization in WT, R2509C-Het (Het) and R2509C-Hom (Hom) myocytes. KCl (7–60 mM) was applied at the time points indicated by the grey horizontal bar. Values are mean ± SEM (n = 36–107, N = 3, see Table 2). (C) Left: The magnitude of the peak Ca2+ transients was plotted against KCl concentrations and fitted to the dose–response curve in WT (black), R2509C-Het (red), and R2509C-Hom (blue). Right: Normalized for maximal peak amplitudes (Fmax/F0) to KCl. To eliminate run-down, only one dose was administered to the myocytes and the Ca2+ response was analyzed. (D) Ca2+ transients induced by caffeine in WT, R2509C-Het (Het), and R2509C-Hom (Hom) myocytes measured using Cal-520. Caffeine (0.1–20 mM) was applied at the time points indicated by the grey horizontal bar. Values are mean ± SEM (n = 20–104, N = 3, see Table 2). (E) Left: The magnitude of the peak Ca2+ transients was plotted against caffeine concentrations and fitted to the dose–response curve in WT (black), R2509C-Het (red), and R2509C-Hom (blue). Right: Normalized for maximal peak amplitudes (Fmax/F0) to caffeine. Curves are fittings based on the Hill equation: R=Bottom+TopBottom×Cn'/Cn'+kn', where R, C, k, and n' represent the normalized response, either KCl or caffeine concentration, EC50 and Hill coefficient. Bottom and Top represent the maximum and minimum responses. Statistical significance was determined using a one-way ANOVA with Tukey’s test. Cells on days 2–4 after differentiation were analyzed. “n” indicates the number of myocytes, and “N” the number of animals.
Figure 5.
Figure 5.
Heat-induced Ca2+ release in WT and R2509C-RYR1 primary myocytes. (A) Averaged fluorescence images of Cal-520–loaded WT myocytes before (left) and during heating (middle). Images captured for 1.2 s were averaged. Image on the right indicates the differences in fluorescence intensity between the left and middle images (ΔF/F0). A closed red circle indicates the position of focused infrared (IR) laser beam for micro-heating. (B) Time-course of fluorescence intensity of Cal-520 in WT myocytes. Each line represents an individual primary myocyte. The pink vertical bar indicates the period of a heat pulse. (C) Same as in A for R2509C-Het myocytes. (D) Same as in B for R2509C-Het myocytes. (E) Same as in A for R2509C-Hom myocytes. (F) Same as in B for R2509C-Hom myocytes. (G–I) Time-dependent analyses in WT (G), R2509C-Het (H), and R2509C-Hom (I) myocytes. The Ca2+ levels before (F0), during (14–15 s) and after (19–20 s) heating were analyzed. Thin lines represent individual cells, and thick line and squares represent averages. Data are analyzed by repeated measures one-way ANOVA with Tukey's multiple comparisons tests. (J) Basal fluorescence intensities of Cal-520 in WT, R2509C-Het, and R2509C-Hom myocytes before heating (F0). (K) Maximum changes in the relative fluorescence intensity of Cal-520 during heating (ΔFmax/F0). Dotted horizontal line indicates the baseline. WT: n = 14, N = 3; R2509C-Het: n = 72, N = 4; R2509C-Hom: n = 66, N = 4. Myocytes from WT mice were analyzed 3 d after the onset of differentiation and those from R2509C-Het and R2509C-Hom 2–4 d after the onset of differentiation. Values are shown as mean ± SD. Statistical significance was determined using a one-way ANOVA with Tukey’s test. ΔT = 11 ± 2°C; T0 = 24 ± 1°C. “n” is the number of myocytes and “N” is the number of animals.
Figure S4.
Figure S4.
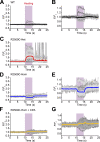
Heat-induced Ca2+ release in WT and R2509C primary myocytes. Time course of relative intensity of Cal-520–loaded primary myocytes from WT (A and B), R2509C-Het (C), R2509C-Hom (D and E), and R2509C-Hom + 20 μM CPA (F and G) mice. Figures in B, E, and G indicate enlarged images of A, D, and F, respectively.
Figure 6.
Figure 6.
Effect of cyclopiazonic acid on heat-induced Ca2+ release in R2509C-Hom primary myocytes. (A) Averaged fluorescence images of Cal-520–loaded R2509C-Hom myocytes in the presence of 20 μM CPA before (left) and during heating (middle). Images captured for 1.2 s were averaged. The image on right indicates the differences in fluorescence intensity between left and middle images (ΔF/F0). A closed red circle indicates the position of focused infrared (IR) laser beam for micro-heating. (B) Time-course of fluorescence intensity of Cal-520 in R2509C-Hom + 20 μM CPA. Each line represents an individual primary myocyte. The pink vertical bar indicates the period of a heat pulse. ΔT = 11 ± 2°C; T0 = 24 ± 1°C. (C) Time-dependent analyses of Cal-520 in R2509C-Hom + 20 μM CPA. The fluorescence intensity of Cal-520 before (0–1 s as F0), during (14–15 s), and after (19–20 s) the heating in R2509C-Hom + 20 μM CPA. Thin lines represent individual cells. Thick line and squares represent averages. Data were analyzed by repeated measures one-way ANOVA with Tukey’s multiple comparisons tests. (D) Minimum values in the relative fluorescence intensity of Cal-520 during heating [(FminF0) / F0]. Dotted horizontal line indicates the baseline. R2509C-Hom: n = 66, N = 4; R2509C-Hom + 20 μM CPA: n = 30, N = 3. Values are mean ± SD. Statistical significance was determined using a one-way ANOVA with Tukey’s test. ΔT = 11 ± 2°C; T0 = 24 ± 1°C. “n” is the number of myocytes and “N” is the number of animals.
Figure 7.
Figure 7.
Measurements of [Ca2+]cyt and temperature of the sarcoplasmic reticulum in FDB fibers during isoflurane application. (A) Bright-field (lower left panels) and fluorescence images of FDB fibers isolated from WT (left) and R2509C-Het (right) mice following co-staining with Cal-520 and ERthermAC. Lower right panels show higher magnification of the area depicted by white-outlined squares in upper right panels. (B) Time course of changes in the relative fluorescence intensity of Cal-520 (top) and ERthermAC (bottom) in WT (left) and R2509C-Het (right) cells. Gray lines represent individual cells. Thick colored lines represent average responses. Isoflurane (1%) was applied at the time points indicated by yellow horizontal bars. Photobleaching of ERthermAC was corrected by a single-exponential fitting (Arai et al., 2014). See Fig. S5 for raw data. (C) Maximum values (Fmax/F0) in the relative fluorescence intensity of Cal-520 (left) and minimum values (Fmin/F0) in the relative fluorescence intensity of ERthermAC (right) during isoflurane application. WT: n = 17, N = 4; R2509C-Het: n = 10, N = 4. Values are means ± SD. Statistical significance was determined using a one-way ANOVA with Tukey’s test. “n” indicates the number of FDB fibers, and “N” the number of animals.
Figure S5.
Figure S5.
Temperature measurement of the SR in FDB isolated skeletal cells during isoflurane application. Time course of changes in the relative fluorescence intensity of ERthermAC in WT (A) and R2509C-Het (B) cells. Gray lines represent individual cells, and thick lines represent averages. Isoflurane (1%) was applied at the time points indicated by yellow horizontal bars.
Figure S6.
Figure S6.
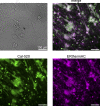
ERthermAC staining in primary myocytes. Representative images of bright-field (top left), and fluorescence images of WT primary myocytes co-stained with Cal-520 (bottom left) and the SR/ER-targeted fluorescent molecular thermometer ERthermAC (bottom right). Merged image is shown on the top right. Cal-520 was excited at 480 ± 9 nm, and fluorescence was imaged at 520 ± 14 nm. ERthermAC was excited at 556 ± 10 nm, and fluorescence was imaged at 617 ± 37 nm.

Similar articles

Cited by

References

    1. Aley, P.K., Mikolajczyk A.M., Munz B., Churchill G.C., Galione A., and Berger F.. 2010. Nicotinic acid adenine dinucleotide phosphate regulates skeletal muscle differentiation via action at two-pore channels. Proc. Natl. Acad. Sci. USA. 107:19927–19932. 10.1073/pnas.1007381107 - DOI - PMC - PubMed
    1. Allard, B. 2018. From excitation to intracellular Ca2+ movements in skeletal muscle: Basic aspects and related clinical disorders. Neuromuscul. Disord. 28:394–401. 10.1016/j.nmd.2018.03.004 - DOI - PubMed
    1. Arai, S., Lee S.-C., Zhai D., Suzuki M., and Chang Y.T.. 2014. A molecular fluorescent probe for targeted visualization of temperature at the endoplasmic reticulum. Sci. Rep. 4:6701. 10.1038/srep06701 - DOI - PMC - PubMed
    1. Balnave, C.D., and Allen D.G.. 1996. The effect of muscle length on intracellular calcium and force in single fibres from mouse skeletal muscle. J. Physiol. 492 ( Pt 3):705–713. 10.1113/jphysiol.1996.sp021339 - DOI - PMC - PubMed
    1. Boncompagni, S., Rossi A.E., Micaroni M., Hamilton S.L., Dirksen R.T., Franzini-Armstrong C., and Protasi F.. 2009. Characterization and temporal development of cores in a mouse model of malignant hyperthermia. Proc. Natl. Acad. Sci. USA. 106:21996–22001. 10.1073/pnas.0911496106 - DOI - PMC - PubMed

Publication types

Substances